Not worth the risk: apex predators suppress herbivory on coral reefs
←
→
Page content transcription
If your browser does not render page correctly, please read the page content below
Oikos 123: 829–836, 2014
                                                                                                                  doi: 10.1111/oik.01318
                                                                                 ©2014 The Authors. Oikos © 2014 Nordic Society Oikos
                                                                                     Subject Editor: Peter Todd. Accepted 3 January 2014

Not worth the risk: apex predators suppress herbivory
on coral reefs

Justin R. Rizzari, Ashley J. Frisch, Andrew S. Hoey and Mark I. McCormick
J. R. Rizzari (justin.rizzari@my.jcu.edu.au), A. J. Frisch, A. S. Hoey and M. I. McCormick, Australian Research Council Centre of Excellence
for Coral Reef Studies, James Cook Univ., Townsville, Queensland 4811, Australia. JRR and MIM also at: School of Marine and Tropical
Biology, James Cook University, Townsville, Queensland 4811, Australia.

        Apex predators are known to exert strong ecological effects, either through direct or indirect predator–prey interactions.
        Indirect interactions have the potential to influence ecological communities more than direct interactions as the effects
        are propagated throughout the population as opposed to only one individual. Indirect effects of apex predators are well
        documented in terrestrial environments, however there is a paucity of information for marine environments. Furthermore,
        manipulative studies, as opposed to correlative observations, isolating apex predator effects are lacking. Coral reefs are one
        of the most diverse ecosystems, providing a useful model system for investigating the ecological role of apex predators
        and their influence on lower trophic levels. Using predator models and transplanted macroalgae we examined the indirect
        effects of predators on herbivore foraging behaviour. We show that the presence of a model reef shark or large coral-grouper
        led to a substantial reduction in bite rate and species richness of herbivorous fishes and an almost absolute localized ces-
        sation of macroagal removal, due to the perceived risk of predation. A smaller-sized coral-grouper also reduced herbivore
        diversity and activity but to a lesser degree than the larger model predators. These indirect effects of apex predators on the
        foraging behaviour of herbivores may have flow-on effects on the biomass and distribution of macroalgae, and the func-
        tioning of coral reef ecosystems. This highlights that the ecological interactions and processes that contribute to ecosystem
        resilience may be more complex than previously assumed.

Predation is arguably one of the most influential selection               effect on the structure and functioning of entire ecosystems
pressures acting on living organisms and can play a vital role           (Preisser et al. 2005, Creel and Christianson 2008, Madin
in not only regulating prey populations, but also shaping                et al. 2010a). Given the severe consequences that a predation
entire communities (Paine 1966, Hixon et al. 2002). In par-              event poses, prey are under considerable pressure to success-
ticular, changes in the density and distribution of large-bod-           fully detect and avoid predators. Prey species often alter their
ied or apex predators can exert strong ecological effects that            behaviour and/or foraging patterns in response to changes in
cascade through an entire ecosystem (Estes et al. 1998, 2011,            predation risk, and this in turn may influence the distribu-
Ripple et al. 2001, 2014, Frank 2008, Sandin et al. 2008).               tion and/or abundance of the prey’s resources (Ripple et al.
Apex predators are typically characterized by conservative               2001, 2014). In particular, increased predation risk indirectly
life history traits, such as slow growth rates, late sexual matu-        influences the foraging patterns of herbivores, which can lead
rity, and low fecundity, and are often preferentially targeted           to changes in plant diversity, productivity, nutrient cycling,
by humans for food or game (Pauly et al. 1998, Myers and                 trophic transfer efficiency and energy flux (Schmitz et al.
Worm 2003). Consequently, apex predators are often the                   2008). For example, African herbivores change their habitat
first to be become extinct or locally extirpated. Understand-             preference to more open habitats when in the presence of
ing the roles that apex, and other large-bodied predators play           predatory lions, presumably as a response to the increased
in shaping ecological communities is becoming increasingly               ability to detect predators in these areas (Valeix et al. 2009).
important as natural communities become progressively                    Similarly, increased populations of wolves and other large
more disturbed.                                                          carnivores in Yellowstone National Park reduced and redis-
    The effects of predators on ecological communities may                tributed herbivorous elk populations, subsequently decreas-
manifest through either direct (i.e. consumptive) or indirect            ing herbivory and increasing tree height in high predation
(i.e. non-consumptive) interactions (reviewed by Schmitz                 risk areas (Fortin et al. 2005, Ripple et al. 2014). Although
et al. 2004). Although studies reporting direct effects of                these indirect predator–prey interactions are ubiquitous in
predators on ecosystems are common (Estes et al. 1998,                   ecological communities (e.g. terrestrial: Rypstra and Buddle
Ripple et al. 2014), there is a growing body of evidence that            2012; aquatic: Peacor and Werner 2001; marine: Frid et al.
the indirect effects of predators can have an equally dramatic            2012), there is a paucity of information on the effects of

                                                                                                                                         829
large-bodied or apex predators in tropical marine ecosystems in the northern Great Barrier Reef (GBR), Australia (Supple-
(but see Madin et al. 2010a). mentary material Appendix 1 Fig. A1). To quantify the effect
Coral reefs are one of the world’s most taxonomically of predators on the consumption of macroalgae, bioassays of
diverse ecosystems, harboring approximately 5000 species of Sargassum were transplanted to two sites both in the presence
fishes that perform numerous functions and create a com- and absence of model predators. Sargassum was selected as it
plex network of species interactions (Sheppard et al. 2009). is locally abundant on inshore reefs of the GBR, has been
Worldwide, overfishing and habitat degradation has greatly used extensively in previous studies (McCook 1996, Hoey
contributed to the decline of reef fish populations (Jackson and Bellwood 2010), and is the dominant taxon following
et al. 2001), particularly apex predators such as reef sharks coral–algal phase-shifts on Indo-Pacific reefs (Hughes et al.
(family Carcharhinidae), groupers (family Serranidae) and 2007, Rasher et al. 2013). Model predator species included
trevally (family Carangidae) (Friedlander and DeMartini the coral-grouper and the blacktip reef shark. Coral-grouper
2002, Robbins et al. 2006, Nadon et al. 2012). The con- hover over reefs near schools of prey for long periods, while
tribution of apex predators to the well being of coral reef blacktip reef sharks are more mobile. Both species are known
ecosystems is unclear, but is potentially important (Heithaus to have small to moderate home ranges and exhibit high lev-
et al. 2008, Ruppert et al. 2013). For instance, differences els of site fidelity (Zeller 1997, Papastamatiou et al. 2011).
in population parameters (e.g. size, longevity, reproduction
and body condition) of prey fishes (Ruttenberg et al. 2011, Experimental design
Walsh et al. 2012), and rates of coral recruitment and dis-
ease (Sandin et al. 2008) have been correlated to variation in Sargassum swartzii (Ochrophyta: Phaeophyceae) was col-
apex predator density, however little experimental evidence lected from the windward reef flat of inshore reefs in the
exists (see Madin et al. 2010a for exception). Thus, a better Turtle Island Group (14°43′S, 145°212′E), approximately
understanding of apex predators and their ecological role is 25 km west of Lizard Island (Supplementary material Appen-
imperative for guiding management actions that aim to pre- dix 1 Fig. A1). Individual Sargassum thalli of similar height
serve or enhance ecosystem resilience. (ca 50 cm) were removed by cutting the holdfast as close
Herbivorous fishes perform a critical ecosystem function to the point of attachment as possible. All Sargassum were
on coral reefs, mediating the competition for space between returned to Lizard Island and placed in a large aquarium with
corals and algae. Reductions in the densities of herbivorous flow-through seawater within 90 min of collection. Individ-
fishes underpin the expansion of macroalgae in many reef sys- ual Sargassum thalli were spun in a mesh bag for 30 s to
tems (Hughes et al. 2007, Rasher et al. 2013). While such remove excess water, weighed (mean ⫽ 79.2 g ⫾ 2.9 standard
reductions in herbivory have been linked to overfishing of the error, SE) and randomly allocated to one of six treatments:
herbivores themselves (Williams and Polunin 2001, Mumby three predator treatments, a predator-absent treatment, an
et al. 2007), similar responses may manifest through changes object control, and a herbivore exclusion control. To test the
in predator communities (Ruppert et al. 2013). Outputs of effect of predator presence on herbivory, we used realistic
theoretical models suggest that changes in apex predator den- models constructed of fiberglass taxidermic casings (Fig. 1).
sity could indirectly influence macroalgal biomass via meso- Three predator-present treatments consisted of a blacktip
predator release and/or changes in prey behaviour (Bascompte reef shark (170 cm total length, TL), a large coral-grouper
et al. 2005). Two previous studies examining the effects of (76 cm TL) or a small coral-grouper (48 cm TL). Three dif-
predators on herbivores revealed that differences in foraging ferent sized predators were used to simulate a gradient in pre-
behaviour (i.e. distance from shelter) were related to predator dation risk (i.e. high for the reef shark, medium for the large
densities (Madin et al. 2010a, 2012), however no study has coral-grouper and low for the small coral-grouper). During
demonstrated a causal relationship between predators, herbi- a pilot study, the small coral-grouper was attacked by a giant
vore foraging activity and algae consumption. Therefore, the trevally Caranx ignobolis and investigated by a whitetip reef
present study aimed to investigate the effects of apex predators shark Triaenodon obesus suggesting that replicate models
on the foraging behaviour of herbivorous reef fishes. Specifi- were perceived as life-like representations (Supplementary
cally, we examined the effect of predator presence on the con- material Appendix 1 Video A1). The predator-absent treat-
sumption of macroalgae by herbivorous fishes. We selected the ment consisted of a Sargassum thallus in the absence of a
blacktip reef shark Carcharhinus melanopterus and the coral- predator model in order to obtain ‘natural’ rates of herbivory.
grouper Plectropomus leopardus as model apex predator species The object control was a 78 cm length of PVC pipe (12 cm
because they occupy high trophic positions (Speed et al. 2012, diameter), which was intended to control for the effect of
Frisch et al. 2014), are numerically common, geographically any object on herbivore foraging behaviour. An exclusion
widespread, have a broad diet that includes herbivorous fishes cage was used to control for the effects of handling and/or
(Stevens 1984, St. John 1999) and are harvested across their translocation on the reduction in Sargassum biomass. Each
geographic range by fishers (Frisch et al. 2012). treatment was replicated ten times within each of two sites; a
lagoon and a back reef site (Supplementary material Appen-
dix 1 Fig. A1). Replicate treatments were conducted over a
Material and methods 30-day period and the location of each treatment, within
each site, was randomized from day to day.
Study site and species Individual Sargassum thalli were attached to the reef at a
depth of 2–4 m (following the methods of Hoey and Bell-
The study was conducted during November and December wood 2009), and positioned approximately 0.5–1 m in front
2012 on reefs adjacent to Lizard Island (14°40′S, 145°28′E) of model predators (and object control). All Sargassum thalli
830the proportion of initial (or transplanted) biomass that was
removed during 4.5 h on the reef. Similarly, the total number
of bites taken from the Sargassum (for all species combined)
was compared amongst sites and treatments using a two-
factor ANOVA. The proportion of biomass removed and
total bites were arcsine-square root and log10(x ⫹ 1) trans-
formed, respectively, to improve normality and homoscedas-
ticity. ANOVAs were followed by Tukey HSD post hoc tests
to resolve differences between means. Variation in bite rate
of different herbivorous fish species among sites and treat-
ments was analysed using a two-factor multivariate analysis
of variance (MANOVA). Data was log10(x ⫹ 1) transformed
to improve multivariate normality. Significant MANOVA
effects were further examined using Bonferroni-corrected
two-factor ANOVAs (adjusted alpha value of 0.0125) and
Tukey HSD post hoc tests. A two-sample Kolmogorov-
Smirnov test was used to examine the size-frequency distri-
butions of herbivorous fishes observed feeding on Sargassum
between treatments at both sites. In all cases assumptions of
normality and homogeneity of variances were examined a
priori via residual analysis and Bartlett’s test, respectively. All
data in the text and figures are the untransformed arithmetic
mean (⫾ standard error; SE) unless otherwise stated.
Results
The relative removal rates of Sargassum differed among
sites (F1,108 ⫽ 11.05, p ⫽ 0.001) and predator treatments
(F5,108 ⫽ 50.05, p ⬍ 0.001), with the effect of predator treat-
ment being consistent among sites (site ⫻ predator treat-
ment: F5,108 ⫽ 2.03, p ⫽ 0.08). In the absence of a model
predator, or in the presence of the object control, the major-
ity of Sargassum biomass was consumed (57–60%) in the
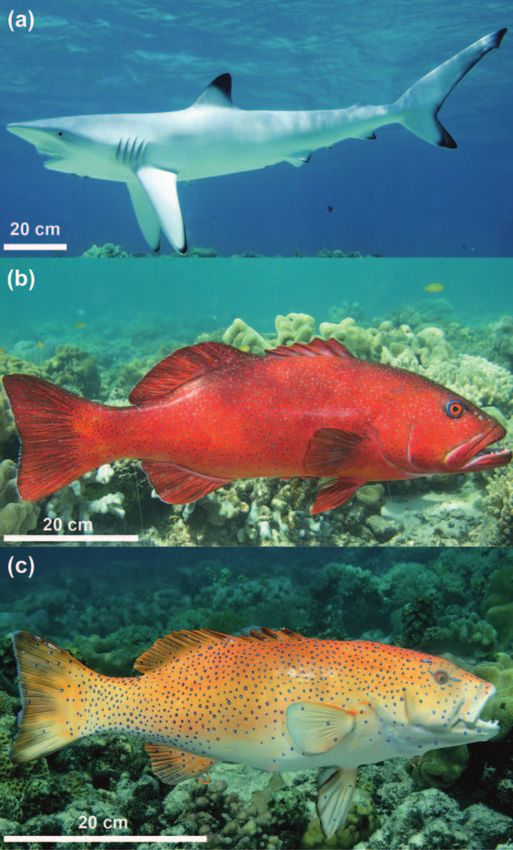
Figure 1. Photographs of the three predator models. (a) blacktip
reef shark, Carcaharinus melanopterus (170 cm total length), (b) 4.5 h period (Fig. 2). There was, however, a ten-fold reduc-
large coral-grouper, Plectropomus leopardus (76 cm total length), tion in the Sargassum biomass consumed in the presence of
and (c) small coral-grouper, P. leopardus (48 cm total length). the two larger predator models at both sites (5–6% 4.5 h⫺1;
Fig. 2). Removal rates of Sargassum in the presence of a small
were deployed between 09:00–11:00 and collected after 4.5 coral-grouper model were intermediate, with 51 and 24%
h. A minimum distance of 50 m separated adjacent treat- 4.5 h⫺1 removed from the lagoon and back reef respectively.
ments within each site. Underwater video cameras were Reductions in Sargassum biomass due to handling were low
placed approximately 3 m from the Sargassum to record any (5% 4.5 h⫺1) and indistinguishable from the large coral-
feeding activity by herbivorous fishes. Filming was contin- grouper and reef shark treatments (Fig. 2).
uous for the 4.5-h experimental period with a small scale Analysis of the video footage revealed that feeding
bar being placed on the focal plane of the Sargassum for activity on the Sargassum was dominated by three species:
approximately 10 s allowing calibration of fish sizes from the the bluespine unicornfish Naso unicornis, the barred
video footage. After 4.5 h, all thalli were collected, spun and rabbitfish Siganus doliatus and the long-finned drummer
weighed as described previously. Filming was conducted at Kyphosus vaigiensis (Fig. 3). In total, 21 853 bites from nine
four of the six treatments (i.e. reef shark, large coral-grouper, fish species were recorded on the transplanted Sargassum
small coral-grouper and predator-absent treatment); the across all treatments and sites, with N. unicornis, S. dolia-
exclusion cage and object control were not filmed as these tus and K. vaigiensis accounting for 93.2% of the bites. The
treatments were established solely to examine the effects of remaining six species (Calotomus carolinus, N. brevirostris,
handling and experimental artifacts, respectively. All video N. lituratus, S. canaliculatus, S. corallinus and S. puellus)
footage was viewed and the number of bites taken from the accounted for 6.8% of bites and were therefore grouped into
Sargassum by each species and size of fishes was recorded. ‘other’ species for subsequent analysis. The overall bite rate
(i.e. for all species combined) varied significantly among
Statistical analyses predator treatments (F3,72 ⫽ 101.79, p ⬍ 0.001), but not
sites (F1,72 ⫽ 2.29, p ⫽ 0.13) or the interaction of site and
To determine if the relative removal rates of Sargassum bio- predator treatment (F3,72 ⫽ 0.78, p ⫽ 0.51). The number
mass varied among sites and treatments, a two-factor analysis of bites taken from the Sargassum was markedly lower in
of variance (ANOVA) was used. The analysis was based on the presence of the reef shark (3.6 ⫾ 1.7 bites 4.5 h⫺1) and
831100 (a) (a) Naso unicornis
90
Siganus doliatus
80
70 a
a Kyphosus vaigiensis
60 a
Other
50
40
Algal mass removed (% per 4.5 h ± SE)
30
20
b b b
10
0 (b)
100 (b)
90
80
a a
70
60
50
40
b
30
20
10 c
c c
0
t
l
rk
e
er
er
tro
en
ag
ha
up
up
bs
on
Figure 3. Mean bite rate per 4.5 h treatment time at (a) lagoon and
C
fs
ro
ro
-a
tc
-g
l-g
ee
or
(b) back reef sites. The relative contributions of the three dominant
ec
al
ra
R
at
or
bj
co
ed
species and other species are shown. Other species include Caloto-
O
lc
Pr
e
al
rg
mus carolinus, Naso brevirostris, N. lituratus, Siganus canaliculatus,
Sm
La
S. corallinus and S. puellus. Letters above each bar indicate homoge-
Figure 2. Relative removal rates of Sargassum among treatments at neous subsets (Tukey’s tests). Note differences in scale on y-axis.
(a) lagoon and (b) back reef sites (n ⫽ 10). The letters above each
bar indicate homogeneous subsets (Tukey’s tests).
In contrast, the feeding rate of K. vaigiensis differed between
sites, but showed no response to the presence of the small
large coral-grouper (3.2 ⫾ 2.7 bites 4.5 h⫺1) models than in coral-grouper (Fig. 4c; Supplementary material Appendix 1
the presence of the small coral-grouper (181 ⫾ 25.4 bites Table A1).
4.5 h⫺1) or in the absence of a predator (905 ⫾ 185.4 bites The species richness of herbivorous fishes recorded feed-
4.5 h⫺1; Fig. 3). Given that feeding was negligible on the ing on the Sargassum was greatest in the absence of a preda-
Sargassum in the presence of the large coral-grouper and reef tor, and decreased with the presence and size of the predator
shark models (Fig. 3), these treatments were not included in models (Supplementary material Appendix 1 Table A2).
any subsequent analyses. This pattern was consistent across both sites (Fisher’s exact
Comparisons of the feeding rates of the four fish taxa test, p ⬎ 0.75). There were also differences in the size fre-
(i.e. N. unicornis, S. doliatus, K. vaigiensis and ‘other’ spe- quency distribution of herbivorous fishes observed feeding
cies) between the predator absent and small coral-grouper in the presence of the small coral-grouper and the predator-
treatments revealed that feeding generally decreased in the absent treatment (Kolmogorov–Smirnov lagoon: D ⫽ 0.16,
presence of the small coral-grouper model, however the p ⬍ 0.001; back reef: D ⫽ 0.59, p ⬍ 0.001) with marked
differences were not consistent among sites or fish taxa reductions in the number of smaller fishes (ⱕ 25 cm TL)
(predator treatment ⫻ site: Pillai’s trace ⫽ 0.34, F4,33 ⫽ 4.18, observed feeding in the presence of the small coral-grouper
p ⫽ 0.008; Fig. 4). The feeding rate of N. unicornis decreased at both sites (Fig. 5).
markedly in the presence of the small coral-grouper at
the back reef site (from 494.7 ⫾ 154.1 to 6.6 ⫾ 6.4 bites
4.5 h⫺1), but displayed no change at the lagoon site (Fig. 4a; Discussion
Supplementary material Appendix 1 Table A1). The feeding
rates of S. doliatus and ‘other’ fishes showed significant and Apex predators are suggested to play a strong role in indi-
consistent declines in the presence of the small coral-grouper rectly influencing populations of trophic levels that are
(Fig. 4b, d; Supplementary material Appendix 1 Table A1). directly linked to ecosystem functions (Terborgh and Estes
832(a) Naso unicornis (b) Siganus doliatus
Lagoon
Back reef
(c) Kyphosus vaigiensis (d) Other
Figure 4. Mean bite rate of (a) Naso unicornis, (b) Siganus doliatus, (c) Kyphosus vaigiensis, and (d) other species, which includes Calotomus
carolinus, N. brevirostris, N. lituratus, S. canaliculatus, S. corallinus and S. puellus. Letters above each bar indicate homogeneous subsets
(Tukey’s tests). Large coral-grouper and reef shark treatments were not included in analyses (MANOVA) because group means were close
to zero. Note differences in scale on y-axis.
2010), yet there have been few attempts to explicitly demon- The observed herbivore foraging behaviour and
strate this in tropical marine systems (see Madin et al. 2010a decreased rates of macroalgal consumption near preda-
for exception). Using model predators to simulate predation tor models indicate that herbivorous reef fishes display a
risk, we found that large predators can have a profound influ- threat-sensitive response to the presence (or absence) of
ence on the key ecological process of herbivory on coral reefs, a potential predator (Helfman 1989). Organisms often
supporting the view that apex predators can influence organ- make tradeoffs between predator avoidance and other
isms that are linked to ecosystem functions. In the absence of fitness-related behaviours (e.g. foraging or reproduc-
predators the consumption of macroalgae by herbivores was tion; Lima and Dill 1990), and these tradeoffs can vary
high (ca 60%), but decreased with increasing predation risk. depending on the risk level posed by the predator. In the
The consumption of macroalgae was reduced by approxi- present study the consumption of macroalgae and the
mately 20% in the presence of the smallest predator (48 cm feeding rate of herbivores both significantly decreased
coral-grouper), and was almost completely suppressed in the as predation risk increased. While feeding by herbivores
presence of the two larger model predators (170 cm blacktip was almost completely suppressed in the proximity of the
reef shark and 78 cm coral-grouper), presumably due to the two larger predators, the presence of the smallest preda-
perceived risk of predation. Video footage revealed that the tor had a disproportionate effect on the smaller (⬍ 25 cm
overall feeding rate and the number of herbivorous fish spe- TL) herbivores. As shallower bodied individuals will be
cies observed feeding on the macroalgae all decreased with more vulnerable to predation than deeper bodied individ-
increased predation risk. This response to increasing preda- uals, this may explain their reluctance to feed near model
tion risk was most pronounced in smaller (⬍ 25 cm TL) predators. Together, these results support the supposition
herbivores, with feeding by these fishes declining markedly that herbivores exhibit threat-sensitive predator avoidance
in response to even the smallest predator. Given the crucial behaviour. Macroalgal removal and bite rate patterns were
importance of herbivore foraging activity in the functioning consistent among all taxa, with the exception of the drum-
of coral reef ecosystems, these results have important impli- mer, K. vaigiensis, near the small coral-grouper model;
cations for our understanding of ecosystem processes and the probably because the small coral-grouper does not repre-
effects of apex predators on coral reefs. sent a threat to this robust and deep-bodied species (i.e.
833(a) critical ecosystem process. For example, if predation risk to
herbivores alters their activity levels or spatial habitat use
this could change the rate at which their impact permeates
reef ecosystems. In addition to the changes in foraging of
macroalgal consuming (i.e. browsing) fishes in the present
study, predator biomass and/or presence has been shown
to negatively influence excursion distances of small graz-
ing fishes (i.e. fishes that feed predominately on algal turfs
and associated materials) on reefs in the central and western
Pacific (Madin et al. 2010a, 2012). Further, several studies
have suggested that the ‘grazing halos’ surrounding struc-
turally complex patch reefs or coral bommies are a result of
increased predation risk and hence reduced herbivore feed-
(b) ing with increasing distance from the reef edges (Madin et al.
2011, Downie et al. 2013). Therefore, it appears that behav-
ioural responses to predation risk may be widespread among
herbivorous fishes on coral reefs.
Whilst previous studies have highlighted the indi-
rect effects of predators on herbivore behaviour and have
linked this to variation in the distribution of algae (Madin
et al. 2010a, b, 2011, 2012), the present study is the first
to directly quantify the effects of predation risk on algal
consumption. Together, these findings demonstrate that
changes in foraging behaviour, as a result of the perceived
risk of predation, does suppress localized herbivory. These
results, however, must be interpreted with prudence. The
predator models in this study were stationary, concentrating
Figure 5. Size frequency distribution of herbivorous reef fishes the risk of predation spatially and thus potentially exaggerat-
observed feeding at (a) lagoon and (b) back reef sites. The x-axis ing predator effects on herbivore foraging behaviour at the
labels represent size-class midpoints. Values of n are the total num- site of the Sargassum assay. Indirect effects of mobile preda-
ber of fishes observed feeding. No values are present for the reef tors, such as live reef sharks, are likely to be subtler due to
shark treatment at the lagoon site because no individuals were
their constant movement. Furthermore, the presence of the
observed feeding. Large coral-grouper and reef shark treatments
were not included in analyses (Kolmogorov–Smirnov tests) because predator models in this study represent an acute (short-term)
group means were close to zero. predation risk, and while herbivory was reduced in the pres-
ence of the predator models, this localized suppression of
herbivory may not necessarily lead to long-term increases in
the gape limitation of the small coral-grouper meant that algal biomass within the ecosystem. The perceived risk posed
it did not represent a predator for all but the smallest K. by the predator models may have only led to a redistribution
vaigiensis). Notwithstanding, all herbivorous taxa and size of foraging effort of the herbivorous fishes to areas of lower
classes exhibited the greatest response in the presence of perceived risk, resulting in heterogenous foraging patterns
the large coral-grouper and reef shark models. While the and patchily distributed macroalgae (Madin et al. 2010b).
presence of static predator models in the present study are However if predator densities and the associated predation
likely to have resulted in a redistribution of foraging effort risk increases over greater spatial and temporal scales, our
to areas of lower predation risk, as opposed to an overall results may suggest that herbivore foraging effort, and sub-
reduction in foraging rates by herbivores, this behavioural sequent algal consumption, has the potential to substantially
response has potentially important implications for the decrease on a community-wide scale. While this prediction
distribution and biomass of algae on coral reefs. Changes is supported by studies in terrestrial systems that have shown
in the densities of predators over larger spatial scales may significant decreases in foraging effort as a consequence of
influence the spatial distribution of herbivore foraging, increased predation risk (see review by Verdolin 2006), it
and/or the overall rates of algal consumption. Further appears to be in contrast to the findings of a study of Carib-
investigations are therefore warranted to assess whether bean reefs (Mumby et al. 2006). Focused on the direct effects
the reaction of herbivores to different densities of mobile of predation, Mumby and others (2006) demonstrated that
apex predators, as opposed to stationary models, integrates a Caribbean marine reserve supported both higher predator
up to broad-scale community-level effects. biomass (and presumably increased predation risk), higher
High algal cover is typically viewed as a sign of degrada- densities of large-bodied parrotfishes and lower abundance
tion on coral reefs, with algae negatively affecting the fecun- of macroalgae than adjacent fished reefs. It should be noted
dity, recruitment, and growth of corals (Hughes et al. 2007, that parrotfishes are heavily targeted by fishers throughout
Mumby and Steneck 2008). Given that herbivorous fishes much of the Caribbean (Rakitin and Kramer 1996), and
play a key role in preventing the proliferation and expan- as such it is difficult to differentiate the positive effects of
sion of algae (Hughes et al. 2007, Mumby and Steneck reduced fishing mortality on parrotfishes from the nega-
2008), any changes to their behaviour may influence this tive effects of enhanced predation. Further investigation is
834warranted in order to determine whether these patterns are in the marine realm, particularly on coral reefs. Our findings
consistent across ecosystems. clearly demonstrate that apex predators can have a strong
Reefs protected from fishing are typically associated with local influence on a key ecological process on coral reefs;
higher densities of apex predators (Robbins et al. 2006, herbivory. Given that apex predators are heavily exploited
Nadon et al. 2012, Ruppert et al. 2013) and lower macroalgal throughout the world, it is imperative that we better under-
cover (Mumby et al. 2006, Sandin et al. 2008, Babcock et al. stand both the direct and indirect consequences of their
2010). As mentioned previously, protected reefs can support exploitation. Gradients in apex predator density (e.g. inside
higher abundances of both predators and herbivores, because or outside protected areas) may provide a useful tool in
the negative effects of fishing outweigh the negative effects of resolving the complexity in the linkages between apex preda-
increased predation, since herbivores become less vulnerable tors, herbivores and algal assemblages.
to predation with increasing size (Mumby et al. 2006). The
size dependent behavioural effects observed in the present
Acknowledgements – We thank E. Brown, S. Harte, M. Kramer, G.
study may therefore provide a mechanism by which herbi-
Liénart, O. Lönnstedt, L. Padina, A. Vail and J. Welsh for field
vores and apex predators can co-exist in relatively high abun- assistance, S. Brandl for statistical advice and the staff of Lizard
dances. While low macroalgae cover is typically viewed as a Island Research Station, a facility of the Australian Museum, for
direct result of the higher herbivore biomass on protected invaluable field support. Gratitude is also extended to Glenn Stew-
reefs, the potential role of predators in influencing algal art of Marine and Freshwater Fishmounts (QLD) and Robert Bot-
assemblages through behaviourally-mediated cascades should terill of New Look Concrete for construction of predator models.
not be discounted. For example, a recent study on the GBR Comments and discussions by B. Bergseth, S. Brandl, C. Goatley,
found that the presence and foraging of both grazing and O. Lönnstedt and M. Rocker greatly improved the manuscript.
Financial support was provided by the Australian Research Council
browsing fishes was negatively related to macroalgal biomass
Centre of Excellence for Coral Reef Studies and the School of
and suggested this was a response to increased predation risk Marine and Tropical Biology at James Cook University.
(Hoey and Bellwood 2011). Another study in the central
Pacific highlighted that reefs with large predator populations
limited the foraging distances of grazing fishes and led to a References
mosaic of patches of high macroalgal biomass interspersed
with closely cropped substrata (Madin et al. 2012). The sup- Babcock, R. C. et al. 2010. Decadal trends in marine reserves reveal
pressed rates of macroalgal consumption near predator mod- differential rates of change in direct and indirect effects. – Proc.
els provide confidence in our findings that predator presence Natl Acad. Sci. USA 107: 18256–18261.
suppresses localized herbivory, and invariably favours the Bascompte, J. et al. 2005. Interaction strength combinations and
accumulation of macroalgae biomass on a local scale, how- the overfishing of a marine food web. – Proc. Natl Acad. Sci.
USA 102: 5443–5447.
ever it is unclear whether predation risk will influence algal
Creel, S. and Christianson, D. 2008. Relationships between direct
biomass over larger, reefal scales. Therefore, it is likely that predation and risk effects. – Trends Ecol. Evol. 23: 194–201.
the mechanisms regulating macroalgal growth on coral reefs Dill, L. M. et al. 2003. Behaviourally mediated indirect interac-
are more complex than previously understood. tions in marine communities and their conseration implica-
The indirect effects of carnivores on plants mediated by tions. – Ecology 84: 1151–1157.
herbivores have been defined as behaviourally-mediated Downie, R. A. et al. 2013. Density of herbivorous fish and inten-
trophic cascades (Dill et al. 2003) and have been documented sity of herbivory are influenced by proximity to coral reefs.
in numerous ecosystems (Shurin et al. 2002, Preisser et al. – Mar. Ecol. Prog. Ser. 482: 217–225.
Estes, J. A. et al. 1998. Killer whale predation on sea otters linking
2005). Here we reveal that apex predators influence herbi-
oceanic and nearshore ecosystems. – Science 282: 473–476.
vore foraging behaviour, which has the potential to drasti- Estes, J. A. et al. 2011. Trophic downgrading of planet earth.
cally influence the amount of macroalgal cover on coral reefs. – Science 333: 301–306.
While our results are consistent with trophic cascade theory, Fortin, D. et al. 2005. Wolves influence elk movements:
the relatively small spatial scale and the potential realloca- behaviour shapes a trophic cascade in Yellowstone National
tion of foraging effort by herbivores calls for caution when Park. – Ecology 86: 1320–1330.
interpreting these results. In order to accurately demonstrate Frank, D. A. 2008. Evidence for top predator control of a
a trophic cascade a reduction in herbivory across the entire grazing ecosystem. – Oikos 117: 1718–1724.
Friedlander, A. M. and DeMartini, E. E. 2002. Contrasts in den-
ecosystem (or reef ) would have to be observed. Therefore,
sity, size, and biomass of reef fishes between the northwestern
while our study provides evidence for a ‘trophic interference’ and the main Hawaiian islands: the effects of fishing down
by apex predators, further studies examining these effects apex predators. – Mar. Ecol. Prog. Ser. 230: 253–264.
on a larger scale (with contrasting densities of predators) are Frid, A. et al. 2012. Interspecific variation in life history relates to
needed. Trophic cascades involve the influence of both direct antipredator decisions by marine mesopredators on temperate
and indirect effects of predators, for which there is little data reefs. – PloS ONE 7: e40083.
for the tropical marine environment, particularly for large Frisch, A. J. et al. 2012. Effects of spearfishing on reef fish popula-
predators. Our study provides the first information on the tions in a multi-use conservation area. – PLoS ONE 7:
e51938.
effects of these large predators and forms a useful basis for
Frisch, A. J. et al. 2014. Trophic ecology of large predatory reef
future studies. fishes: energy pathways, trophic level, and implications for
Evidence from terrestrial systems indicates that apex fisheries in a changing climate. – Mar. Biol. 161: 61–73.
predators exert a strong influence on other ecosystem com- Heithaus, M. R. et al. 2008. Predicting ecological consequencs
ponents (Estes et al. 2011). However, evidence for behav- of marine top predator declines. – Trends Ecol. Evol. 23:
iourally-mediated or indirect effects of apex predators is rare 202–210.
835Helfman, G. S. 1989. Threat-sensitive predator avoidance in Preisser, E. L. et al. 2005. Scared to death? the effects of
damselfish–trumpetfish interactions. – Behav. Ecol. Sociobiol. intimidation and consumption in predator–prey interactions.
24: 47–58. – Ecology 86: 501–509.
Hixon, M. A. et al. 2002. Population regulation: historical Rakitin, A. and Kramer, D. L. 1996. Effect of a marine reserve on
context and contemporary challenges of open vs closed the distribution of coral reef fishes in Barbados. – Mar. Ecol.
systems. – Ecology 83: 1490–1508. Prog. Ser. 131: 97–113.
Hoey, A. S. and Bellwood, D. R. 2009. Limited functional Rasher, D. B. et al. 2013. Consumer diversity interacts with
redundancy in a high diversity system: single species domi- prey defenses to drive ecosystem function. – Ecology 96:
nates key ecological process on coral reefs. – Ecosystems 12: 1347–1358.
1316–1328. Ripple, W. J. et al. 2001. Trophic cascades among wolves, elk
Hoey, A. S. and Bellwood, D. R. 2010. Among-habitat variation and aspen on Yellowstone National Park’s northern range.
in herbivory on Sargassum spp. on a mid-shelf reef in the – Biol. Conserv. 102: 227–234.
northern Great Barrier Reef. – Mar. Biol. 157: 189–200. Ripple, W. J. et al. 2014. Trophic cascades from wolves to grizzly
Hoey, A. S. and Bellwood, D. R. 2011. Suppression of herbivory bears in Yellowstone. – J. Anim. Ecol. 83: 223–233.
by macroalgal density: a critical feedback on coral reefs? – Ecol. Robbins, W. D. et al. 2006. Ongoing collapse of coral-reef shark
Lett. 14: 267–273. populations. – Curr. Biol. 16: 2314–2319.
Hughes, T. P. et al. 2007. Phase shifts, herbivory, and the resilience Ruppert, J. L. W. et al. 2013. Caught in the middle: combined
of coral reefs to climate change. – Curr. Biol. 17: 360–365. impacts of shark removal and coral loss on the fish communi-
Jackson, J. B. C. et al. 2001. Historical overfishing and the recent ties of coral reefs. – PLoS ONE 8: e74648.
collapse of coastal ecosystems. – Science 93: 629–638. Ruttenberg, B. I. et al. 2011. Predator-induced demographic shifts
Lima, S. L. and Dill, L. M. 1990. Behavioural decisions made in coral fish assemblages. – PLoS ONE 6: e21062.
under the risk of predation: a review and prospectus. – Can. Rypstra, A. L. and Buddle, C. M. 2012. Spider silk reduces insect
J. Zool. 68: 619–640. herbivory. – Biol. Lett. 9: 20120948.
Madin, E. M. P. et al. 2010a. Field evidence for pervasive indirect Sandin, S. A. et al. 2008. Baselines and degradation of coral reefs
effects of fishing on prey foraging behaviour. – Ecology 91: in the Northern Line Islands. – PLoS ONE 3: e1548.
3563–3571. Schmitz, O. J. et al. 2004. Trophic cascades: the primacy of trait-
Madin, E. M. P. et al. 2010b. Fishing indirectly structures mac- mediated indirect interaction. – Ecol. Lett. 7: 153–163.
roalgal assemblages by altering herbivore behaviour. – Am. Schmitz, O. J. et al. 2008. From individuals to ecosystem function:
Nat. 176: 785–801. toward an integration of evolutionary and ecosystem ecology.
Madin, E. M. P. et al. 2011. Landscape of fear visible from space. – Ecology 89: 2436–2445.
– Sci. Rep. 1 (14). Sheppard, C. R. C. et al. 2009. The biology of coral reefs. – Oxford
Madin E. M. P. et al. 2012. Do behavioural foraging responses of Univ. Press.
prey to predators function similarly in restored and pristine Shurin, J. B. et al. 2002. A cross-ecosystem comparison of the
foodwebs? – PLoS ONE 7: e32390. strength of trophic cascades. – Ecol. Lett. 5: 785–791.
McCook, L. J. 1996. Effects of herbivores and water quality on Speed, C. W. et al. 2012. Trophic ecology of reef sharks
the distribution of Sargassum on the central Great Barrier determined using stable isotopes and telemetry. – Coral Reefs
Reef: cross-shelf transplants. – Mar. Ecol. Prog. Ser. 139: 31: 357–367.
179–192. St. John, J. 1999. Ontogenetic changes in the diet of the coral
Mumby, P. J. and Steneck, R. S. 2008. Coral reef management and reef grouper Plectropomus leopardus (Serranidae): patterns in
conservation in the light of rapidly evolving ecological para- taxa, size and habitat of prey. – Mar. Ecol. Prog. Ser. 180:
digms. – Trends Ecol. Evol. 23: 555–563. 233–246.
Mumby, P. J. et al. 2006. Fishing, trophic cascades, and the process Stevens, J. D. 1984. Life-history and ecology of sharks at Aldabra
of grazing on coral reefs. – Science 311: 98–101. Atoll, Indian Ocean. – Proc. R. Soc. B 222: 79–106.
Mumby, P. J. et al. 2007. Trophic cascade facilitates coral recruit- Terborgh, J. and Estes, J. A. 2010. Trophic cascades: predators,
ment in a marine reserve. – Proc. Natl Acad. Sci. USA 104: prey, and the changing dynamics of nature. – Island Press.
8362–8367. Valeix, M. et al. 2009. Behavioural adjustments of African herbiv-
Myers, R. A. and Worm, B. 2003. Rapid worldwide depletion of ores to predation risk by lions: spatiotemporal variations in
predatory fish communities. – Nature 423: 280–283. habitat use. – Ecology 90: 23–30.
Nadon, M. et al. 2012. Re-creating missing population baselines Verdolin, J. L. 2006. Meta-analysis of foraging and predation risk
for Pacific reef sharks. – Conserv. Biol. 26: 493–503. tradeoffs in terrestrial systems. – Behav. Ecol. Sociobiol. 60:
Paine, R. T. 1966. Food web complexity and species diversity. 457–464.
– Am. Nat. 100: 65–75. Walsh, S. M. et al. 2012. Fishing top predators indirectly affects
Papastamatiou, Y. P. et al. 2011. Scales of orientation, directed condition and reproduction in a reef-fish community. – J. Fish
walks and movement path structure in sharks. – J. Anim. Ecol. Biol. 80: 519–537.
80: 864–874. Williams, I. D. and Polunin, N. V. C. 2001. Large-scale associa-
Pauly, D. et al. 1998. Fishing down marine food webs. – Science tions between macroalgal cover and grazer biomass on mid-
279: 860–863. depth reefs in the Caribbean. – Coral Reefs 19: 358–366.
Peacor, S. D. and Werner, E. E. 2001. The contribution of Zeller, D. C. 1997. Home range and activity patterns of the coral
trait-mediated indirect effects to the net effects of a predator. trout Plectopomus leopardus (Serranidae). – Mar. Ecol. Prog.
– Proc. Natl Acad. Sci. USA 98: 3904–3908. Ser. 154: 65–77.
Supplementary material (available online as Appendix
oik-01318 at ⬍www.oikosjournal.org/readers/appendix⬎).
Appendix 1
836You can also read