FIXED INCOME PRESENTATION - As of July 31, 2020 - National Bank
←
→
Page content transcription
If your browser does not render page correctly, please read the page content below
FIXED INCOME
PRESENTATION

As of July 31, 2020
CAUTION REGARDING FORWARD-LOOKING STATEMENTS

From time to time, the Bank makes written and oral forward-looking statements such as those contained in this document, in other filings with Canadian securities
regulators, and in other communications. All such statements are made in accordance with applicable securities legislation in Canada and the United States. Forward-
looking statements in this document may include, but are not limited to, statements with respect to the economy—particularly the Canadian and U.S. economies—market
changes, the Bank’s objectives, outlook and priorities for fiscal year 2020 and beyond, its strategies or future actions for achieving them, expectations for the Bank’s
financial condition, the regulatory environment in which it operates, the impacts of — and the Bank’s response to — the COVID-19 pandemic, and certain risks it faces.
These forward-looking statements are typically identified by future or conditional verbs or words such as “outlook”, “believe”, “foresee”, “forecast”, “anticipate”, “estimate”,
“project”, “expect”, “intend”, “plan”, and similar terms and expressions.
Such forward-looking statements are made for the purpose of assisting the holders of the Bank’s securities in understanding the Bank’s financial position and results of
operations as at and for the periods ended on the dates presented, as well as the Bank’s financial performance objectives, vision and strategic goals, and may not be
appropriate for other purposes.
By their very nature, these forward-looking statements require assumptions to be made and involve inherent risks and uncertainties, both general and specific.
Assumptions about the performance of the Canadian and U.S. economies in 2020, including in the context of the COVID-19 pandemic, and how that will affect the Bank’s
business are among the main factors considered in setting the Bank’s strategic priorities and objectives, including provisions for credit losses. In determining its
expectations for economic conditions, both broadly and in the financial services sector in particular, the Bank primarily considers historical economic data provided by the
governments of Canada, the United States and certain other countries in which the Bank conducts business, as well as their agencies.
There is a strong possibility that the Bank’s express or implied predictions, forecasts, projections, expectations or conclusions will not prove to be accurate, that its
assumptions may not be correct and that its financial performance objectives, vision and strategic goals will not be achieved. The Bank recommends that readers not
place undue reliance on forward-looking statements, as a number of factors, many of which are beyond the Bank’s control, including the impacts of the COVID-19
pandemic, could cause actual results to differ significantly from the expectations, estimates or intentions expressed in these statements. These factors include credit risk,
market risk, liquidity and funding risk, operational risk, regulatory compliance risk, reputation risk, strategic risk and environmental risk, all of which are described in more
detail in the Risk Management section beginning on page 58 of the Bank’s 2019 Annual Report, and more specifically, general economic environment and financial
market conditions in Canada, the United States and certain other countries in which the Bank conducts business; regulatory changes affecting the Bank’s business;
geopolitical and sociopolitical uncertainty; important changes in consumer behaviour; the housing and household indebtedness situation and real estate market in
Canada; changes in the Bank’s customers’ and counterparties’ performance and creditworthiness; changes in the accounting policies the Bank uses to report its financial
condition, including uncertainties associated with assumptions and critical accounting estimates; tax laws in the countries in which the Bank operates, primarily Canada
and the United States (including the U.S. Foreign Account Tax Compliance Act (FATCA)); changes to capital and liquidity guidelines and to the manner in which they are
to be presented and interpreted; changes to the credit ratings assigned to the Bank; potential disruption to key suppliers of goods and services to the Bank; potential
disruptions to the Bank’s information technology systems, including evolving cyberattack risk as well as identity theft and theft of personal information; and possible
impacts of catastrophic events affecting local and global economies, including natural disasters and public health emergencies such as the COVID-19 pandemic.
Statements about the expected impacts of the COVID-19 pandemic on the Bank’s business, results of operations, corporate reputation, financial position and liquidity,
and on the global economy may be inaccurate and differ, possibly materially, from what is currently expected as they depend on future developments that are highly
uncertain and cannot be predicted.
The foregoing list of risk factors is not exhaustive. Additional information about these factors can be found in the Risk Management section of the Bank’s 2019 Annual
Report and in the COVID-19 Pandemic section of the Report to Shareholders for the Third Quarter of 2020. Investors and others who rely on the Bank’s forward-looking
statements should carefully consider the above factors as well as the uncertainties they represent and the risks they entail.
Except as required by law, the Bank does not undertake to update any forward-looking statements, whether written or oral, that may be made from time to time, by it or
on its behalf.

                                                                                                                               Q3|20 Fixed Income Presentation 2
OVERVIEW NATIONAL BANK OF CANADA
HIGHLIGHTS - YTD 2020

PTPP(1)                           Total PCL                            ▪ Well positioned in a challenging environment:
$2.9B                             $736 MM                                - Strong balance sheet
+12% YoY                          +185% YoY
                                                                         - Defensive positioning
                                                                         - Diversified earnings stream

                                                                       ▪ Good business performance with PTPP up 12% YoY
Net Income                        EPS
                                                                         - Positive operating leverage
$1.6B                             $4.37
-7% YoY                           -6% YoY

                                                                       ▪ Proactive and prudent provisioning
                                                                         - Total reserves: $1.3B
                                                                         - Performing ACL coverage: 2.8x
CET1                              ROE
11.4%                             15.4%
                                                                       ▪ Industry-leading ROE

Note: 9M-2019 comparative figures to compute YoY growth are excluding specified items. Please refer to page 13 of the Bank’s Third Quarter 2020 Report to Shareholders
for additional information.
(1) Pre-tax pre-provision earnings, presented on a taxable equivalent basis (TEB), excluding specified items.                                                            4
OVERVIEW – YTD 2020 RESULTS
Total Bank Summary Results
($MM, TEB)
9M 20 9M 19 YoY ▪ Revenue up by 9%, led by Financial Markets,
Revenues 6,143 5,658 9% Wealth Management and USSF&I
Non-Interest Expenses 3,273 3,094 6%
▪ Pre-tax pre-provision earnings up 12% YoY
Pre-Tax / Pre-Provisions 2,870 2,564 12%
PCL 736 258 185% ▪ Prudent provisioning with PCL up 185% YoY
Net Income 1,601 1,716 (7%)
Diluted EPS $4.37 $4.67 (6%)
Key Metrics 9M 20 9M 19 YoY
Avg Loans & BAs - Total 158,329 147,547 7%
Avg Deposits - Total 203,831 181,093 13%
Efficiency Ratio 53.3% 54.7% -140 bps
Return on Equity 15.4% 17.9%
CET1 Ratio 11.4% 11.7%
(1) Excluding Specified Items. All Specified Items are accounted for under the “Other” heading of segment results (the Gain on disposal of Fiera Capital shares, the
Gain on disposal of head office building and the Remeasurement of NSIA at fair value are reflected in “Non-interest income”; the Impairment losses on premises
and equipment and on intangible assets, the Provisions for onerous contracts and Severance pay are reflected in “Non-interest expenses”). Please refer to page
13 of National Bank's Q3-2020 Report to shareholders for additional information.
5SEGMENT HIGHLIGHTS - YTD 2020
P&C Banking ▪ Revenue growth impacted by lower interest-rate environment and lower client activity due
PTPP: $1.2B to COVID-19
Flat YoY ▪ Strong growth in mortgage and deposit volumes
▪ Value of retail loans under deferral down 60% since Q2
Wealth Management ▪ Strong transaction volumes, partly offset by lower interest rates
PTPP: $555 MM ▪ AUA and AUM returned to their pre COVID levels
+12% YoY
Financial Markets ▪ Strong 9-month revenues up 24% from 2019
PTPP: $934 MM ▪ Solid growth in Global Markets
+32% YoY ▪ Supporting our clients through the crisis while maintaining a sound risk profile
USSF&I ▪ Resilient businesses, well positioned to perform through the crisis
PTPP: $349 MM ▪ ABA: Net income grew 62% YoY, capitalizing on its strong brand in uncertain times
+12% YoY ▪ Credigy: Revenue growth and credit losses impacted by COVID-19
6PERSONAL AND COMMERCIAL BANKING
P&C Summary Results
($MM)
▪ Revenues flat YoY, mainly driven by:
9M 20 9M 19 YoY - Lower margin
Revenues 2,580 2,576 0% - Lower client activity
Personal 1,607 1,618 (1%) - Offset by good mortgage and deposit
volumes
Commercial 973 958 2%
Non-Interest Expenses 1,384 1,382 0% ▪ Commercial lending impacted by COVID
Pre-Tax / Pre-Provisions 1,196 1,194 0%
▪ Continued disciplined cost management
PCL 450 178 153%
Net Income 549 746 (26%)
Key Metrics 9M 20 9M 19 YoY
P&C Net Interest Margin(1)
Avg Loans & BAs - Personal 78,381 75,614 4%
Avg Loans & BAs - Commercial 37,733 35,938 5%
2.23% 2.19%
Avg Loans & BAs - Total 116,114 111,552 4%
Avg Deposits - Personal 33,113 30,389 9%
Avg Deposits - Commercial 32,644 31,177 5%
9M 19 9M 20
Avg Deposits - Total 65,757 61,566 7%
NIM (%) 2.19% 2.23% (0.04%)
Efficiency Ratio (%) 53.6% 53.6% -
PCL Ratio 0.52% 0.21% 0.31%
(1) NIM is on Earning Assets. 7WEALTH MANAGEMENT
Wealth Management Summary Results
($MM)
▪ Transaction volumes remained elevated
9M 20 9M 19 YoY ▪ Fee-based are up 7% YoY due to strong
Revenues 1,389 1,297 7% net sales
Fee-Based 806 750 7% ▪ AUA and AUM back to pre-COVID levels
Transaction & Others 248 203 22%
▪ Lower net interest income as strong
Net Interest Income 335 344 (3%)
deposits were more than offset by lower
Non-Interest Expenses 834 802 4% interest rates
Pre-Tax / Pre-Provisions 555 495 12%
PCL 6 -
Net Income 404 365 11% Assets Under Management
($MM)
Key Metrics ($B) 9M 20 9M 19 YoY 86,014 86,742
78,740 80,760 82,548
Avg Loans & BAs 4.7 4.9 (3%)
Avg Deposits 38,776 39,177
34.1 32.5 5% 36,353 36,819 36,324
Asset Under Administration 500.3 479.1 4%
Asset Under Management 86.7 78.7 10%
42,387 43,941 47,238 46,224 47,565
Efficiency Ratio (%) 60.0% 61.8% -180 bps
Q3 19 Q4 19 Q1 20 Q2 20 Q3 20
Individual Mutual funds
8FINANCIAL MARKETS
Financial Markets Summary Results
($MM, TEB) ▪ Solid growth in Global Markets, mainly due
to higher revenues in fixed income
9M 20 9M 19 YoY - Higher volumes in fixed income secured
Revenues 1,559 1,256 24% funding
Global Markets 987 733 35%
- Lower volatility and trading volumes in equity
C&IB 572 523 9% ▪ C&IB up 9% YoY driven by DCM and ECM,
Non-Interest Expenses 625 547 14% and strong loan and deposit volumes
Pre-Tax / Pre-Provisions 934 709 32% - Partly offset by lower M&A activity
PCL 212 20 960%
Net Income 531 505 5%
Other Metrics 9M 20 9M 19 YoY Global Markets Revenues
(1)
Avg Loans & BAs 18,847 16,448 15% ($MM)
Efficiency Ratio (%) 40.1% 43.6% -350 bps 987
733
558
424
316
207
102 113
9M 19 9M 20
Commodity and Foreign exchange Fixed income Equity
(1) Corporate Banking only. 9US SPECIALTY FINANCE & INTERNATIONAL
USSF&I Summary Results ABA Bank
($MM)
▪ Strong growth with earnings up 62% YoY,
9M 20 9M 19 YoY loans up 50% and deposits up 47%
Revenues 588 523 12%
Credigy
▪ Solid credit position: well-diversified
284 307 (7%)
portfolio, 98% secured
ABA 299 213 40%
- Loan deferrals representing 17% of portfolio
Other 5 3 67%
(interest paid on 92% of deferrals; LTV of
Non-Interest Expenses 239 211 13% 36% on deferrals)
Credigy 106 114 (7%)
ABA 130 95 37% ▪ Expecting strong earnings growth for F2020
Other 3 2 50%
PCL 63 60 5%
Credigy
Credigy 47 50 (6%) ▪ Lower earnings due to COVID-19 impact
ABA 16 10 60%
Net Income 246 201 22% ▪ Expecting ~ flat earnings in F2020
Credigy 103 113 (9%)
▪ Maintaining disciplined growth strategy
ABA 141 87 62%
going forward
Other 2 1 100%
Other Metrics 9M 20 9M 19 YoY
Avg Loans - Credigy 7,309 6,180 18%
Avg Loans - ABA 3,868 2,583 50%
Avg Deposits - ABA 4,742 3,220 47%
Efficiency Ratio (%) 40.6% 40.3% +30 bps
ABA Bank - Branches 77 68 13%
10PROVISIONS FOR CREDIT LOSSES
PCL Q3 2020 Total PCL $143M (35bps); 70% lower QoQ
($MM)
$81 $143
▪ Conditions benefited from significant support
programs and re-opening of economy
PCL on Performing Loans
Impaired
Non-Retail
$74
▪ Key drivers: revision of macroeconomic
$88 factors/scenario weights; portfolio growth,
migration, and increase in management
overlay
$62
▪ Retail: $18M, reflects prudent provisioning
Non-Retail POCI ($7) Retail despite temporarily low delinquencies
$27
$48
▪ Non-retail: $27M, reflecting macro update,
Retail
$18
portfolio growth and migration
USSF&I USSF&I ▪ USSF&I: $17M, additional provisions to reflect
$17 $21
economic uncertainties
Performing Impaired & POCI (1) Total PCL
PCL on Impaired Loans
Personal 17 29 46
Commercial 13 20 33 ▪ Material reduction in both Retail and Non-
FM 14 27 41 Retail Impaired PCLs QoQ reflecting
WM 1 1 2 government programs, moratoriums and
Total PCL x-USSF&I 45 77 122 improved credit conditions
USSF&I(1) 17 4 21
▪ Strong performance in USSF&I reflecting
Total PCL ($MM) 62 81 143
Total PCL (bps) 15 20 35
portfolio quality
(1) Impaired PCL includes ($7M) from Purchased or Originated Credit Impaired (POCI), representing better collection performance than expected. 11ALLOWANCE FOR CREDIT LOSSES
ACL Q3 20 Total Allowances:
($MM)
▪ Continued to prudently build allowances in
the third quarter
70% increase in allowances since Q1 20
▪ Since Q1 2020, Total Allowances for Credit
Losses increased from $769M to $1.3B
$1,305
($43)
▪ 109% increase in allowances for non-retail
$1,211 $143 portfolios since Q1 and a 35% increase in
Non-
Performing
allowances for retail portfolios reflecting our
$342 product and geographic mix
Non-Retail
Non-Retail $720
$656 (1 Performing Allowances:
$769 )
▪ Performing ACLs increased by 76% since
Non-Retail Q1 2020, reaching $1,036M
$345
Performing ▪ Represents 2.8 times coverage
$1,036
Retail Retail of LTM impaired PCLs
$490 $509
Retail
$378 Non-Performing Allowances:
USSF&I USSF&I ▪ Increased to $342M or 43% of
USSF&I $104 $134 $149
POCI ($58) POCI ($69) POCI ($73) POCI ($73)
GIL vs 39% of GIL last quarter
ACL Q1 20 ACL Q2 20 PCL Q3 20 NCO Q3 20 ACL Q3ACL
20 Q3 20(1)(2)Q3 20
ACL
(1) Performing ACL includes allowances on drawn ($840M), undrawn ($159M) and other assets ($37M).
(2) Total ACL in Q3 20 includes -$6M of FX variation. 12PRUDENT PROVISIONING IN UNCERTAIN ECONOMIC ENVIRONMENT
Strong Performing ACL Coverage Total ACL Consistent with Portfolio Positioning
Performing ACL / LTM PCL on Impaired Loans Total ACL / Total Loans excl. FVTPL
Q3 20 Q2 20 Q3 19 Q3 20 Q2 20 Q3 19
Total Bank 2.8x 2.8x 1.8x Total Bank 0.84% 0.77% 0.53%
Total Bank x-USSF&I 2.9x 3.0x 2.3x Retail x-USSF&I 0.60% 0.59% 0.44%
Non-Retail x-USSF&I 1.23% 1.07% 0.64%
Consistent Reserve Build Total Allowances Cover 4.7X NCOs
Total PCL – Net Charge-Off ($MM) Total ACL / LTM Net Charge-Off
YTD F2020 F2019 F2018 Q3 20 Q2 20 Q3 19
Total Bank $555 $48 $5 Total Bank 4.7x 4.1x 2.5x
Total Bank x-USSF&I $528 $61 $28 Total Bank x-USSF&I 5.5x 4.9x 3.4x
Note: Performing ACL includes allowances on drawn ($840M), undrawn ($159M) and other assets ($37M). 13GROSS IMPAIRED LOANS AND FORMATIONS
Gross Impaired Loans(1) (GIL)
($MM)
48 49 ▪ Gross impaired loan ratio increased 1bp to
44 44 43 $794
49bps ($794M)
$780
$674 $684 $677 ▪ Net formations declined by $108M from last
quarter reflecting:
$462 $444 - Net repayments in Commercial
-
$384 $387 $374
Lower formations in FM
$264 $273 $300
$254 $261
$36 $36 $39 $45 $50
Q3 19 Q4 19 Q1 20 Q2 20 Q3 20
USSF&I Retail Non-Retail GIL ratio (bps)
Net Formations(2) by Business Segment
($MM)
Q3 20 Q2 20 Q1 20 Q4 19 Q3 19
Personal 56 53 48 54 34
Commercial (15) 64 (21) 47 31
Financial Markets 5 37 30 (4) 36
Wealth Management 6 1 − 1 (1)
Credigy 11 16 17 20 23
ABA Bank 6 6 4 0 2
Total GIL Net Formations 69 177 78 118 125
(1) Under IFRS 9, impaired loans are all loans classified in stage 3 of the expected credit loss model. Those loans do not take
into account purchased or originated credit-impaired loans.
(2) Formations include new accounts, disbursements, principal repayments, and exchange rate fluctuation; net of write-offs. 14STRONG CAPITAL POSITION
CET1 Ratio
▪ Strong CET1 ratio of 11.4%(2)
▪ Strong pre-tax pre-provision earnings
supported by favorable business mix
0.45%
(0.11%) 0.03% ▪ Total PCL of $143M (11 bps after-tax)
(0.25%)
(0.08%)
▪ RWA growth absorbed 25 bps
11.39% 11.43%
(see Appendix 6)
Q2 20 Net Income Total PCL RWA ECL Other Q3 20
Ex. PCL (After-tax) Transitional
(Net of Div.) Add-Back(1)
(1) Transitional measure applicable to expected credit loss provisioning.
(2) Ratio takes into account the transitional relief measures granted by OSFI in the context of COVID-19 (11.2% excluding these measures). For additional details
regarding relief measures introduced by the regulatory authorities, please refer to pages 7-8 of the Bank’s Q3-2020 Report to Shareholders. 15STRONG CAPITAL AND LIQUIDITY POSITIONS
Capital and Capital Ratios
($MM)
▪ Our capital levels remain strong
Q3 20 Q2 20 Q1 20
Capital
▪ Total capital ratio of 15.1%
CET1 $10,840 $10,568 $10,046
▪ Strong liquidity coverage ratio of 161%
Tier 1 $13,290 $13,368 $12,846
Total $14,336 $14,370 $13,755
Capital ratios
CET1 11.4% 11.4% 11.7%
Tier 1 14.0% 14.4% 14.9%
Total 15.1% 15.5% 16.0%
Leverage 4.3% 4.4% 4.0%
Liquidity Coverage Ratio 161% 149% 144%
16LIQUIDITY AND FUNDING
FUNDING STRATEGY

The main objective of the funding strategy is to support the Bank's organic growth while also enabling it
to survive potentially severe and prolonged crises and to meet its regulatory obligations and financial
targets.

The funding framework consists of 3 pillars:

1.   Pursue a diversified deposit strategy to fund core banking activities through stable deposits
     coming from the networks of each of the Bank’s major business segments;

2.   Maintain a sound liquidity risk management through centralized expertise and management of
     liquidity metrics within predefined risk appetite;

3.   Maintain active access to various markets to ensure diversification of institutional funding in
     terms of source, geographic location, currency, instrument and maturity, whether secured or
     unsecured.

The funding strategy is implemented in accordance with the overall objectives of strengthening the
Bank's franchise among market participants and consolidating its excellent reputation.

                                                                          Q3|20 Fixed Income Presentation 18
DIVERSIFIED DEPOSIT STRATEGY
Pursue a diversified deposit strategy to fund core banking activities through stable deposits coming
from the networks of each of the Bank’s major business segments
NBC TOTAL DEPOSITS ($BN) NBC PERSONAL DEPOSITS ($BN)
$169
$66
$159 $64
$152
$61
1Y CAGR = 18% $60 1Y CAGR = 12%
$145
$143 $59
Q3 2019 Q4 2019 Q1 2020 Q2 2020 Q3 2020 Q3 2019 Q4 2019 Q1 2020 Q2 2020 Q3 2020
NBC BUSINESS & GOVERNMENT DEPOSITS ($BN)
$103
▪ Resulting from the steady execution of the
Bank’s successful deposit strategy, Total
$95
Deposits increased to $169B as of Q3 2020.
$91
1Y CAGR = 22%
$85
$84
Q3 2019 Q4 2019 Q1 2020 Q2 2020 Q3 2020
Q3|20 Fixed Income Presentation 19SOUND LIQUIDITY RISK MANAGEMENT
Maintain a sound liquidity risk management through centralized expertise and management of liquidity metrics within
predefined risk appetite, with 4 main principles: Efficient Risk & Reward Balance through a Risk Appetite Framework,
Decision-making processes based on clear and complete understanding of liquidity risk and liquidity risk contributors,
support to NBC’s credit ratings and liquidity position maintained above regulatory minimum requirements.
Unsecured Wholesale Funding Liquidity Coverage Ratio
vs. Unencumbered Liquid Assets
Liquidity Approach to Wholesale Funding Regulatory Liquidity
▪ High-quality liquidity portfolio more than offsets ▪ Ongoing well-positioned LCR
reliance on Unsecured Wholesale Funding ▪ The Bank currently monitors the NSFR and will be
▪ Continued disciplined approach to Unsecured compliant in time for the implementation (as of the
Wholesale Funding effective date of January 1, 2021)
Additional information on the Bank’s liquidity position can be found in pp. 35-43 of the Q3 2020 Quarterly Report.
Q3|20 Fixed Income Presentation 20MATURITY PROFILE
Maintain active access to various markets to ensure diversification of institutional funding in terms of
source, geographic location, currency, instrument and maturity, whether secured or unsecured.
Term Funding (C$ millions) Term Funding
Canada (selected issuances)
Currency Principal (in millions) Tenor Product Coupon Maturity
CAD 1,000 5Y Senior Unsecured (BID) 2.545% 24-Jul
CAD 750 5Y Senior Unsecured (BID) 2.580% 25-Feb
CAD 750 6NC5 Senior Unsecured (BID) 1.573% 26-Aug
Foreign (selected issuances)
Currency Principal (in millions) Tenor Product Coupon Maturity
EUR 750 5Y Covered Bonds 0.375% 24-Jan
USD 750 3Y Sustainable Senior Unsecured (BID) 2.150% 22-Oct
USD 1,000 3Y Senior Unsecured (BID) 2.100% 23-Feb
USD 500 3NC2 Senior Unsecured (BID) 0.900% 23-Aug
Note: The Term Funding Ladder includes all negotiable products with terms at issuance greater than or equal to 1 year, excluding Bank of Canada facilities usage. For details on the
Bank of Canada facilities, please refer to Q320 Report to Shareholders (pp. 9 and 49). Excludes capital issuances.
Q3|20 Fixed Income Presentation 21DIVERSIFIED FUNDING PLATFORMS
Maintain active access to various markets to ensure diversification of institutional funding in terms of
source, geographic location, currency, instrument and maturity, whether secured or unsecured
Unsecured Wholesale Funding Platforms Securitization and Covered Bond Programs
▪ Benchmark C$ Senior Unsecured ▪ Canadian Mortgage Bonds
▪ US$ Senior Unsecured MTN programs ▪ Canadian Credit Card Trust II
(Structured Notes and Senior Bail-in) ▪ Legislative Global Covered Bond Program
▪ Euro MTN program (EMTN)
▪ US$ Commercial Paper programs and Yankee CDs
▪ C$ MTN shelf
In addition to benchmark deals, we also have capacity to:
✓ act on Reverse enquiries
✓ execute Private Placements and Club Deals,
✓ tailor Sustainability Bonds (ESG) and Structured Notes (incl. Step-ups, Callables, CMS)
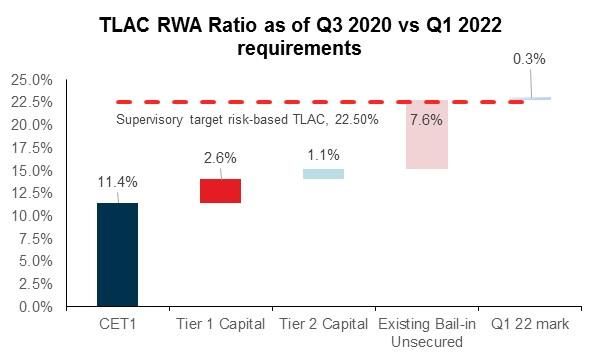
Q3|20 Fixed Income Presentation 22TLAC RATIOS
The Bank does not anticipate any challenges in fully meeting the minimum TLAC requirements by November 1, 2021.
▪ Q320 NBC TLAC RWA Ratio = 22.8%
▪ Q320 NBC TLAC Leverage Ratio = 7%
▪ NBC will comply with both TLAC
regulatory requirements by Q1 2022
Starting Q1 2022, all Canadian D-SIBs will be required to maintain a TLAC risk-weighted ratio of at least 21.5%. In
addition, all D-SIBs will be expected to hold buffers above the minimum TLAC Ratio, including the Domestic Stability
Buffer (“DSB”, adjusted to 1.00% of total RWA on March 13, 2020, to be effective April 30, 2020). Inclusive of the DSB
as currently set, the D-SIBs’ supervisory target risk-based TLAC Ratio would stand at 22.5% when into effect on
Nov. 1, 2021. Starting Q1 2022, all D-SIBs will also be required to maintain a TLAC leverage ratio of at least 6.75%.
Q3|20 Fixed Income Presentation 23NBC SUSTAINABILITY BOND FRAMEWORK AND REPORTING
February 2018, NBC published its Sustainability Bond Framework and obtained Second Party Opinion from VigeoEiris:
https://www.nbc.ca/content/dam/bnc/a-propos-de-nous/relations-investisseurs/fonds-propres-et-dette/nbc-sustainability-bond-framework.pdf
February 2020, NBC published its Sustainability Bond Report and obtained Independent Opinion from VigeoEiris:
https://www.nbc.ca/content/dam/bnc/a-propos-de-nous/relations-investisseurs/fonds-propres-et-dette/2020/na-sustainability-bond-report-2019.pdf
https://www.nbc.ca/content/dam/bnc/a-propos-de-nous/relations-investisseurs/fonds-propres-et-dette/2020/na-vigeo-eiris-post-issuance-review-2020.pdf
In line with the ICMA Green Bond Principles and Social Bond Principles, NBC’s Sustainability Bonds will be allocated to financing of
projects and organizations that credibly contribute to the environmental objectives or seek to achieve positive socioeconomic
outcomes for target populations. Therefore, these are likely to contribute to United Nations’ Sustainable Development Goals (listed
below), by having a focus on:
Renewable Energy / Sustainable Buildings / Low-Carbon Transportation /
Affordable Housing / Access to Basic and Essential Services
In FY2019, NBC completed four sustainability bond issuances, including the first international issuance of USD Sustainability Bonds
by a North American bank, as well as Sustainable Structured Bonds issued via tailored private placements:
NACN USD 750,000,000 3Y 2.15% Senior Notes Due October 2022
NACN EUR 40,000,000 12y CMS1010 Senior Notes Due February 2031
NACN EUR 50,000,000 15y CMS1010 Senior Notes Due April 2034
NACN EUR 40,000,000 15y Steepener Senior Notes Due May 2034
Q3|20 Fixed Income Presentation 24NBC SUSTAINABILITY BOND FRAMEWORK
For the purpose of issuing Sustainability Bonds, NBC has developed its framework, which addresses the four core
components of the ICMA Sustainability Bond Guidelines and its recommendations on the use of external reviews and
impact reporting:
1. Use of proceeds
2. Project selection and evaluation process
3. Management of proceeds
4. Reporting
As per the ICMA Sustainability Bond Guidelines: “Sustainability Bonds are bonds where the proceeds will be
exclusively applied to finance or re-finance a combination of both Green and Social Projects.
Sustainability Bonds are aligned with the four core components of both the GBP [Green Bond Principles or “GBP”] and
the SBP [Social Bond Principles or “SBP”] with the former being especially relevant to underlying Green Projects and the
latter to underlying Social Projects.
It is understood that certain Social Projects may also have environmental co-benefits, and that certain Green Projects
may have social co-benefits. The classification of a use of proceeds bond as a Green Bond, Social Bond, or
Sustainability Bond should be determined by the issuer based on its primary objectives for the underlying projects.”
https://www.icmagroup.org/green-social-and-sustainability-bonds/sustainability-bond-guidelines-sbg/
Q3|20 Fixed Income Presentation 25APPENDICES
APPENDIX 1 │ TOTAL LOAN PORTFOLIO OVERVIEW

Loan Distribution by Borrower Category
($B)
                                                                                                        ▪ Secured lending accounts for 94%
                                                                  As at                                   of Retail loans
                                                         July 31, 2020          % of Total
Retail                                                                                                  ▪ Indirect auto loans represent 1.8% of total
Secured - Mortgage & HELOC                                        78.8               48%                  loans ($2.9B)
                   (1)
Secured - Other                                                     9.0                5%
Unsecured                                                           4.3                3%               ▪ Limited exposure to unsecured retail and
Credit Cards                                                        1.8                1%                 cards (4% of total loans)
Total Retail                                                      93.9               57%
                                                                                                        ▪ Non-Retail portfolio is well-diversified
Non-Retail                                                                                                across industries
Real Estate and Construction RE                                   13.3                 8%
Agriculture                                                         6.6                4%
Manufacturing                                                       6.1                4%
Other Services                                                      5.3                3%
Oil & Gas and Pipeline                                              5.2                3%
       Oil & Gas                                                    2.8                2%
       Pipeline & Other                                             2.4                1%

Retail & Wholesale trade                                            5.1                3%
Finance and Insurance                                               4.8                3%
Other(2)                                                          21.7               14%
Total Non-Retail                                                  68.1               42%

Purchased or Originated Credit-Impaired                             0.9                1%
Total Gross Loans and Acceptances                                162.9              100%

(1) Includes indirect lending and other lending secured by assets other than real estate.
(2) Includes Mining, Utilities, Transportation, Professional Services, Construction, Communication, Government and Education & Health Care.          27
APPENDIX 2 │ REGIONAL DISTRIBUTION OF CANADIAN LOANS
Portfolios Prudently Positioned to Face the Crisis
As at July 31, 2020
Within the Canadian loan portfolio:
Maritimes(2)
▪ Limited exposure to unsecured consumer
Oil and loans (3.7%)
Quebec Ontario Regions(1) BC/MB Territories Total
Retail ▪ Modest exposure to unsecured consumer
Secured
27.4% 13.3% 4.8% 3.6% 1.1% 50.2% loans outside Quebec (0.8%)
Mortgage & HELOC
Secured
2.9% 1.3% 0.5% 0.6% 0.3% 5.6% ▪ RESL exposure predominantly in Quebec
Other
Unsecured
2.9% 0.4% 0.1% 0.1% 0.2% 3.7%
and Credit Cards
Total Retail 33.2% 15.0% 5.4% 4.3% 1.6% 59.5%
Non-Retail
Commercial 17.5% 4.0% 2.0% 1.4% 0.6% 25.5%
Corporate Banking
4.7% 5.0% 3.3% 1.4% 0.6% 15.0%
and Other(3)
Total Non-Retail 22.2% 9.0% 5.3% 2.8% 1.2% 40.5%
Total 55.4% 24.0% 10.7% 7.1% 2.8% 100.0%
(1) Oil regions include Alberta, Saskatchewan and Newfoundland
(2) Maritimes include New Brunswick, Nova Scotia and P.E.I.
(3) Includes Corporate, Other FM and Government portfolios 28APPENDIX 3 │ RETAIL MORTGAGE AND HELOC PORTFOLIO
Canadian Distribution by Province
As at July 31, 2020
▪ Insured mortgages account for 38% of the
55%
Uninsured & HELOC
total RESL portfolio (70% in Alberta)
Insured
▪ Distribution across product and geography
remained stable
68% ▪ Uninsured mortgages and HELOC in GTA
26% and GVA represent 10% and 2%
of the total portfolio and have an average
LTV(1) of 50% and 51% respectively for
62%
each segment
32% 8%
6% 5%
38% 30%
56%
Canadian Distribution by Mortgage Type
70% 39%
44% 61%
QC ON AB BC Other Provinces
59% 51% 70% 52% 56%
Average LTV - Uninsured and HELOC(1)
HELOC
$23.6B(2) Insured
Canadian Uninsured and HELOC Portfolio / 32% $28.4B
$73.7B / 38%
HELOC Uninsured
(1)
Average LTV 56% 59%
Average Credit Bureau Score 794 775 Uninsured
90+ Days Past Due (bps) 16 34 $21.7B / 30%
(1) LTV are based on authorized limit for HELOCs and outstanding amount for Uninsured Mortgages.
They are updated using Teranet-National Bank sub-indices by area and property type.
(2) Of which $14.5B are amortizing HELOC. 29APPENDIX 4 │ LIMITED EXPOSURE TO COVID-19 MOST IMPACTED INDUSTRIES
▪ Limited exposure to COVID-19 most impacted industries (down 9% QoQ)
Gross Loans % of
($MM) Book
Non-Food / Non-Pharmacy Retailers
Essential Services Retailers $379 0.2% n Decrease of 51% in drawings (QoQ)
Other Retailers $554 0.3% n Decrease of 17% QoQ / Diversified customer base / Less than 25% in apparel
Car Dealerships $580 0.4% n Decrease of 9% QoQ / Typically secured by real estate / Strong recovery in car sales
Hospitality and Entertainment
Entertainment $511 0.3% n 54% in professional sports teams which are 74% IG
Hotels $338 0.2% n Remained disciplined in sector / Secured portfolio with conservative LTV and branded assets
Restaurants $244 0.1% n Maintained a low risk appetite for the sector throughout the years / 52% IG
Air Transportation and Aeronautics
Aviation $642 0.4% n 55% IG / 1/3 in airports and airport operations
Aeronautics $83 0.1% n mainly IG (91%) and all Secured (99%)
Auto and Auto Parts Manufacturing $236 0.1% n Record sales in July
Retail Real Estate n Constrained portfolio growth in recent years
Diversified REITs $709 0.4% n Primarily IG REITs with good liquidity and continued access to capital markets
Commercial Retail $1,964 1.2% n More than 90% with street access / about 50% of leases with essential services tenants
30APPENDIX 5 │ OIL & GAS AND PIPELINES SECTOR
O&G Producers and Services Exposure
Gross Loans in $MM and % of Total Loans
▪ O&G producers and services exposure
$3,956 significantly reduced
- 29% reduction in outstanding loans: down
from $4B in Q1/15 to $2.8B in Q3/20
$2,798
- Reduction as a % of total loans: down from
3.7% in Q1/15 to 1.8% in Q3/20
3.7% - Canadian focused strategy, minimal direct
1.8% US exposure
▪ Overall O&G and Pipeline portfolio
refocused from mid-cap to large cap
Q1 15 Q3 20 - Producers share declined from 82% in
Q1/15 to 49% in Q3/20
O&G and Pipeline sector
- Following the bi-annual revision, 56% of
Total Gross Loans of $5.2B the portfolio is Investment Grade
4% (as of Q3/20)
5% 11% IG: 100%
9% 4% IG: 49%
▪ Very modest indirect exposure to
36% IG: 69% unsecured retail loans in the oil regions
(~0.1% of total loans)
82%
49% IG: 38%
Q1 15 Q3 20
Producers Midstream Services Refinery & Integrated
31APPENDIX 6 │ RWA GROWTH
Risk-Weighted Assets
($MM)
▪ RWA growth primarily driven by
Credit Risk
▪ Limited impact from rating migration: 2 bps
$603 - 8 bps of CET1 from non-retail portfolio
$1,287 $169
$94,814 - Partly offset by 6 bps improvement in retail
(low delinquency due to government
programs)
$92,755
Q2 20 Credit Risk Operational Market Risk Q3 20
Risk
32APPENDIX 7 │ OVERVIEW OF SELECTED BANK OF CANADA MEASURES
In the context of the COVID-19 pandemic, the Bank of Canada has taken various measures since March 2020, including:
▪ Added 6- and 12-month Term Repo operations (bi-weekly operations, March 12, 2020), later enhanced to permit up to
24-month funding (April 15, 2020);
▪ Introduced a Bankers’ Acceptance Purchase Facility (BAPF), started the week of March 23, secondary market purchases of
1-month BAs issued and guaranteed by any Canadian bank and of sufficiently high quality (minimum short-term credit rating of
R-1 (low)), subsequently expanded with longer-tenor BAs (March 13, 2020);
▪ Launch of the Standing Term Liquidity Facility (STLF), first announced in November 2019. Under the STLF, the Bank could
provide loans to eligible financial institutions in need of temporary liquidity support and where the Bank has no concerns about
their financial soundness. The STLF complements the Bank’s current tools for the provision of liquidity and will strengthen the
Bank’s role as lender of last resort. The facility launched on March 30, 2020.
▪ Announced intention to broaden eligible collateral for its Term Repo facility to include the full range of collateral eligible
under the Standing Liquidity Facility, to expand beyond Government of Canada securities and those explicitly guaranteed by
the crown, this list includes provincial bonds, municipal bonds, government-sponsored pension bonds, commercial paper,
ABS, BAs, corporates and US treasury bills/bonds, among others. However, each of these securities must meet minimum
acceptable quality requirements and each security type is subject to rating thresholds. Scope subsequently broadened a few
times, to include also own-name covered bonds, term ABS, ABCP and BDNs (On June 3, BDNs have been removed).
▪ Provincial Bond Purchase Program (PBPP), capacity to buy up to $50B in CAD-denominated provincial and provincial
agency debt (maturities of ten years and under). The program launched in May, may continue for 12 months.
▪ Corporate Bond Purchase Program (CBPP) which will allow the Bank to buy up to $10B investment-grade (BBB and above),
CAD-denominated corporate bonds with maturities of up to 5 years.
▪ Other measures include frequency of operations, adjustments to scope of securities eligible to the various facilities and
programs, CMBs buyback program, LVTS participants being granted more flexibility as to assets to be pledged (for example:
non-mortgage loan portfolios).
▪ Additional coordinated measures from other Canadian regulators such as CMHC (for example: IMPP and Commercial
rents support) and OSFI (for example: DSB lowered).
For greater details (reference updated as of August 21, 2020):
https://www.nbc.ca/content/dam/bnc/en/rates-and-analysis/economic-analysis/policy-update.pdf
Q3|20 Fixed Income Presentation 33APPENDIX 8 │ NBC CREDIT RATINGS
Long-Term Non
Covered Counterparty
Short-term Bail-inable Senior Debt(2) Outlook
Credit Rating Bonds risk(3)
Senior Debt(1)
Agency
S&P A-1 A BBB+ Stable ---- ----
Moody’s P-1 Aa3 A3 Stable Aaa Aa3
DBRS R-1 (mid) AA (low) A (high) Stable AAA ----
Fitch F1+ AA- A+ Negative AAA AA-
▪ Strong short-term ratings
▪ Solid Deposit / Non Bail-inable Senior Debt ratings
▪ “A” Long-Term Senior Bail-in Debt ratings, Indices composite A* and A-**
(1) Includes Senior Debt issued prior to Sept. 23, 2018 and Senior Debt issued on or after Sept. 23, 2018 which is excluded from the Bank Recapitalization (Bail-in) Regime.
(2) Subject to conversion under the Bank Recapitalization (Bail-in) Regime.
(3) Moody's terminology is Counterparty Risk Rating (CRR) while Fitch's terminology is Derivative Counterparty Rating (DCR).
* FTSE Russell (as of April 30, 2019)
** Bloomberg Index (as of April 30, 2019)
Q3|20 Fixed Income Presentation 34APPENDIX 9 │ LEGISLATIVE COVERED BOND PROGRAMME
Programme size ▪ CAD$ 15,000,000,000
Outstanding benchmark covered bonds ▪ €1B 1.5% 03/21; €1B 0.5% 01/22; £250M 3M£LIBOR+37 09/21;
€750M 0.0% 09/23; €750M 0.750% 03/25; €750M 0.250% 07/23;
€750M 0.375% 01/24 and USD1,000M 2.05% 06/22
Ratings ▪ Aaa / AAA / AAA by Moody’s, Fitch and DBRS
Asset percentage minimum and maximum ▪ 80-93%
Currency ▪ Any
Guarantor ▪ NBC Covered Bond (Legislative) Guarantor L.P.
Listing ▪ London, U.K.
Law ▪ Canadian Legislative Framework (National Housing Act)
LTV ▪ 80% Maximum
Collateral pool eligibility ▪ Canadian uninsured residential mortgage loans
Tenor ▪ Any Allowed
Coupon ▪ Fixed / Float
Bullet Type ▪ Soft Bullet
Q3|20 Fixed Income Presentation 35APPENDIX 10 │ OTHER
Other Segment Summary Results
($MM, TEB)
▪ Incremental expenses of $44M YTD for
health and safety measures in the
Adjusted Results 9M 20 9M 19
context of the pandemic
Revenues 27 6
Non-Interest Expenses 191 152 ▪ Decrease in variable compensation
Pre-Tax / Pre-Provisions
provision
(164) (146)
PCL 5 -
Pre-Tax Income (169) (146)
Net Income (129) (101)
Reported Results
Specified Items (10) 2
Net Income (139) (99)
(1) Results for the third quarter of 2019 exclude a $79 million gain related to the disposal of Fiera Capital shares, a $50 million gain on disposal of head office building,
a Remeasurement of NSIA at fair value for ($33) million and charges of $112 related to Impairment losses, Provisions for onerous contracts and Severance pay.
Please refer to page 13 of the Bank’s Third Quarter 2020 Report to Shareholders for additional information. 36DISCLAIMER
This Document has been prepared solely for informational purposes and is not an offer to buy or sell or a solicitation of an offer to buy or sell any security or
instrument or to participate in any trading strategy. Any such offer would be made only after a prospective participant had completed its own independent
investigation of the securities, instruments or transactions and received all information it required to make its own investment decision, including a review of
the final prospectus and the final terms describing such security or instrument, which would contain material information not contained herein and to which
prospective participants are referred.
THE COVERED BONDS WILL NOT BE SUITABLE FOR ALL INVESTORS. IF ISSUED, THE COVERED BONDS WILL BE SUITABLE ONLY FOR SOPHISTICATED
INVESTORS WHO ARE WILLING TO TAKE CONSIDERABLE RISKS AND CAN ABSORB A PARTIAL OR COMPLETE LOSS ON THEIR INVESTMENT. THE
PRESENTATION HAS BEEN PREPARED FOR PRESENTATION TO MARKET PROFESSIONALS AND INSTITUTIONAL INVESTORS ONLY. PROSPECTIVE
INVESTORS WILL BE REQUIRED TO ACKNOWLEDGE OR WILL HAVE BEEN DEEMED TO HAVE ACKNOWLEDGED THAT THEY UNDERSTAND THE RISKS AND
POTENTIAL CONSEQUENCES ASSOCIATED WITH THE PURCHASE OF THE COVERED BONDS AND THAT THEY HAVE MADE SUCH INDEPENDENT
APPRAISAL OF THE NATIONAL BANK OF CANADA (THE "BANK") AND THE ASSETS COMPRISING THE COLLATERAL POOL AND THEIR RESPECTIVE
ECONOMIC CIRCUMSTANCES AS THEY THINK APPROPRIATE, AND HAVE CONSULTED WITH THEIR OWN LEGAL, INVESTMENT, ACCOUNTING AND TAX
ADVISORS TO THE EXTENT THEY BELIEVE IS APPROPRIATE TO ASSIST THEM IN UNDERSTANDING AND EVALUATING THE RISKS INVOLVED AND THE
CONSEQUENCES OF PURCHASING THE COVERED BONDS. THE INFORMATION CONTAINED HEREIN SHALL BE SUPERSEDED AND AMENDED IN FULL BY
THE PROSPECTUS FOR THE COVERED BOND PROGRAM AND THE FINAL TERMS FOR THE RELEVANT ISSUANCE WHICH SHALL BE ISSUED BY THE
NATIONAL BANK OF CANADA.
IF ISSUED, THE COVERED BONDS WILL NOT BE REGISTERED UNDER THE U.S. SECURITIES ACT OF 1933, AS AMENDED (THE "SECURITIES ACT") OR THE
SECURITIES LAWS OF ANY STATE IN THE UNITED STATES AND WILL BE SUBJECT TO U.S. TAX REQUIREMENTS. THE COVERED BONDS MAY BE OFFERED,
SOLD OR DELIVERED ONLY TO (i) QUALIFIED INSTITUTIONAL BUYERS (“QIBs”) IN RELIANCE ON THE EXEMPTION FROM REGISTRATION PROVIDED BY
RULE 144A UNDER THE SECURITIES ACT (“RULE 144A”) OR (ii) INSTITUTIONAL “ACCREDITED INVESTORS” (AS DEFINED IN RULE 501(A)(1), (2), (3) OR (7)
UNDER THE SECURITIES ACT) (“INSTITUTIONAL ACCREDITED INVESTORS”); OR (iii) OUTSIDE THE UNITED STATES TO NON-U.S. PERSONS IN RELIANCE
UPON REGULATION S UNDER THE SECURITIES ACT (“REGULATION S”).
These materials have been prepared solely for informational purposes and do not constitute an offer to buy or sell or a solicitation of an offer to buy or sell any security or
instrument or to participate in any trading strategy. No representation or warranty can be given with respect to the accuracy or completeness of the information herein, or
that any future offer of securities, instruments or transactions will conform to the terms hereof. Please refer to the important information and qualifications on the last
page hereof when reviewing this information.
No representation or warranty can be given with respect to the accuracy or completeness of the information herein, or that any future offer of securities, instruments or
transactions will conform to the terms hereof. The National Bank of Canada (the “Bank”) and National Bank Financial Inc. (“NBF”) and each of their respective affiliates
disclaim any and all liability relating to this information. The Bank, NBF, their respective affiliates and others associated with them may have positions in, and may effect
transactions in, securities and instruments mentioned herein and may also perform or seek to perform investment banking services for the issuers of such securities and
instruments or similar securities and instruments.
The information herein may contain general, summary discussions of certain tax, regulatory, accounting and/or legal issues relevant to the Covered Bonds. Any such
discussion is necessarily generic and may not be applicable to, or complete for, any particular recipient’s specific facts and circumstances. The Bank is not offering and
does not purport to offer tax, regulatory, accounting or legal advice and this information should not be relied upon as such. Prior to making any proposed investment in
the Covered Bonds, recipients should determine, in consultation with their own legal, tax, regulatory and accounting advisors, the economic risks and merits, as well as
the legal, tax, regulatory and accounting characteristics and consequences, of the investment.
Q3|20 Fixed Income Presentation 37QUESTIONS? Mr. Jean Dagenais, Senior Vice-President, Finance Jean.Dagenais@nbc.ca Mr. Jean-Sébastien Gagné, Treasurer JeanSebastien.Gagne@nbc.ca Additional information can be found via these web links: https://www.nbc.ca/investor-relations.html https://www.nbc.ca/capital-debt-information.html
You can also read