Global Threat Alerts in Secure Network Analytics - Cisco
←
→
Page content transcription
If your browser does not render page correctly, please read the page content below

Global Threat Alerts in Secure Network Analytics
First Published: 2021-07-01
Last Modified: 2021-09-30

Americas Headquarters
Cisco Systems, Inc.
170 West Tasman Drive
San Jose, CA 95134-1706
USA
http://www.cisco.com
Tel: 408 526-4000
     800 553-NETS (6387)
Fax: 408 527-0883
© 2021 Cisco Systems, Inc. All rights reserved.
CONTENTS

CHAPTER 1   Dashboard         1

                 Overview 1
                 Investigate Alerts 3
                 Investigate Threats 5
                 Asset Groups 7

CHAPTER 2   Glossary     9

                 alert 9
                 security event 10
                 threat catalog 10
                 threat detection 10

CHAPTER 3   Settings     13

                 Settings 13

CHAPTER 4   STIX/TAXII Service 15
                 What's New 15
                 Overview 15
                 Poll Service 16
                       Poll Request 17
                       Poll Response 18
                       Poll Fulfillment 23
                 Common Queries 24
                       Users Affected by Confirmed Threats 24
                       Users Affected by Confirmed Threats Within a Timeframe 24
                       Users Affected by High Risk and High Confidence Incidents 25

                                                                Global Threat Alerts in Secure Network Analytics
                                                                                                                   iii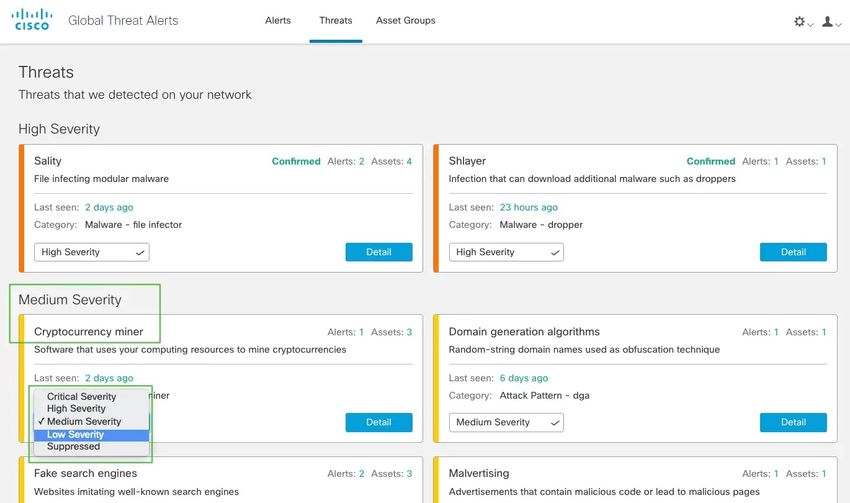
Contents

                            Users Affected by Campaign 25
                            Command and Control Servers 25
                         Integration with Cisco ISE 25

CHAPTER 5         Proxy Device Uploads            27

                         Proxy Device Uploads 27

PART I            Release Notes        31

CHAPTER 6         August 2021         33

                         Classic Interface Decommissioned 33
                         Improved Handling of Scans and Blocked Communications 33

CHAPTER 7         June 2021      35

                         New REST API for Automation Support     35

                         Secure Endpoint Integration Update 35
                         STIX/TAXII API Update 37

CHAPTER 8         May 2021       39

                         Support for SecureX Ribbon 39
                         Updated Daily Report Email 42

CHAPTER 9         April 2021      45

                         New DGA 2.0 Classifier 45
                         New MITRE References in Alert Descriptions 46

CHAPTER 10        March 2021          49

                         New Typosquatting Classifier 49
                         New TLS Pattern Classifier 50

CHAPTER 11        Before March 2021          53

                         Before March 2021             53

              Global Threat Alerts in Secure Network Analytics
         iv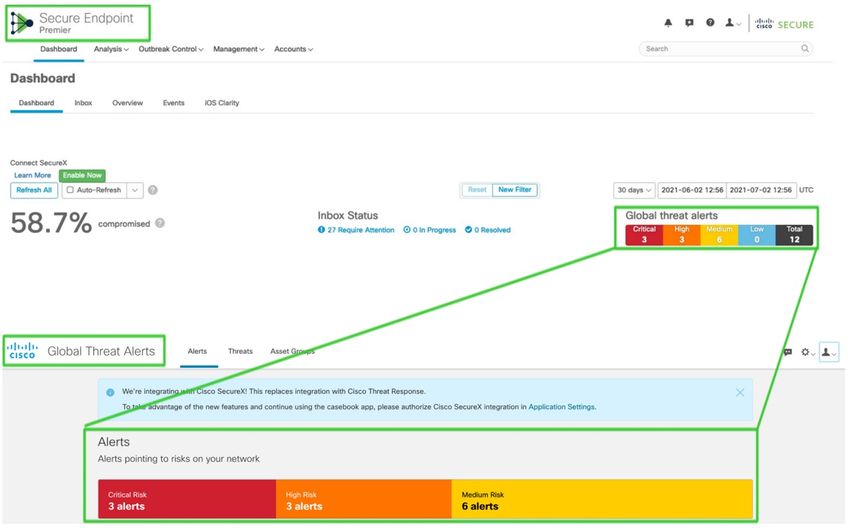
CHAPTER                 1
           Dashboard
           The global threat alerts (formerly Cognitive Intelligence) feature helps you quickly detect and respond to
           sophisticated, clandestine attacks that are either already under way or attempting to establish a presence within
           your network. The feature automatically investigates suspicious or malicious web-based traffic. It identifies
           both confirmed and potential threats, allowing you to quickly remediate the infection and reduce the scope
           and damage of an attack, whether it’s a known threat campaign that has spread across multiple organizations,
           or a unique threat that you’ve never seen before.
           As a cloud-based service, global threat alerts analyzes the information generated by your existing web security
           solutions, without the need for any additional hardware or software. It zeroes in on malicious activity that has
           bypassed security controls.
           Using machine learning and a statistical modeling of networks, global threat alerts creates a baseline of normal
           activity and identifies anomalous traffic occurring within your network. It analyzes device behavior and web
           traffic to pinpoint command-and-control communications and data exfiltration.
           Learning from what it sees, global threat alerts adapts to provide continuous breach identification, reducing
           the risk of repeat attacks or continued infection. It presents its information through an intuitive, web-based
           portal that's integrated with several Cisco Security products, so that you can assess the severity and scope of
           intrusions, understand the mission of the threat and how it works, and take immediate action.
              • Overview, on page 1
              • Investigate Alerts, on page 3
              • Investigate Threats, on page 5
              • Asset Groups, on page 7

Overview
           Our analytics engine applies machine learning to incoming data streams and projects the detections into a
           3-dimensional space:

                                                                Global Threat Alerts in Secure Network Analytics
                                                                                                                     1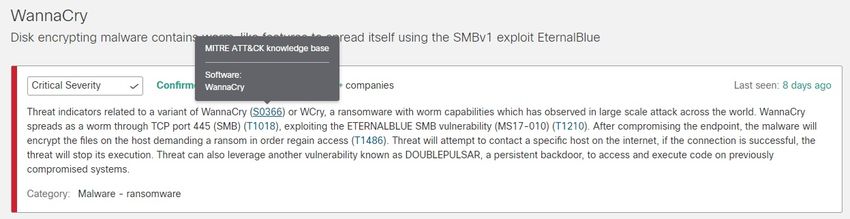
Dashboard
     Overview

Figure 1:

                        • Threat-severity dimension. How severe is the threat? Confirmed threats and their severity. To better
                          align with your organization’s risk profile towards individual threat types, you have the option to adjust
                          the pre-defined severity of individual threats.
                        • Asset-value dimension. How valuable is the asset? If all the devices connected to the network are not
                          equally important, you have the option to adjust the business value of individual asset groups to prioritize
                          detections for your more important devices.
                        • Confidence dimension. How confident are we in the verdict? Confidence in the verdicts that our
                          algorithms are making about individual threats observed in the customer environment. In some instances,
                          we observe enough behavioral indicators that our verdict is almost certain. In some other instances,
                          despite the similar symptoms, the actual evidence might be sketchy. Therefore, the margin for error
                          increases.

                    Our fusion algorithm uses these detections to identify clusters of similar threats and projections to calculate
                    their risk levels. Our web portal then presents these as security alerts in a list prioritized by their risk levels.
                    Each alert points to threats on your network and represents a natural unit-of-work for investigation and
                    subsequent remediation.

                Global Threat Alerts in Secure Network Analytics
            2
Dashboard
Investigate Alerts
Investigate Alerts
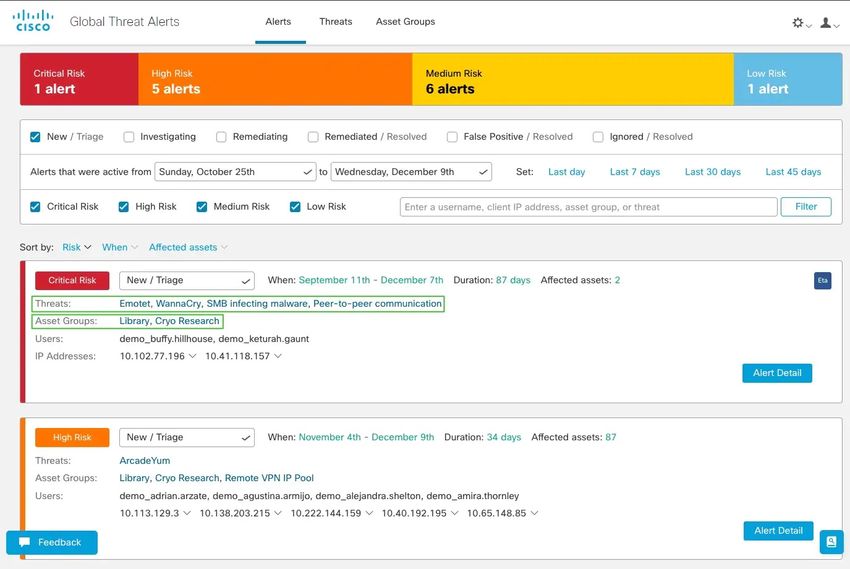
Step 1 Click the Alerts tab to view all the active alerts on your network. Each alert is displayed on its own card.
a) Each alert card aggregates one or more threats that are concurrently affecting a set of assets on your network with
similar business values.
Figure 2:
• Threats. Different threats that are occurring together.
• Asset Groups. These threats are occurring on endpoints that belong to these asset groups with similar business
values.
b) The risk level is based on the severity level of the threat and business value of the asset groups. A higher risk level
indicates a higher risk of the threat severely impacting the valuable asset(s) on your network.
Step 2 Alert cards with higher risk are ordered closer to the top of the list. Prioritize your analysis by responding to the alerts
based on their risk level and investigating higher risk alerts first.
• Critical
Global Threat Alerts in Secure Network Analytics
3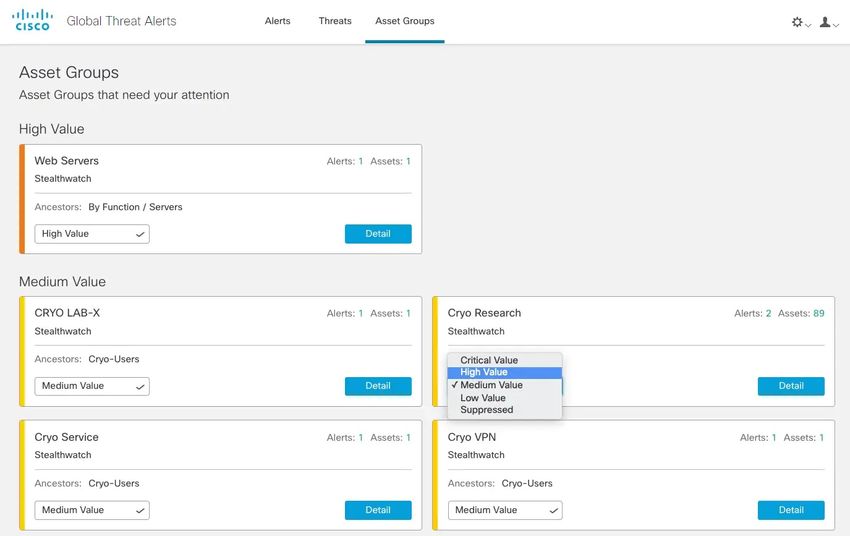
Dashboard
     Investigate Alerts

                   • High
                   • Medium
                   • Low

                Note        Alert cards can dynamically change, such as when new threats are added to the group or the asset group business
                            value or threat severity are changed.

Step 3          You have the option to Filter which alerts are shown by choosing state, age, risk level, username, IP address, asset group,
                and/or threat. You also have the option to Sort by age, risk level, or number of affected assets.
Figure 3:

Step 4          Start your investigation of an alert by changing its state from New/Triage.
                Note        When its state is no longer New/Triage, the alert card remains unchanged and stable, to ease investigation.

Step 5          Click on Alert Detail for additional content about each detected threat and affected asset.
                   • Security events that were triggered and led to identification of this threat
                   • IP addresses and domains that the assets communicated with
                   • Which specific IoCs were indicative of that malicious behavior
                   • Confidence level that the machine learning algorithm has assigned to this detection

Step 6          Selecting one of the specific events for one user pivots you to the security events view, where you can see a detailed
                context of the specific events that triggered the malicious detection.

                          Global Threat Alerts in Secure Network Analytics
            4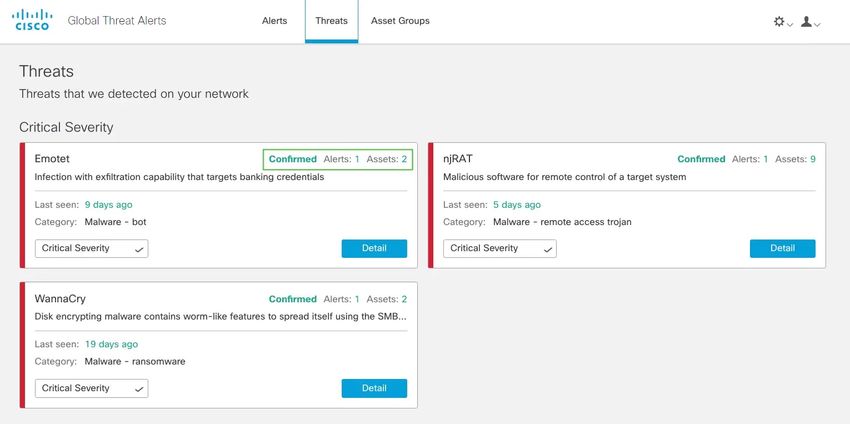
Dashboard
                                                                                                                          Investigate Threats

Figure 4:

               Tip       Click the drop-down arrow and copy this IoC to your clipboard, to ease your next steps in investigation.

Investigate Threats
Step 1         Click the Threats tab to see a list of threats reported on your network and prioritized by severity. Each card represents
               a different threat that will be grouped in alerts.

                                                                               Global Threat Alerts in Secure Network Analytics
                                                                                                                                          5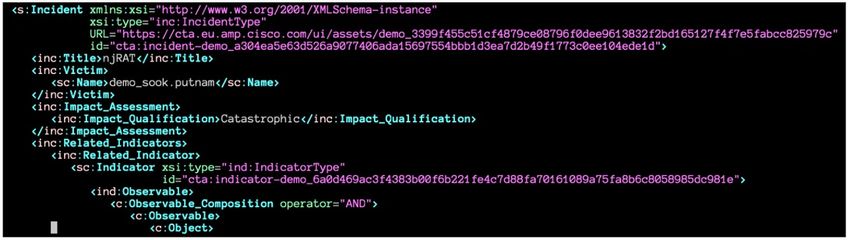
Dashboard
     Investigate Threats

Figure 5:

Step 2          A specific type of threat might be involved in several alerts. There's a counter on the card indicating the number of alerts
                this specific type of threat is involved with and the number of assets affected by this threat.
Step 3          A threat card labeled Confirmed means that we have high confidence in the threat and its severity; we have seen at least
                one indicator of compromise (IoC) in the traffic that is related to a specific malicious behavior. This IoC has been confirmed
                by a team of threat researchers. The description in the Confirmed threat elaborates on the implications of this alert to
                your business.
Step 4          You have the option to adjust the threat's severity, according to your network-specific conditions and business needs.
                   • Consequently, all New/Triage alerts that contain this type of threat will have their risk levels recalculated, weighting
                     the new severity with asset value and confidence level.
                   • Then, any change in risk level affects the relative ordering of New/Triage alerts.
                   • For example, if you lower the threat's severity, the associated alert(s) risk level will be lowered, and the associated
                     alert card(s) will appear lower in the list on the Alerts tab.
                   • Click the drop-down list to adjust the threat's severity:

                        Global Threat Alerts in Secure Network Analytics
            6
Dashboard
Asset Groups
Figure 6:
Note All other alerts that are no longer in the New/Triage state are not affected by a change in threat severity; they
remain unchanged and stable, to ease investigation.
Asset Groups
Step 1 Click the Assets tab to see all the asset groups that have their traffic sent to global threat alerts. Each card represents a
group of assets for which global threat alerts is reporting at least one alert.
Step 2 Determine how important or valuable the asset group is to your organization. You have the option to adjust the asset
group's business value.
• Consequently, all New/Triage alerts that affect this asset group will have their risk levels recalculated, weighting
the new asset value with severity and confidence level.
• Then, any change in risk level affects the relative ordering of New/Triage alerts.
• For example, if you increase the asset group's business value, the associated alert(s) risk level will be increased, and
the associated alert card(s) will appear higher in the list on the Alerts tab.
• Click the drop-down list to adjust the business value of the asset group:
Global Threat Alerts in Secure Network Analytics
7Dashboard
Asset Groups
Figure 7:
Note All other alerts that are no longer in the New/Triage state are not affected by a change in threat severity; they
remain unchanged and stable, to ease investigation.
Step 3 You have the option to suppress asset groups by changing the business value to Suppressed. On the Suppressed Networks
card, you can click Open Application Settings to define specific IPv4 assets or entire subnets that you want to suppress.
Note Threats that are detected on an asset that belongs to a suppressed group will no longer raise alerts. Suppressed
asset groups continue to be visible in the Assets tab.
Figure 8: Suppressed Networks
Global Threat Alerts in Secure Network Analytics
8CHAPTER 2
Glossary
• alert, on page 9
• security event, on page 10
• threat catalog, on page 10
• threat detection, on page 10
alert
An alert is a notification that prompts you to investigate a threat detection.
In global threat alerts, an alert focuses on one or more threat detections. Those threat detections occur on one
or more assets. Our fusion algorithm uses these detections to identify clusters of similar threats and their
projections to calculate risk levels. Our web portal then presents them as security alerts in a list prioritized by
their risk levels. Each alert points to threats on your network and represents a natural unit-of-work for
investigation and subsequent remediation.
Global Threat Alerts in Secure Network Analytics
9Glossary
security event
Figure 9:
security event
A security event is a significant security event that might indicate malicious or suspicious behavior. The threat
detection engine processes the security events. Security events that are significant for the detection of suspicious
or malicious behavior are called convicting. The security events which are observed for an affected asset in
time of threat detection are called contextual. Each security event contains a description of why it is significant.
This description is called the security annotation.
threat catalog
The threat catalog organizes possible threat detections and provides their ordering into three basic categories:
Malware, Tool, and Attack Pattern. It also includes mapping to MITRE, if it is present.
threat detection
A threat detection is the detection of suspicious or malicious behavior affecting an asset. In the global threat
alerts threat catalog, it recognizes multiple types of threat detections.
Global Threat Alerts in Secure Network Analytics
10Glossary
threat detection
The threat detection engine works with a wide range of sources such as security events. It correlates them to
reveal unusual patterns and trends that potentially reveal or analytically confirm the presence of a threat with
a certain confidence level.
Global Threat Alerts in Secure Network Analytics
11Glossary
threat detection
Global Threat Alerts in Secure Network Analytics
12CHAPTER 3
Settings
• Settings, on page 13
Settings
To configure your global settings, click the gear icon drop-down menu in the upper-right corner of the page:
• Email Notifications—Enter email addresses to be sent a summary of new and updated threats every 24
hours.
• CTA STIX/TAXII API—Use the CTA STIX/TAXII API to pull information on incidents detected by
global threat alerts down to your SIEM client for further analysis, incident response, and data archival.
See STIX/TAXII Service.
• Device Accounts—Upload telemetry data in log files from one or more source proxy devices to the
global threat alerts system for analysis. To access this service, the External Telemetry feature must be
enabled and provisioned for your company. If you do not have the External Telemetry feature, contact
your Cisco Security account team. See Proxy Device Uploads.
• Application Settings
• Suppressed Networks—Hide alerts by listing which IPv4 addresses and network ranges to ignore.
This is useful for filtering and suppressing unnecessary alerts such as alerts from a guest network
or other, less critical pieces of your network. Enter IPv4 addresses for hosts, subnets, or IPv4 address
ranges (for example: 10.100.10.1, 10.100.10.0/24, 10.100.10.1-10.100.10.254) that you want hidden
from the list of incidents.
• Cisco SecureX Integration—Enable integration with SecureX by choosing the region of your
SecureX account, clicking Authorize, and signing in to your SecureX account.
• Release Notes—Summarizes feature updates, changes, and fixes (shown later in this guide).
Global Threat Alerts in Secure Network Analytics
13Settings
Settings
Global Threat Alerts in Secure Network Analytics
14CHAPTER 4
STIX/TAXII Service
• What's New, on page 15
• Overview, on page 15
• Poll Service, on page 16
• Common Queries, on page 24
• Integration with Cisco ISE, on page 25
What's New
In the second half of 2022, global threat alerts will stop supporting the STIX/TAXII API.
We recommend that you use our new REST API instead (New REST API for Automation Support ):
• To access it, follow the documentation at https://api.cta.eu.amp.cisco.com.
• To read more about it, see global threat alerts REST API is now released!
• If you need assistance, please contact us at cognitive-api-support@cisco.com.
Overview
Global threat alerts allows you to pull information on detected incidents down to your client for further
correlation analysis and archival. You can even automate the whole data-collection process by streaming all
your alerts to a third-party SIEM in your network. The service supports MITRE's Trusted Automated eXchange
of Indicator Information (TAXII) standard for integration with your Security Information and Event
Management (SIEM) system. The TAXII standard specifies transport mechanisms used to share cyber threat
information between systems.
For more information on TAXII, see:
TAXII MITRE org
TAXII project GitHub
The information in each incident is represented using the Structured Threat Information eXpression (STIX)
language format. STIX is a structured language used to describe cyber threat information so it can be shared,
stored, and analyzed in a consistent manner. The STIX format allows global threat alerts to represent its breach
detection findings in a hierarchical format. The TAXII service uses a subset of the STIX language to describe
the incidents that global threat alerts has detected. Currently, the supported objects include:
Global Threat Alerts in Secure Network Analytics
15STIX/TAXII Service
Poll Service
• Campaign—Confirmed threat category, if available
• Incident—Anomalous activity
• TTP—Tactics, Techniques, and Procedures
• Observable—Web requests
• Indicator—Pattern identifying observable conditions
For more information on STIX, see:
https://stix.mitre.org/
Poll Service
The poll service uses standardized TAXII transport mechanisms to send incident information from global
threat alerts to clients that support the TAXII standard. To pull incident information, the TAXII client sends
a poll request to the TAXII poll service. HTTP basic authentication is used to restrict access for authorized
users only. The TAXII poll service then responds by sending incident information from global threat alerts
to the TAXII client. HTTPS protocol is used to secure all data transfers.
Your SIEM or other security work-flow system must natively support STIX/TAXII. Configure your third-party
TAXII client to periodically poll the TAXII poll service.
• To obtain your account information, request STIX/TAXII service.
1. Click the global settings gear icon in the upper-right corner.
2. Click CTA STIX/TAXII API.
3. Click the Add account button.
4. Enter a name to identify your account, and then click the Add account button.
• After the provisioning process is completed, your account information is displayed. Copy this account
information to a secure location before closing the window.
Note For security reasons, the secret password is displayed only once. If you lose the
secret password, you must revoke the existing secret password and generate a
new secret password.
• Copy your unique attributes into your third-party TAXII client:
• pollEndpoint or feed service
URL=https://taxii.cloudsec.sco.cisco.com/skym-taxii-ws/PollService
• username
• password
• collection name or feed name
Global Threat Alerts in Secure Network Analytics
16STIX/TAXII Service
Poll Request
Note In August 2018, Cognitive Intelligence (formerly Cognitive Threat Analytics or CTA) started its migration
to a new location in Amazon Web Services, which resulted in new IP addresses and an additional URL to
access and use the service. To maintain access to the service, it may be necessary to update your outbound
firewall rules. After the switchover in November 2018, you will no longer be able to succesfully send data to
the old data ingest service IP address. Specific details on the required changes and other important information
can be found in the Field Notice.
Note We do not provide technical support for configuring third-party products or SIEM devices. In the event of an
issue, consult the vendor-specific support team.
Alternatively, you may download and use an example TAXII client from Cisco. If your SIEM or other security
system does not natively support STIX/TAXII, Cisco provides a lightweight Java TAXII Log Adapter that
you can deploy to a Linux or Windows VM environment next to your SIEM. Click the link provided to view
setup instructions. The adapter uses the TAXII API to perform regular polling of any new intelligence and
delivers data in STIX messages. The STIX messages are then transformed by the adapter into other formats
accepted by common SIEM systems.
To support the stability, performance, and availability of the poll service:
• Only one poll request from any single TAXII client is allowed within every 10 minutes. Otherwise, a
status message indicating this error is returned.
• Each poll request may retrieve incident information spanning up to three days.
• Incident information is stored for retrieval for up to 30 days.
Poll Request
The following is an example of a poll request from your TAXII client to the TAXII poll service.
Method is POST.
HTTP Request headers:
x-taxii-content-type: urn:taxii.mitre.org:message:xml:1.1
x-taxii-protocol: urn:taxii.mitre.org:protocol:http:1.1
x-taxii-services: urn:taxii.mitre.org:services:1.1
x-taxii-accept: urn:taxii.mitre.org:message:xml:1.1
content-type: application/xml
accept: application/xml
authorization: Basic ...
Request body:
2015-01-16T00:00:00+00:00
2015-01-17T00:00:00+00:00
Global Threat Alerts in Secure Network Analytics
17STIX/TAXII Service
Poll Response
FULL
Supported Request Parameters Description
Poll_Request
message_id A randomly generated string for each request, according
to the TAXII specification. Regenerate a unique string for
every request.
collection_name Name of collection to extract or pull from the global threat
alerts service. This attribute will be provided to you by
Cisco after the provisioning process is completed.
Exclusive_Begin_Timestamp Adjust this value according to your timeframe.
Inclusive_End_Timestamp Adjust this value according to your timeframe.
Poll_Parameters
allow_asynch Always set this attribute to false.
Note The maximum supported difference between Exclusive_Begin_Timestamp and Inclusive_End_Timestamp
is three days. In case the difference is more, the returned result is limited to the last three days before
Inclusive_End_Timestamp.
Poll Response
The following is an example of a poll response from the TAXII poll service to the TAXII client.
HTTP Response headers:
x-taxii-content-type: urn:taxii.mitre.org:message:xml:1.1
x-taxii-protocol: urn:taxii.mitre.org:protocol:http:1.1
x-taxii-services: urn:taxii.mitre.org:services:1.1
Response body:STIX/TAXII Service
Poll Response
result_id=" " result_part_number="1"
in_response_to="generatedMessageID" message_id="responseMessageID">
2015-01-17T15:11:00.648Z
2015-01-20T15:11:00.649Z
Incident
Cognitive Threat Analytics
Cisco
Advanced Malware Protection
Cisco
malware|using automatically generated domain (DGA)
JohnDoe
1421623882432
1810
0
622
907
195.22.26.231
33.196.39.11
JohnDoe
-580
unclassified
Global Threat Alerts in Secure Network Analytics
19STIX/TAXII Service
Poll Response
1421623896635
1942
0
361
582
195.22.26.231
33.196.39.11
JohnDoe
-580
unclassified
communication to automatically generated domain
(DGA)
Log Review
Remedy
Eradication
2016-08-15T17:02:02.616Z
JohnDoe
33.196.39.11
Low
Global Threat Alerts in Secure Network Analytics
20STIX/TAXII Service
Poll Response
Note In Poll_Reponse, if there are no more threat items, the two attributes of more and result_id are not present.
When more=true is present, you can request the next pages of the response by using a Poll_Fulfillment.
Supported Response Objects Description of Field
Poll_Response
collection_name Name of collection to extract or pull from the global
threat alerts service. This attribute will be provided
to you by Cisco after the provisioning process is
completed.
result_id Copy this value to the poll fulfillment request.
Exclusive_Begin_Timestamp Exclusive beginning of the time range covered by this
poll response. Absence of this field indicates that the
poll response covers the earliest time for this TAXII
data feed.
Inclusive_End_Timestamp Inclusive end of the time range covered by this poll
response.
Content_Block Returned content.
Content_Binding
Content
STIX_Package Information about the STIX language.
STIX_Header Information about this package of STIX content.
Incidents One or more incidents.
Incident Information about a single incident.
Title Title describing this incident.
Victim Information about the victim of this incident.
Related_Indicators Identifies indicators related to this incident.
Related_Indicator Identifies a single indicator related to this incident.
Indicator Indicator made up of a pattern that identifies certain
observable conditions as well as contextual
information about the pattern's meaning, how and
when it should be acted upon, etc.
Global Threat Alerts in Secure Network Analytics
21STIX/TAXII Service
Poll Response
Supported Response Objects Description of Field
Observable Relevant observable for this indicator.
Observable_Composition Enables specifying higher-order composite
observables by composing logical combinations of
other observables.
Observable Represents a single observable.
Object Identifying characteristics of a specific object (e.g.
file, registry key, process)
Properties Properties that were enumerated as a result of the
action on the object.
Custom_Properties Enables specifying a set of custom object properties
that may not be defined in existing Properties
schemas.
Property A single property that was enumerated as a result of
the action on the object.
Indicated_TTP Specifies the relevant Tactics, Techniques, and
Procedures (TTP) indicated by this indicator.
Discovery_Method Information about the method and/or tool used to
discover the code.
COA_Requested Recommended course of actions for this incident.
Confidence Information about the level of confidence held in the
characterization of this incident.
Information_Source Information about the source of this incident.
Tools
Tool Which tool, CTA or AMP, detected this incident.
In case of an error, an error message is returned. For example:
An error occurred during request processing.
Global Threat Alerts in Secure Network Analytics
22STIX/TAXII Service
Poll Fulfillment
TAXII status_type Description of Error
User is not authenticated, HTTP response status code of 404
DENIED User is not authorized, HTTP response status code of 401
BAD_MESSAGE Invalid request message, refer to Message parameter
FAILURE Unspecified error, refer to Message parameter
Poll Fulfillment
The following is an example of a poll fulfillment request from your TAXII client to the TAXII poll service.
Method is POST.
HTTP Request headers:
x-taxii-content-type: urn:taxii.mitre.org:message:xml:1.1
x-taxii-protocol: urn:taxii.mitre.org:protocol:http:1.1
x-taxii-services: urn:taxii.mitre.org:services:1.1
x-taxii-accept: urn:taxii.mitre.org:message:xml:1.1
content-type: application/xml
accept: application/xml
authorization: Basic ...
Request body:
2015-01-16T00:00:00+00:00
2015-01-17T00:00:00+00:00
FULL
Supported Request Parameters Description
Poll_Request
message_id A randomly generated string for each request, according
to the TAXII specification. Regenerate a unique string for
every request.
collection_name Name of collection to extract or pull from the global threat
alerts service. This attribute will be provided to you by
Cisco after the provisioning process is completed.
result_id Paste this value from the poll response.
Global Threat Alerts in Secure Network Analytics
23STIX/TAXII Service
Common Queries
Supported Request Parameters Description
result_part_number Increment this value by 1 from the value in the poll
response.
Exclusive_Begin_Timestamp Adjust this value according to your timeframe.
Inclusive_End_Timestamp Adjust this value according to your timeframe.
Poll_Parameters
allow_asynch Always set this attribute to false.
Note The maximum supported difference between Exclusive_Begin_Timestamp and Inclusive_End_Timestamp
is three days. In case the difference is more, the returned result is limited to the last three days before
Inclusive_End_Timestamp.
Common Queries
This section describes some common queries used in the Cisco STIX/TAXII API to help prioritize findings
for further investigation. The syntax used in the example queries is based on SPLUNK integration and is
symbolic. The particular fields and values may differ depending on your local integration, but the meaning
of the queries is broadly applicable across SIEM systems and integrations.
Tip If you are collecting other data in SPLUNK, prepend your query with host, index, or source name to search
through only global threat alerts data.
Users Affected by Confirmed Threats
This query returns all users with confirmed threats and may be reported to your Incident Response Team for
desktop remediation. If these incidents are also high risk, consider reimaging the affected device. This query
generates a table with usernames and campaign names by which they are affected. Search for nonempty
campaign name and then deduplicate username+campaign pairs:
campaign!="" | table cUsername campaign | dedup cUsername campaign | sort + cUsername
Alternatively, with multi-value field for campaign name:
campaign!="" | transaction cUsername | table cUsername campaign | sort + cUsername
Users Affected by Confirmed Threats Within a Timeframe
This query also includes first-seen and last-seen columns. Search for nonempty campaign, aggregate by
username+campaign pair, and compute min and max of the web-flow time stamp. Results are in
epoch-milliseconds and can be converted to calendar time, if necessary.
campaign!="" | stats min(timestamp) max(timestamp) by cUsername campaign
Global Threat Alerts in Secure Network Analytics
24STIX/TAXII Service
Users Affected by High Risk and High Confidence Incidents
Alternatively, include the epoch conversion using the strftime function. This example divides the time stamp
by 1000 to remove milliseconds:
campaign!="" | stats min(timestamp) as oldest max(timestamp) as newest by cUsername campaign
|
eval oldest_time=strftime(oldest/1000,"%m/%d/%y %H:%M:%S") |
eval newest_time=strftime(newest/1000,"%m/%d/%y %H:%M:%S") |
table cUsername, campaign, oldest_time, newest_time
Users Affected by High Risk and High Confidence Incidents
This query generates a priority list table of high risk and high confidence users regardless of whether they
have a confirmed campaign. Search for high risk, high confidence, and deduplicate usernames. Since all these
incidents are both high risk and high confidence, consider reimaging the affected device.
confidence="High" risk="High" | dedup cUsername | table cUsername campaign
Users Affected by Campaign
This query generates a chart of the number of infected users over time and broken down by campaign. Search
for nonempty campaign, bin by a time span of one day, and compute a distinct count of usernames within that
bin.
campaign!="" | timechart dc(cUsername) span=1d by campaign
Note In SPLUNK, the time chart shortcut can be used.
Command and Control Servers
This query generates a list of all detected command-and-control (C&C) servers in the Confirmed category.
Search for nonempty campaign, while showing server IP address and campaign, and then deduplicate server
IP addresses. The result lists C&C IP destination addresses being used by the infected devices to maintain
C&C communication. For each C&C IP address, you also see which Threat campaign it is involved with. Can
be used to query other systems for more intelligence, provide indicators of compromise (IOCs), and identify
malicious processes and applications on the infected endpoint.
campaign!="" | table sIP campaign | dedup sIP
Integration with Cisco ISE
Cisco Identity Services Engine (ISE) is a security policy management platform that provides secure access
to network resources. Cisco ISE functions as a policy decision point and enables enterprises to ensure
compliance, enhance infrastructure security, and streamline service operations. Cisco ISE allows enterprises
to gather real-time contextual information from networks, users, and devices. You can then use that information
to make proactive governance decisions by tying identity to various elements in the network.
Global threat alerts integrates with Cisco ISE to deliver a network-level quarantine, which features the ability
to cut an infected device from the network so that no sensitive data can be exfiltrated further. The integration
between global threat alerts and Cisco ISE uses STIX/TAXII. For critical-level risk findings in which the
system is able to attribute the infection to an individual user, Cisco ISE receives a Requested Course of Action
Global Threat Alerts in Secure Network Analytics
25STIX/TAXII Service
Integration with Cisco ISE
that suggests a Threat Centric Network Access Control (TC-NAC) Quarantine, which is part of the Cisco
Rapid Threat Containment framework. Depending on the risk associated with an infection, the Requested
Course of Action could be Monitoring, Eradication, Internal Blocking, or a combination. Internal Blocking
is the course of action intended to be used in the blocking policies in TC-NAC. For more information, see
Cisco Rapid Threat Containment.
You can develop your own solution by using Cisco ISE and the data feed provided by the global threat alerts
STIX/TAXII service. The data feed includes information on identifying the infected device and the action to
be performed. You can define quarantine policies in Cisco ISE based on the recommendations in the global
threat alerts STIX/TAXII feed. For information on how to configure the global threat alerts adapter in Cisco
ISE, see the Cisco ISE Administrator Guide, Release 2.2.
Note Global threat alerts works with user identities listed in the web proxy logs as client IP's or user names.
Specifically, in the case of an IP addresses, the IP address that is available through the proxy logs may be an
IP address that collides with another IP address (for another device) on the internal corporate network. For
example, roaming users connected via AnyConnect with a split-tunnel directly to the Internet may acquire a
local IP address they have at home (for instance, a 10.0.0.x address), which may collide with an IP address
in an overlapping private range used in the internal corporate network. When you define the Rapid Threat
Containment policies, consider your logical network architecture to avoid quarantine actions being applied
to mismatched devices.
Global Threat Alerts in Secure Network Analytics
26CHAPTER 5
Proxy Device Uploads
• Proxy Device Uploads, on page 27
Proxy Device Uploads
Upload telemetry data in log files from proxy devices such as the Cisco Web Security Appliance (WSA) and
Blue Coat ProxySG to the global threat alerts system for analysis.
Step 1 Click the gear icon in the upper-right corner of the page, and select Device Accounts to open the setup wizard.
Note If there's already at least one existing device account, the setup is skipped and the Device Accounts page is
displayed.
Step 2 When you're ready to start the setup wizard to add a device account, click Let's Get Started.
Step 3 Choose how the telemetry data is uploaded from the device by selecting either automatic or manual upload from the
dropdown. The global threat alerts system supports only one upload method at a time; they cannot be combined.
Note To switch from automatic to manual uploading, all proxy devices must first be removed from the automatic
uploading configuration.
Step 4 If you selected the automatic upload method, choose what protocol is used to transfer the log files by selecting either
SCP or HTTPS.
a) Enter a name for this device, and click Add Account.
b) If you selected SCP:
• Copy the information (host, port, directory, username) to paste into your Cisco WSA configuration. For security
reasons, the information is displayed only once.
• For details on how to configure your Cisco WSA, see its Configuration Guide.
• Once the Cisco WSA Management Console returns a public SSH key, copy and paste the public SSH key into
the device account.
• Click Finish.
• Optionally, you can enter the public SSH key later by navigating to the Device Accounts page and clicking the
device.
Global Threat Alerts in Secure Network Analytics
27Proxy Device Uploads
Proxy Device Uploads
c) If you selected HTTPS:
• Copy the information (host, port, path, username, password) to paste into your Blue Coat ProxySG configuration.
• For details on how to configure your Blue Coat ProxySG, see its Configuration Guide .
• Click Finish.
Step 5 If you selected the manual upload method:
a) Validate the format of your log file(s). Follow these preparation guidelines:
• W3C log files created by Cisco WSA and Blue Coat proxies are supported.
• All log files must be compressed in GZip (*.gz) format.
• Each log file must be smaller than 1 GB. A log file bigger than 1 GB should be divided into multiple, smaller
files. Ensure separate time intervals do not overlap and every file contains the same correct header.
• Total time interval covered by the log files should be greater than two days.
• Each log file must be for a specific, non-overlapping time interval.
• Each log file must contain log entries in ascending time order; older entries before newer entries.
• Log files should be sorted alphabetically/numerically and uploaded in order according to time; older files should
be uploaded before newer files. Within a single upload, the uploading component automatically sorts the files.
If you upload multiple times, ensure you always upload newer data than before. If the naming convention used
by default in the proxy log files is retained, the file names are already correctly sorted.
• Data older than previously uploaded data will not be processed.
• The content of the log files must match certain criteria to be valid for uploading.
• We offer you a Log Validation Tool to check your log files before uploading.
• Copy-and-paste the beginning 20 lines of your log file into the Log Validation Tool to check for errors.
• Any errors are displayed, and while you correct them, the tool will automatically continue to check for
errors.
b) Click either Add files to select log files to be uploaded or drag-and-drop log files into the upload box.
Note Click Clear files to clear all files added to the upload box.
c) Clicking Start upload uploads the selected log files to the global threat alerts system for analysis. Allow the global
threat alerts system some time before seeing results.
Note To minimize the risk of dropping data, the global threat alerts system starts processing the uploaded data
after 5 hours. This gives you time to complete all your uploads and ensure everything is in place and in
proper order before processing starts.
Caution Trying to switch from manual to automatic immediately aborts all uploading and stops processing of
uploaded data. All uploaded data is discarded.
Note Closing or navigating away from the page will stop any current file upload.
Global Threat Alerts in Secure Network Analytics
28Proxy Device Uploads
Proxy Device Uploads
Note You cannot use automatic uploading unless you first stop all manual uploading. If the switch is made before
all the data is processed, some analysis data may be lost from the transition. To ensure the system does not
drop any data, perform the switch after 24 hours after the last manual upload.
What to do next
The Device Accounts page lists the proxy devices along with their information. The Status column shows the
status of each device:
• New—Incomplete configuration for SCP, may be missing public SSH key
• Provisioning—Account in the process of being provisioned, not yet ready
• Ready—Account successfully created
• Error—Hover cursor over status to display a popup message explaining the error
From this overview page, you can add more device accounts, or click any device to remove it, enter a public
SSH key, or troubleshoot.
Although it is possible to share an account between multiple devices or upload processes, we recommend you
use a separate account for each device to minimize the possibility of filename conflicts and simplify
troubleshooting upload problems.
When your device account is ready, click to view the Confirmed or Detected pages for insight into any
suspicious activities in your network.
Note Data is typically available within two to three days after provisioning is complete.
Global Threat Alerts in Secure Network Analytics
29Proxy Device Uploads
Proxy Device Uploads
Global Threat Alerts in Secure Network Analytics
30PA R T I Release Notes • August 2021, on page 33 • June 2021, on page 35 • May 2021, on page 39 • April 2021, on page 45 • March 2021, on page 49 • Before March 2021, on page 53
CHAPTER                 6
             August 2021
             Updates released in August of 2021 to Cisco cloud-based machine learning global threat alerts.
                • Classic Interface Decommissioned, on page 33
                • Improved Handling of Scans and Blocked Communications, on page 33

Classic Interface Decommissioned
             Back in June, we recommended that you switch from the classic interface to the alerts interface.
Figure 10:

             The older classic interface has now been decommissioned, and the newer alerts interface has become the only
             interface, providing you with an enhanced view of the threats on your network.

Improved Handling of Scans and Blocked Communications
             To reduce the number of false-positives, global threat alerts can now suppress threat detections triggered by
             horizontal scan communications. It can also now suppress threat detections of proxy-blocked communications
             in the initial phases of an infection.
             To improve the visualization of cases, when an infection is persistent on an endpoint, and a portion of the
             outbound communication is being blocked by a proxy (or other outbound-control process), global threat alerts
             describes the particular security event presented as a part of the threat detection.
             In this example, an attempt to communicate with a host (known to be indicative of a Trojan) is blocked by a
             proxy sensor. The security event informs you that this software is considered unwanted, since it may
             compromise your privacy or the security of your system.

                                                                Global Threat Alerts in Secure Network Analytics
                                                                                                                   33
Release Notes
Improved Handling of Scans and Blocked Communications
Figure 11: Example: security event informing you that the communication attempt was blocked by proxy
Global Threat Alerts in Secure Network Analytics
34CHAPTER 7
June 2021
Updates released in June of 2021 to Cisco cloud-based machine learning global threat alerts.
• New REST API for Automation Support , on page 35
• Secure Endpoint Integration Update, on page 35
• STIX/TAXII API Update, on page 37
New REST API for Automation Support
All visible data in the global threat alerts dashboard is now available to you through a new REST API. You
can use it to download the content of a single alert, and even automate the whole data-collection process by
streaming all your alerts to a third-party SIEM in your network.
The API is not read-only; you're able to change the configuration of your global threat alerts environment.
For example, you can increase the specific business value of a critical asset group or change the severity
assigned to a threat.
To see the API possibilities, refer to https://api.cta.eu.amp.cisco.com. There you can find the specification
and use cases which describe the API possibilities in more detail and example scripts for additional integration.
To read more about the new REST API, see global threat alerts REST API is now released!
Secure Endpoint Integration Update
We've updated the way that detections from global threat alerts are presented in Secure Endpoint. Now, the
detections are visible as events in the console, and they're directly linked with the alerts interface. As a result,
threat severity changes in the alerts interface are reflected in those events.
Global Threat Alerts in Secure Network Analytics
35Release Notes
Secure Endpoint Integration Update
Figure 12: Global Threat Alerts detections are now presented as events in the Secure Endpoint console
When an alert’s state or risk changes in the global threat alerts interface, it's reflected in the alerts overview
in the Secure Endpoint console:
Figure 13:
To avoid a compatibility issue, the classic interface will be decommissioned soon, so we recommend that you
switch from the classic interface to the alerts interface. On the global threat alerts dashboard, click the Switch
to Alerts interface button:
Global Threat Alerts in Secure Network Analytics
36Release Notes
STIX/TAXII API Update
Figure 14:
STIX/TAXII API Update
Detection links and threat vocabulary provided by the STIX/TAXII API feeds are now compatible with the
alerts interface in the global threat alerts dashboard.
Figure 15:
As a result of changes in the threat wording and taxonomy, we recommend that you check for incompatibility
issues and broken dependencies in the tools and SIEM fed by the STIX/TAXII API.
Global Threat Alerts in Secure Network Analytics
37Release Notes
STIX/TAXII API Update
Global Threat Alerts in Secure Network Analytics
38CHAPTER 8
May 2021
Updates released in May of 2021 to Cisco cloud-based machine learning global threat alerts.
• Support for SecureX Ribbon, on page 39
• Updated Daily Report Email, on page 42
Support for SecureX Ribbon
SecureX is both a centralized console and distributed set of capabilities that unify visibility, enable automation,
accelerate incident response workflows, and improve threat hunting. These distributed capabilities are presented
in the form of apps and tools in the SecureX ribbon.
The SecureX ribbon is now also available in global threat alerts, located in the lower portion of the page, and
persists as you move between the dashboard and other security products in your environment. This helps you
correlate findings with your casebook and incidents.
Global Threat Alerts in Secure Network Analytics
39Release Notes
Support for SecureX Ribbon
Figure 16: SecureX ribbon located in the lower portion of the page
You can use the ribbon to access the casebook, settings, and other apps. You can also view incidents and
search observables for enrichment.
Global Threat Alerts in Secure Network Analytics
40Release Notes
Support for SecureX Ribbon
Figure 17: Example: use the SecureX ribbon to access your casebook
To enable this functionality, the user must have a SecureX account and authorize the integration in Application
Settings.
Global Threat Alerts in Secure Network Analytics
41Release Notes
Updated Daily Report Email
Figure 18: Navigate to Application Settings and authorize integration with SecureX
Updated Daily Report Email
The Email Notifications service has been updated to email you content compatible with the Alerts dashboard.
The Daily Report email notifies you of the current status of alerts and recent changes in the number of reported
alerts.
Global Threat Alerts in Secure Network Analytics
42Release Notes
Updated Daily Report Email
Figure 19: Example: updated Daily Report email
To enable this service, select Email Notifications from the global settings menu, and enter the email addresses
that will receive the Daily Report.
Global Threat Alerts in Secure Network Analytics
43Release Notes
Updated Daily Report Email
Global Threat Alerts in Secure Network Analytics
44CHAPTER 9
April 2021
Updates released in April of 2021 to Cisco cloud-based machine learning global threat alerts.
• New DGA 2.0 Classifier, on page 45
• New MITRE References in Alert Descriptions, on page 46
New DGA 2.0 Classifier
Domain generation algorithms (DGAs) are used by attackers to randomly generate host names to bypass
security products with blocking capabilities. These algorithms are commonly used for communication in
botnets and adware. Since they're dynamically generated, they can successfully bypass security products that
rely on static, signature-based watchlists, that would otherwise block them.
Figure 20: Example: random-string domain generated by DGA to obfuscate blocker
While global threat alerts has supported the detection of DGA domains since 2015, the DGA 2.0 classifier is
a new model built on top of a neural network (state-of-the-art solution for text processing) instead of the older
random forests. This architectural refresh and a newly crafted training set result in doubling the recall (number
of true positives) while producing fewer false positives.
This can be seen in Alert > Alert detail > Security events.
Global Threat Alerts in Secure Network Analytics
45Release Notes
New MITRE References in Alert Descriptions
New MITRE References in Alert Descriptions
Now we've added MITRE references directly in the description of the alert (where available), so that you can
conveniently access supplemental information.
Figure 21: Example: four MITRE references (S0366, T1018, T1210, T1486) in the description of WannaCry
Looking for additional details about the alert and its description? Click on an ID number...
Global Threat Alerts in Secure Network Analytics
46Release Notes
New MITRE References in Alert Descriptions
Figure 22: Example: embedded link to the MITRE ATT&CK knowledge base for S0366
...to open a new browser page showing you the MITRE ATT&CK knowledge base with more information
and details about the specific threat.
Global Threat Alerts in Secure Network Analytics
47Release Notes
New MITRE References in Alert Descriptions
Figure 23: MITRE ATT&CK page with more information and details on S0366
Global Threat Alerts in Secure Network Analytics
48CHAPTER 10
March 2021
Updates released in March of 2021 to Cisco cloud-based machine learning global threat alerts.
• New Typosquatting Classifier, on page 49
• New TLS Pattern Classifier, on page 50
New Typosquatting Classifier
Typosquatting is a form of URL hijacking that relies on typographical errors (typos) made by users while
entering a URL into their web browser. This results in the user being directed to an alternative website owned
by an attacker. The typosquatting URL is visually similar to the legitimate URL, such as:
Figure 24: Example: typosquatted hostname which has an extra letter added
The typosquatting URL usually directs to online scams, such as advertising pages used to generate profit from
ads or phishing pages used to steal information from users.
Global Threat Alerts in Secure Network Analytics
49Release Notes
New TLS Pattern Classifier
Figure 25: Example: advertising page targeting users intending to go to Amazon AWS
The new classifier aims to protect users from typosquatting domains targeting most popular domains. The
classifier effectively identifies the domains similar to the most popular domains by calculating the similarity
of domains. The classifier then determines the severity of the threat based on additional parameters, such as
the age of the typosquatting domain.
This can be seen in Alert > Alert detail > Security events.
New TLS Pattern Classifier
The new classifier is built on top of Transport Layer Security (TLS) fingerprinting technologies. Taking into
account TLS headers from Encrypted Traffic Analytics (ETA) and additional global and local context features,
the classifiers detects suspicious and malicious applications based on their TLS footprint. Through analysis
of encrypted communication, the classifier extends the capabilities of models aimed at threats communicating
by HTTP.
Global Threat Alerts in Secure Network Analytics
50Release Notes
New TLS Pattern Classifier
Figure 26: Example: TLS pattern similar to a host known to be malicious
This can be seen in Alert > Alert detail > Security events.
Global Threat Alerts in Secure Network Analytics
51Release Notes
New TLS Pattern Classifier
Global Threat Alerts in Secure Network Analytics
52CHAPTER 11
Before March 2021
• Before March 2021, on page 53
Before March 2021
Updates released before March 2021 are archived in the Cisco Community Security Blogs with the Cognitive
Intelligence label and cognitive-release-notes tag.
Global Threat Alerts in Secure Network Analytics
53Release Notes
Before March 2021
Global Threat Alerts in Secure Network Analytics
54You can also read