EXPERIENCES FROM USING LORA AND IEEE 802.15.4 FOR IOT-ENABLED CLASSROOMS
←
→
Page content transcription
If your browser does not render page correctly, please read the page content below
Experiences from Using LoRa and IEEE
                                                  802.15.4 for IoT-enabled Classrooms?

                                                Lidia Pocero1 , Stelios Tsampas1 , Georgios Mylonas1 , and Dimitrios
                                                                            Amaxilatis1

                                              Computer Technology Institute and Press “Diophantus”, Rio, Patras, Greece
                                                         {pocero, tsampas, mylonasg, amaxilat}@cti.gr
arXiv:2102.08675v1 [cs.NI] 17 Feb 2021

                                                 Abstract. Several networking technologies targeting the IoT applica-
                                                 tion space currently compete within the smart city domain, both in out-
                                                 door and indoor deployments. However, up till now, there is no clear win-
                                                 ner, and results from real-world deployments have only recently started
                                                 to surface. In this paper, we present a comparative study of 2 popu-
                                                 lar IoT networking technologies, LoRa and IEEE 802.15.4, within the
                                                 context of a research-oriented IoT deployment inside school buildings in
                                                 Europe, targeting energy efficiency in education. We evaluate the actual
                                                 performance of these two technologies in real-world settings, presenting a
                                                 comparative study on the effect of parameters like the built environment,
                                                 network quality, or data rate. Our results indicate that both technologies
                                                 have their advantages, and while in certain cases both are perfectly ade-
                                                 quate, in our use case LoRa exhibits a more robust behavior. Moreover,
                                                 LoRa’s characteristics make it a very good choice for indoor IoT deploy-
                                                 ments such as in educational buildings, and especially in cases where
                                                 there are low bandwidth requirements.

                                                 Keywords: IoT · LoRa · IEEE 802.15.4 · Educational buildings · Real-
                                                 world deployment · LPWAN · Evaluation.

                                         1     Introduction

                                         The smart cities and the Internet of Things (IoT) domains are currently among
                                         the most active research areas, having gradually progressed from being mere
                                         buzzwords to having actual large-scale installations deployed and applications
                                         ?
                                             This work has been supported by the EU research project “European Extreme Per-
                                             forming Big Data Stacks” (E2Data), funded by the European Commission under
                                             H2020 and contract number 780245, and by the “Green Awareness In Action”
                                             (GAIA) research project, funded by the European Commission and the EASME
                                             under H2020 and contract number 696029. This document reflects only the authors’
                                             views and the EC and EASME are not responsible for any use that may be made of
                                             the information it contains. Preprint version of the paper submitted to 2019
                                             European Conference on Ambient Intelligence, 13-15 November 2019,
                                             Rome, Italy. AmI 2019. Lecture Notes in Computer Science, vol 11912.
                                             Springer, Cham. https://doi.org/10.1007/978-3-030-34255-5 13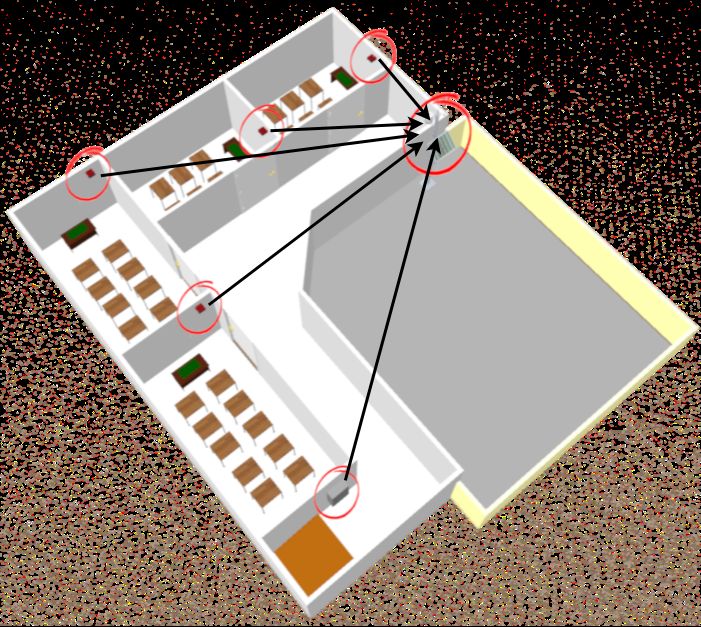
2

developed. In this context, a number of competing wireless networking technolo-
gies have surfaced in recent years, aiming to appeal to the communities that
engage within these two domains. Advancements in wireless communications
technology have enabled a multitude of different approaches to the trade-off
between power consumption, communication range and bandwidth, in order to
answer to all the various types of application use-case requirements. In this con-
text, recent technologies like LoRaWAN and NB-IoT have surfaced, aiming to
claim a place in the area originally covered by technologies like ZigBee.
    As part of our research activity, we have developed an IoT platform that
combines sensing, web-based tools and gamification elements, in order to ad-
dress the educational community. Within the context of a research project, its
aim is to increase awareness about energy consumption and sustainability, based
on real-world sensor data produced by the school buildings where students and
teachers live and work, while also lead towards behavior change in terms of
energy efficiency. This real-world IoT deployment developed through the afore-
mentioned project provides real-time monitoring of 25 school buildings spread
in 3 European countries.
    Due to the multi-year development phase of the project, a number of con-
ditions, like limited availability of certain networking components and appear-
ance on the market of new ones, have led us to follow a heterogeneous approach
with several networking technologies utilized in different buildings of our deploy-
ments. During the previous development phases, we have used almost exclusively
IEEE 802.15.4-based 2.4GHz modules. However, school buildings have certain
characteristics that in practice lead to less than optimal results in terms of relia-
bility and connectivity. For this reason, we decided to shift towards LoRa-based
modules for our deployments in some specific school buildings. LoRa is also well-
suited to application use-cases where devices mostly transmit data to the cloud or
a nearby gateway (uplink), versus downlink, which also reflects better in the de-
sign of other, higher-level, protocols used in IoT. ZigBee and other technologies
are better suited for use-cases with more symmetric bandwidth requirements.
The frequencies used in LoRa aim for longer range, while they also help to pro-
vide a higher degree of wall penetration than other protocols, although 802.15.4
modules are also available in similar frequencies (i.e., apart from 2.4GHz) but
their availability is limited and not guaranteed.
    In this paper, we present a comparison between LoRa and IEEE 802.15.4 as
a networking backbone of an IoT deployment inside a number of school buildings
in Europe. We relay our experiences from using both technologies in practice,
to develop IoT real-world, reliable and well-performing deployments as a foun-
dation for pervasive computing applications. We present an overview of the two
technologies and how we used them in our use-case, along with an analysis of
the effect of changing parameters like network density, application data rate and
distance between nodes. Our results indicate that in our use-case and under the
design constraints that we had, LoRa works in a more reliable manner while also
satisfying our data rate requirements.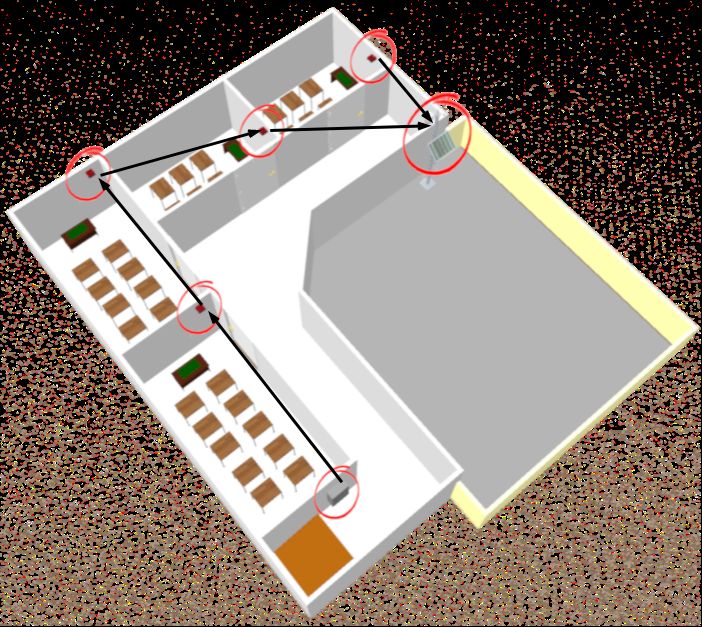
Experiences from Using LoRa & IEEE 802.15.4 for IoT-enabled Classrooms         3

2      Previous Work

Regarding recent comparisons between protocols used for low power wide area
networks (LPWAN) in IoT, [15] and [18] discuss aspects related to LoRa, NB-
IoT and ZigBee. All of these technologies are being used especially in smart
city applications, and currently there is a lot of interest in understanding the
parameters related to the their performance in the real world. This aspect is
discussed in [16], where a smart city deployment using LoRa and IEEE 802.15.4
is evaluated using mostly simulation methods and limited real-world studies.
[11] provides a survey of LoRaWAN for IoT and recent examples of related
applications, along with a discussion on its advantages and shortcomings.
     Although most related works describing aspects like the ones mentioned
above are limited to simulation, there are some recent ones performing measure-
ments in real-world settings. LoRa performance is explored to a certain degree in
[9], with a discussion on possibilities and limitations. In [8], a performance eval-
uation of LoRaWAN and its integration in IoT devices is discussed, while [13]
explores its scalability in the context of large-Scale sensor networks. [14] presents
an evaluation of LoRaWAN using a permanent outdoor deployment, while [17]
provides an experimental study on LPWANs for mobile IoT applications. [10]
provided a study of LoRa in long-range use-cases and produced certain radio
propagation models to be used when designing LoRa-based solutions. Their work
confirmed coverage of up to 8 kilometers in urban and 45 kilometers in urban
areas (in line-of-sight conditions). [19] provided a simulation-based comparative
study between LoRa and NB-IoT, describing the advantages of each technology
in specific areas and use-cases.
     However, so far most works are either mostly based on simulation, or they do
not attempt a straight apples-to-apples comparison between different networking
technologies in specific use-cases e.g., for IoT, pervasive computing or smart
cities. Our work here contributes to the discussion over which technology is better
suited for real-world application in a representative use-case; school building
are a characteristic and ubiquitous example of public building. Our application
requirements in terms of data sampling and quality of service (QoS) are also
similar to other related application scenarios (e.g., office building monitoring
and automation).

3      Short Overview of IEEE 802.15.4 and LoRa

In this section, we present a brief comparison between the IEEE 802.15.4 and
LoRa networking, in order to give a context for the sections that follow and
discuss their performance in more detail.

3.1     IEEE 802.15.4

The IEEE 802.15.4 is a standard for wireless communication. It specifies the
use of Direct Sequence Spread Spectrum (DSSS) and an Offset Quadrature
4
Phase Shift Keying (O-QPSK). The IEEE 802.15.4 protocol specification in-
cludes both a Physical and a MAC layer definition. The physical layer defined
the frequency (possible frequencies are 868M Hz, 915M Hz and 2.4GHz) and
the number of channels. The MAC layer defines the device types (physical ad-
dress) and channel access. The 802.15.4 physical layer defines the possibility of 16
channels in ISM band from 5M Hz channel spacing, beginning at 2405M Hz and
ending at 2480M Hz. The carrier-sense multiple access with collision avoidance
(CSMA/CA) protocol is implemented as part of the MAC layer by using a CCA
(clear channel assessment) technique to determine if the channel is available
before to transmitting a packet [2].
Moreover, the European Telecommunication Standards Institute (ETSI) reg-
ulates the maximum transmitted RF power in wireless networking modules via
the ETSI EN 300 328 standard. Two clauses are the most important: the maxi-
mum transmit power, which limits power to 100mW , and the maximum EIRP
spectral density, which is limited to 10mW/Hz [2]. The ETSI standard sets a
safe limit for RF output power around 12dBm [5]. Furthermore, in the 2.4GHz
band, a maximum over-the-air data rate of 250kbps is specified, but due to the
overhead of the protocol, the actual theoretical maximum data rate is approxi-
mately half of that [4].
For our network implementation, for the 802.15.4 part we have chosen to use
XBee network modules; in the rest of the text, XBee refers to 802.15.4 aspects.
We set every XBee module at the 802.15.4 MAC mode with ACKs acknowl-
edgment protocol. The RF module operates in a unicast mode that supports
retries. The receiving modules send an ACK of RF packets to confirm reception
to the transmitter. If the transmitting module does not receive the ACK, it will
resend the packet up to three times, or until the ACK packet is received. The
transmission happens directly without any delays. The modules are configured
to operate with a peer-to-peer network topology with no master/slave relation-
ship and each module of the network shares both roles master and salve. The
Network ID and Channel must be identical across all the modules in the net-
work. Each RF packet contains a maximum of 100 characters (100bytes). In our
network, the payload of the RF packet will be variable but always smaller than
the 100 character limit, which means all messages are transmitted within one
packet.
3.2 LoRa
Long Range (LoRa) was originally conceived as a long-range wireless communica-
tion technology that operates on the sub-GHz license free ISM bands (868M Hz
in Europe and 915M Hz in the U.S.). This means that, in contrast to other re-
lated technologies like NB-IoT, it operates in frequencies that are free to use and
anybody can potentially operate a LoRa network without requiring a license for
it. Regarding features of LoRa that are examined in this work, the over-the-air
LoRa modulation technique can be understood as a MFSK modulation on top
of a Chirp Spread Spectrum (CSS) method. Each bit is spread by a chipping
factor, with the number of chips per bit called Spread Factor (SF). Chirps areExperiences from Using LoRa & IEEE 802.15.4 for IoT-enabled Classrooms 5
used to encode data in LoRa networks for transmission, while inverse chirps are
used on the receiver side for signal decoding. The modulation across the channel
is weeping so that the transmission signal occupies the chosen bandwidth (BW).
SFs specifically set the data transfer rate relative to the range, by essentially in-
dicating how many chirps are used per second, and define bit rates, per symbol
radiated power, and achievable range. The possible values of SF are between 6
and 12. The data rate depends on the selected SF, e.g., SF 9 is 4 times slower
than SF 7 in terms of bit rate. In general, the slower the bit rate, the higher the
energy per data set and the higher the range [8].
The 868 ISM frequency band ranges from 865M Hz to 870M Hz and is regu-
lated for the European zone[12]. The rules are based on two restrictions: a) the
maximum power transmission that can be used on a channel at the communi-
cation is 25mW (equivalent of 14dB); b) the duty cycle that is defined as the
ratio of maximum time-on-air (ToA) per hour and is limited to 1%, which in
practice restricts the communication of each LoRa device with other nodes to
36 seconds per hour. The MAC layer of LoRa does not implement any listen-
before-talk (LBT) or CSMA to avoid collisions. Instead it implements a pure
Aloha protocol, sending data whenever available, thus the number of collisions
increases together with transmission rate or network node density.
4 A large-scale IoT infrastructure inside school buildings
Overall, the deployed devices provide 1250 sensing points organized in four cate-
gories: (1) classroom environmental sensors; (2) atmospheric sensors (outdoors);
(3) weather stations (on rooftops); and (4) power consumption meters (attached
to electricity distribution panels). Given the diverse building characteristics and
usage requirements, deployments vary between schools (e.g., number of sensors,
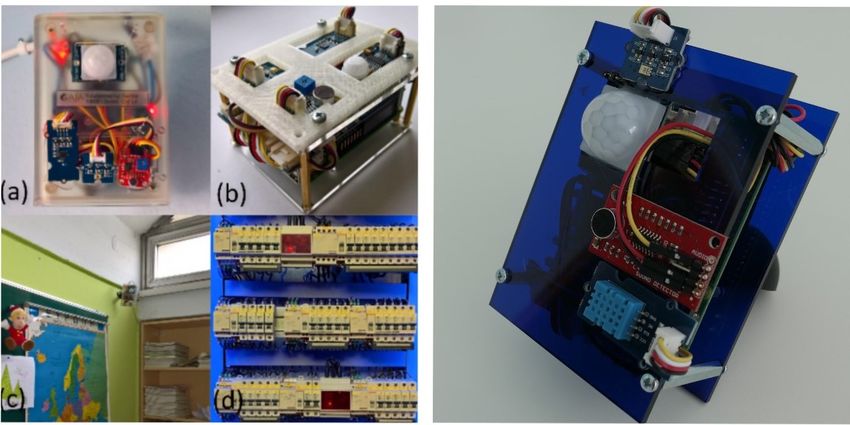
manufacturer, networking, etc.). The IoT devices (Fig. 1) used are either open-
design IoT nodes, or off-the-shelf products from IoT device manufacturers. In-
door devices use IEEE 802.15.4 or LoRa wireless networks. These devices are
connected to cloud services via IoT gateway devices, which coordinate commu-
nication with the rest of the platform, while outdoor nodes use wired networking
or WiFi.
4.1 IEEE 802.15.4 Network Topology
The IEEE 802.15.4 communication between the IoT nodes is provided by XBee
modules connected to each IoT node operated by the Arduino XBee [1] and
XBeeRadio [6] software libraries. Node-to-node communication includes the check-
sum of the payload, which is validated at the network level for each node to
determine erroneous or invalid messages, which are discarded.
All IoT nodes form ad-hoc networks and report their measurements through
the designated IoT gateways. Because IEEE 802.15.4 is a short-range commu-
nication technology and end-to-end communication is not possible due to power6 Fig. 1. Examples of the IoT infrastructure located inside school buildings in Greece (a-b) IoT nodes based on Arduino and Raspberry Pi, c) actual node inside a classroom, d) power meter installed on a electricity distribution panel. on the right part of the figure, the latest hardware revision of the actual environmental nodes used in our IoT infrastructure, utilizing a LoRa communication module. limitations and propagation obstacles, all indoor IoT nodes form an ad-hoc over- laying multi-hop bidirectional tree network. The gateway is the root of this tree and the orchestrator of the network. New nodes can join the network at any time either directly below the gateway, or as a child of the node that is closer to the gateway and has a received signal strength indication (RSSI) lower than a specific threshold ( in our case 90db). The resulting routing tree allows for bidi- rectional communication between the IoT nodes and the gateway. The routing library developed for the Arduino and XBee devices is also available on GitHub. An example of a formed network can be seen in Fig. 2(a). Once the network has been established, each node collects environmental or other sensor data and emits a data packer (e.g., an Environmental Data Packet (EDP)) to the GW every 10 seconds. The payload size varies depending on the sensing activity, but in our case it is always lower than the limit of a 100 character payload to fit in a single packet. In addition, each environmental node checks its motion (PIR) sensor every 2 seconds and emits a PIR Data Packet (PDP) independently each time motion is detected. 4.2 LoRa Network Topology Our IoT nodes based on LoRa use a single-hop topology to cover the neces- sary distance (tested with up to 3-floor concrete-built buildings), thanks to the communication range and signal penetration characteristics. An example of a formed network showing the difference with the IEEE 802.15.4 network can be seen in Fig. 2(b). A network, in which the IoT nodes communicate directly with
Experiences from Using LoRa & IEEE 802.15.4 for IoT-enabled Classrooms               7

Fig. 2. Examples of data collection routes in an IEEE 802.15.4 (left) and a LoRa (right)
IoT deployment, using a tree/multihop and a star network topology, respectively.

the IoT GW has been installed inside multiple school buildings. We use LoRa to
build our own wireless LoRa Personal Area Network (PAN) with a star topology.
The IoT nodes communicate using the Grove LoRa 868M Hz [4] modules with
a LG01-N Single Channel LoRa Dragino gateway [3], suitable for small-scale
LoRa networks. The communication device for both the Dragino and the Grove
modules is based on the RF95 SX1276 LoRa module [7].

    The GW coordinates the communication with every node to guarantee that
the nodes do not occupy the medium at the same time. This implementation is
necessary to avoid the interference due to ALOHA MAC protocol and guarantee
no interference between the nodes at the same network. The network is created
by the GW announcing itself through broadcast messages. The new nodes reply
to the broadcast with a connection request which, if it is accepted by the GW, is
acknowledged by a confirmation message. The ALOHA protocol with a random-
ized delay is used by the nodes to answer to the GW network announcement.

    Once the network is setup, the GW requests data periodically from each node
in a sequential fashion with a Data Request Packet (DRP). The nodes reply with
a a Data Packet (DP) consisting of the sensor measurements. The request rate
of the GW is configurable to adjust to the requirements of ToA EU regulations.
In this case, the node samples the PIR sensor between GW requests and includes
the motion sensing information in the DP to avoid creating overhead. If a reply
is not received or the reply is corrupted, the GW can repeat the DRP up to
three times for each node. We implemented our own CRC (Cycle Redundancy
Check) method at network level to detect message corruption instead of using
the LoRa module functionality at MAC level. The network is refreshed every 15
minutes. On each refresh, new nodes can be attached while unreachable nodes
are not removed to speedup future reconnects.
8
5 LoRa network configurations comparison
The maximum ToA is restricted in Europe, thus limiting the packet rate for
each network device. The ToA of each LoRa packet depends on the spreading
factor (SF), coding rate (CR), signal bandwidth (BW) and the packet payload
(PL). The LoRa packet duration is the sum of the duration of the preamble and
the transmitted packet. The data-sheet of the SX1276 module [7] describes the
formula to calculate the number of payload symbols and the preamble length.
We use this to determine the ToA of each packet of our network in milliseconds,
and thus we can calculate the maximum legal packet rate to accommodate the
36 seconds ToA per node limit under different network configurations. The max-
imum PL of each DP is 60bytes and the PL of each DRP is fixed at 4bytes. A
comparison for each type of packet between different network configuration is
described in Table 1 showing the corresponding PL, ToA for a single packet in
milliseconds and the minimum Period between transmissions in seconds.
Table 1. Packet ToA and Period per device
Node (Data Packets) Gateway (Data Request Packets)
SF BW PL Packet ToA Min. Period PL Packet ToA Min. Period
[kHz] [Bytes] [ms] [s] [Bytes] [ms] [s]
7 125 60 112.896 11.289 4 30.976 3.097
7 250 60 56.448 5.644 4 15.488 1.548
7 500 60 25.088 2.8224 4 7.744 0.774
9 125 60 319.488 36.966 4 123.904 12.390
9 250 60 159.744 18.483 4 61.952 6.195
9 500 60 79.872 9.241 4 30.976 3.097
As described, the GW requests data from each node periodically by sending a
DRP with a 4bytes payload. As a consequence, in our case the maximum packet
rate (minimum period between DPs) per node is limited by the maximum packet
rate (minimum period between DRPs) of the GW, which depends on the total
number of nodes in the network. Table 2 presents the theoretical minimum period
per node and the maximum packets per 15 minutes in our network as influenced
by the restrictions of the ToA of the GW under different network configurations
for two schools (LoRa School A, LoRa School B ) of our installation.
The maximum packet rate per node is achieved with SF 7 and BW 500kHz,
which we implemented in our final network installation due to our priority of
maximizing the sensing rate in the school and achieving a better sampling of
the environmental reality in the public buildings. It is noteworthy that higher
spreading factors allows for longer range at the expense of lower data rate, and
vice versa.
We aim to compare the quality of the network under two extreme configura-
tions. Configuration A provides higher rate (SF 7, BW 500kHz) and Configura-
tion B provides longer range (SF 9, BW 125kHz). In order to study the networkExperiences from Using LoRa & IEEE 802.15.4 for IoT-enabled Classrooms 9
Table 2. Theoretical minimum Period and maximum Packets per 15 min. n represents
the number of nodes in the network
n Nodes LoRa School A (6 nodes) LoRa School B (7 nodes)
SF BW Min. Period Max. Packets Min. Period Max. Packets Min. Period Max. Packets
[kHz] [s] [#] [s] [#] [s] [#]
7 125 3.09*n 290.54/n 18.58 48.42 21.68 41.50
7 250 1.54*n 581.09/n 9.29 96.84 10.84 83.01
7 500 0.77*n 1162.19/n 4.64 193.69 5.42 166.02
9 125 12.39*n 72.63/n 74.34 12.10 86.73 10.37
9 250 6.19*n 145.27/n 37.17 24.21 43.36 20.75
9 500 3.09*n 290.54/n 18.58 48.42 21.68 41.50
behaviour, we collected the following measurements per node: the number of
DRPs from the GW, the number of received DPs, and the number of packets
received with CRC errors over a period of 15 minutes.
The maximum number of packets received under Configuration 1 is limited by
the ToA imposed by communications regulations. Thus we have to set the GW
request rate accordingly to implement this restriction. As such, Configuration 1 is
limited to 12 packets, per 15 minutes, per node. On the other hand, Configuration
2 is limited by the regulation at 193.69 (Table 2) packets, per 15 minutes, per
node. Effectively, Configuration 2 is restricted by the node design constraints.
The GW requests data from each node after a 50ms delay to guarantee the
correct communication between the LoRa module and the micro-controller. In
addition, the Environmental Nodes consume time to communicate through I2C
with their digital sensors to collect the data for each request, limiting the final
rate of the node. Due to these factors, in School Building A’s installation every
node can achieve a maximum of 174 packets (Table 3) per 15 minutes, which is
lower but close to the theoretical limit. On both configurations, the average of
the delivered DP rate (Table 3) is higher for the nodes near the GW (Nodes 1,
5 and 6).
Table 3. Number of delivered DPs per node under different configurations in a 15
minute period
node1 node2 node3 node4 node5 node6
Configuration 1 Avg. 11.17 11.17 11.15 11.16 11.16 11.16
SF 9, BW 125 kHz Min. 5.00 5.00 0.00 0.00 5.00 5.00
Max. 12.00 12.00 12.00 12.00 12.00 12.00
Configuration 2 Avg. 155.24 149.77 145.79 150.87 155.23 155.22
SF 7, BW 500 kHz Min. 77.00 0.00 0.00 1.00 77.00 77.00
Max. 174.00 174.00 174.00 174.00 174.00 174.0010
As an indicator of the quality of the network, we define CRC Error Ratio
and Re-transmission Ratio. CRC Error Ratio is the ratio of DRPs from the GW
which resulted in a corrupted DP being received. Re-transmission Ratio is the
ratio of DRPs required to be repeated, either because of CRC errors, malformed
DRP or due to not receiving a reply. We are also interested in the connectivity
between the GW and every node in our LoRa network. We quantify the quality
of each link by calculating the Packet Delivery Ratio (PDR) for every node. The
PDR of the link between node A and GW can be measured as the ratio between
the number of DPs received by the GW from node A, and the number of DRPs
sent from the GW to the node A. The GW makes one DRP and a maximum of
3 re-transmissions of the DRP per node. In addition, we study the variation of
the Received Signal Strength Indicator (RSSI) per node in the network for both
configurations.
Table 4. Packet Delivery Ratio (PDR) per node under different configurations
node1 node2 node3 node4 node5 node6
Configuration 1 Avg. 0.96 0.96 0.96 0.95 0.95 0.93
SF 9, BW 125 kHz SD 0.03 0.03 0.04 0.05 0.03 0.03
Min. 0.72 0.80 0.00 0.00 0.86 0.80
Max. 1.00 1.00 1.00 1.00 1.00 1.00
Configuration 2 Avg. 0.99 0.93 0.86 0.89 0.98 0.97
SF 7, BW 500 kHz SD 0.01 0.22 0.27 0.19 0.01 0.02
Min. 0.91 0.00 0.00 0.00 0.93 0.88
Max. 1.00 1.00 1.00 1.00 1.00 1.00
Table 5. Received Signal Strength Indicator (RSSI) per node under different configu-
rations
node1 node2 node3 node4 node5 node6
Configuration 1 Avg. -45.06 -50.55 -87.78 -87.08 -53.52 -52.40
Sf 9, BW 125 kHz SD 0.41 0.98 2.59 1.73 1.35 1.29
Min. -46.13 -54.25 -95.47 -95.29 -59.40 -55.77
Max. -43.74 -48.75 -82.12 -84.12 -51.73 -50.17
Configuration 2 Avg. -42.04 -46.29 -82.23 -86.86 -49.88 -44.78
Sf 7, BW 500 kHz SD 3.17 10.84 16.92 4.66 1.68 3.25
Min. -55.33 -56.98 -89.00 -88.44 -57.70 -60.79
Max. -37.40 0.00 0.00 0.00 -48.17 -41.27
We expected to observe a worse quality network under Configuration 2, as
a consequence of selecting parameter values that achieve a higher packet rate.
We can observe that the median value for the CRC Error Ratio distributionExperiences from Using LoRa & IEEE 802.15.4 for IoT-enabled Classrooms 11
Fig. 3. Per node statistics for configurations 1: SF 7, BW 500kHz and 2: SF 9, BW
125kHz.
of each node is higher with similar standard deviation with the exception of
the closest node (Node 1, CRC Error Ratio graph in Fig. 3). The degradation of
network quality is evident at the farthest nodes (3 and 4) from the GW regarding
the number of Re-transmissions (Re-transmission Ratio graph in Fig. 3), which
exhibits higher standard deviation and more frequent and distant upper outliers.
In addition, the PDR (Packet Delivery Ratio in Fig. 3) of these nodes is worse
than in Configuration 1, with higher standard deviation and more frequent and
distant lower outliers. On the other hand, the nodes closest to the GW achieve
better network behavior regarding Packet Delivery and Re-transmission Ratios.
Furthermore, the RSSI distribution (RSSI in Figure 3) exhibits greater standard
deviation, entailing less stable signal strength.
In conclusion, we observed the expected cost in network quality, only in
the further nodes, while in nearby nodes we observed an increase in the link’s
efficiency. This combined with the increase in the per node packet rate, resulted
in a significant increase in sensor measurements across the whole network.
6 XBee network behavior in school buildings
Every node in the XBee network tries to deliver an Environmental Data Packet
(EDP) to the GW every 10 seconds while emitting an extra PIR Data Packet
(PDP) each time motion is detected. The network overhead due to the extra12
PDPs can saturate the medium and provoke a decrease of EDPs delivered per
node, thus decreasing the EDP rate. The data-set considered to analyze the
specific behaviour in XBee School C is composed of the total number of packets
delivered in the network in 5 minute periods (EDPs and PDPs from every nodes).
To quantify the effects of the independent PDPs, we use their ratio against the
observed maximum of the aggregation.
Fig. 4 shows clearly how during school hours the PDPs can cause an observ-
able decrease in the number of EDPs, due to the saturation of the network at
peak of PDP Ratio. The maximum number of EDPs is observed when the num-
ber of PDPs is zero (Table 6). In addition, when the number of PDPs exhibits a
maximum, the number of EDPs decreases below their average. The decision to
include real-time motion detection to the network, can potentially be a hindrance
to the stability of the EDP rate of our network.
Table 6. XBee Network behaviour. Number of Aggregated Packets, PDPs and EDPs
delivered at the time of maximum and minimum Aggregated Packet Ratio, EDP Ratio
and PDP Ratio respectively.
Aggregated Packets PIR Packets Env. Packets
Average
Max Min Max Min Max Min
Aggregated Packets [#] 143.05 185 84 178 142.11 157 87
PIR Packets [#] 1.91 41 3 45 0.00 0 7
Node Packets [#] 141.13 144 81 133 142.11 157 80
7 Discussion - Comparison inside school buildings
We aim to compare the quality of our LoRa and IEEE 802.15.4 IoT networks
by comparing our observations from two real school buildings. LoRa School A
consists of a LoRa Network with 6 nodes where the Node 3 and 4 are located at
the farthest positions and the Node 1 and 5 at the nearest in relation with the
GW. XBee School C has an XBee network consisting of 6 nodes, the farthest
is node 6 and the nearest is the node 5. Due to the significant differences in
radio and network architectures, to compare them we quantify the quality of
these networks by the Network Delivery Ratio (NDR). The NDR is defined as
the ratio between the measured Delivered Packets and the potential maximum
number of Packets that could be delivered by each node in the network in a
time period, which in our case is 15 minutes. Every node in the XBee network
is scheduled to attempt to send data to the GW every 10 seconds, resulting in
a maximum of 90 packets in a 15 minute period. In the LoRa network using
Configuration 2 and with 6 nodes, the network can achieve the delivery of a
maximum of 174 packets. The data-set consists of NDR measurements collected
during a period of both business and weekend days for LoRa School A and XBee
School C can be seen in Table 7 and Figure 5.Experiences from Using LoRa & IEEE 802.15.4 for IoT-enabled Classrooms 13 Fig. 4. Aggregated Packet Ratio, EDP Ratio and PDP Ratio in XBee School C over 48 hours (Sunday and Monday) We observe that the best network quality in terms of NDR is observed in the LoRa School A under Configuration 1 which is the one with lowest rate where the maximum number of Data Packets per node in a 15 minute period is 12 packets. The network in XBee School C exhibits a better NDR than LoRa School A under Configuration 2 regarding the averages for every node with the exception of the farthest one that achieve a delivery of 20% of the generated packets. On the other hand, the network in LoRa School A under Configuration 2 achieves a more stable NDR across the installation, including the farthest nodes, with successful packet deliveries between 86% and 89% for every node and a significantly higher delivery rate. The tree topology necessary for the XBee network to achieve comparable range to LoRa, influences negatively the packet rate of the nodes placed at the extremes of the tree. In comparison, LoRa’s star network topology offered better coverage with a more stable data rate on all nodes. 8 Conclusions and Future Work Our work in recent years has resulted in the deployment of a large-scale IoT infrastructure inside a number of school buildings in Europe. In this context, we have opted to use different wireless networking technologies in order to test in practice their performance. With this work, we wanted to relay our practical experiences from using both IEEE 802.15.4 and LoRa for our specific application
14

Table 7. Network Delivery Ratio (NDR) per node for LoRa and IEEE 802.15.4 Net-
works in different school buildings

          Netwrok               node1   node2   node3   node4   node5   node6
          LoRa School A Avg.     0.94    0.94    0.94    0.94    0.94    0.94
          Conf. 1       SD       0.03    0.03    0.04    0.04    0.03    0.03
          SF 9, BW 125  Min.     0.41    0.41    0.00    0.00    0.41    0.41
                        Max.     1.00    1.00    1.00    1.00    1.00    1.00
          LoRa School A Avg.     0.89    0.86    0.84    0.87    0.89    0.89
          Conf. 2       SD       0.12    0.22    0.25    0.17    0.12    0.12
          SF 7, BW 500  Min.     0.44    0.00    0.00    0.01    0.44    0.44
                        Max.     1.00    1.00    1.00    1.00    1.00    1.00
                        Avg.     0.85    0.91    0.92    0.92    0.92    0.20
                        SD       0.04    0.05    0.05    0.04    0.05    0.05
          XBee School C
                        Min.     0.28    0.32    0.31    0.31    0.32    0.09
                        Max.     0.91    0.98    0.98    0.98    0.99    0.38

Fig. 5. Network Delivery Ratio (NDR) per node in LoRa School A (left) under Con-
figuration 2 and XBee School C (right)
Experiences from Using LoRa & IEEE 802.15.4 for IoT-enabled Classrooms 15
use-case and provide some practical examples and guidelines for IoT deployments
that are similar to ours.
We have studied the behavior of both networks, in the scenario of changing
the number of nodes in the network, varying the sampling rate of the sensors and
the required data rate, or changing the distance between the IoT nodes inside
the building. As an example of the results from the comparisons we made, LoRa
decreases its delivery rate when increasing the number of nodes because of ToA
European regulations which restricts the number of GW data requests in our
network design. In 802.15.4 we expect an increased number of collisions when
adding nodes due to CSMA. In the case of increasing the distance between nodes,
LoRa achieves longer range with a stable rate, while 802.15.4 will need hop nodes
in the middle, leading to increased number of collisions and an unstable rate in
extreme nodes as a side effect.
Overall, our results show that in the use-case scenario and environmental
settings of school buildings in Greece, LoRa-based wireless communication can
have an advantage against competing technologies, in terms of reliability and
complexity of networking. Regarding our future work, we plan to conduct a more
thorough performance evaluation and explore in additional dimensions practical
aspects like networking performance and reliability.
References
1. Arduino xbee library, https://github.com/andrewrapp/xbee-arduino (accessed
July 19, 2019)
2. https://www.digi.com/resources/documentation/digidocs/PDFs/90000976.pdf
(accessed July 19, 2019)
3. https://www.dragino.com/products/lora/item/143-lg01n.html (accessed July 19,
2019)
4. https://www.seeedstudio.com/Grove-LoRa-Radio-868MHz-p-2776.html (accessed
July 19, 2019)
5. https://www.semtech.com/uploads/documents/etsi-compliance-sx1272-lora-
modem.pdf (accessed July 19, 2019)
6. mksense, arduino xbee radio library, https://github.com/mksense (accessed July
19, 2019)
7. Semtech, sx1276/77/78/79 datasheet, https://www.semtech.com/products/wireless-
rf/lora-transceivers/sx1276 (accessed July 19, 2019)
8. Bouras, C., Kokkinos, V., Papachristos, N.: Performance evaluation of
lorawan physical layer integration on iot devices. pp. 1–4 (10 2018).
https://doi.org/10.1109/GIIS.2018.8635715
9. Carlsson, A., Kuzminykh, I., Franksson, R., Liljegren, A.: Measuring a LoRa
Network: Performance, Possibilities and Limitations: 18th International Con-
ference, NEW2AN 2018, and 11th Conference, ruSMART 2018, St. Pe-
tersburg, Russia, August 27–29, 2018, Proceedings, pp. 116–128 (09 2018).
https://doi.org/10.1007/978-3-030-01168-0 11
10. El Chall, R., Lahoud, S., El Helou, M.: Lorawan network: Radio propagation mod-
els and performance evaluation in various environments in lebanon. IEEE Internet
of Things Journal PP, 1–1 (03 2019). https://doi.org/10.1109/JIOT.2019.290683816
11. Haxhibeqiri, J., De Poorter, E., Moerman, I., Hoebeke, J.: A survey of
lorawan for iot: From technology to application. Sensors 18(11) (2018).
https://doi.org/10.3390/s18113995
12. Lavric, A., Popa, V.: A lorawan: Long range wide area networks study. 2017 In-
ternational Conference on Electromechanical and Power Systems (SIELMEN) pp.
417–420 (2017)
13. Lavric, A., Popa, V.: Performance evaluation of lorawan communication scalabil-
ity in large-scale wireless sensor networks. Wireless Communications and Mobile
Computing 2018, 1–9 (06 2018). https://doi.org/10.1155/2018/6730719
14. Marais, J., Malekian, R., Abu-Mahfouz, A.: Evaluating the lorawan protocol us-
ing a permanent outdoor testbed. IEEE Sensors Journal PP, 1–1 (02 2019).
https://doi.org/10.1109/JSEN.2019.2900735
15. Mekki, K., Bajic, E., Chaxel, F., Meyer, F.: A comparative study of lp-
wan technologies for large-scale iot deployment. ICT Express 5(1), 1 – 7
(2019). https://doi.org/https://doi.org/10.1016/j.icte.2017.12.005, http://www.
sciencedirect.com/science/article/pii/S2405959517302953
16. Pasolini, G., Buratti, C., Feltrin, L., Zabini, F., De Castro, C., Verdone, R., An-
drisano, O.: Smart city pilot projects using lora and ieee802.15.4 technologies.
Sensors 18, 1118 (04 2018). https://doi.org/10.3390/s18041118
17. Patel, D., Won, M.: Experimental study on low power wide area net-
works (lpwan) for mobile internet of things. In: 2017 IEEE 85th Ve-
hicular Technology Conference (VTC Spring). pp. 1–5 (June 2017).
https://doi.org/10.1109/VTCSpring.2017.8108501
18. Sinha, R.S., Wei, Y., Hwang, S.H.: A survey on lpwa tech-
nology: Lora and nb-iot. ICT Express 3(1), 14 – 21 (2017).
https://doi.org/https://doi.org/10.1016/j.icte.2017.03.004, http://www.
sciencedirect.com/science/article/pii/S2405959517300061
19. Sinha, R.S., Wei, Y., Hwang, S.H.: A survey on lpwa tech-
nology: Lora and nb-iot. ICT Express 3(1), 14 – 21 (2017).
https://doi.org/https://doi.org/10.1016/j.icte.2017.03.004, http://www.
sciencedirect.com/science/article/pii/S2405959517300061You can also read


