MPRA Systemic Liquidity Crisis with Dynamic Haircuts
←
→
Page content transcription
If your browser does not render page correctly, please read the page content below
M PRA
                           Munich Personal RePEc Archive

Systemic Liquidity Crisis with Dynamic
Haircuts

Can Sever

Boğaziçi University

25. April 2014

Online at http://mpra.ub.uni-muenchen.de/55602/
MPRA Paper No. 55602, posted 1. May 2014 04:33 UTC
Systemic Liquidity Crisis in a Banking System with Dynamic Haircuts
                                                Can Sever∗

                                              April 28, 2014

      Abstract

    In this paper, using network tools, I analyse systemic impacts of liquidity shocks in interbank market
in case of endogenous haircuts. Gai, Haldane and Kapadia (2011) introduce a benchmark for liquidity
crisis following haircut shocks, and Gorton and Metrick (2010) reveal the evidence from 2007-09 crisis
for increasing haircuts with banking panic. In the benchmark model, I endogenize and update haircuts
dynamically during the period of stress. The results significantly differ from static haircut case. I show
that the gap in the impacts of haircut shocks between dynamic and static haircuts is persistent for
different experiments. I analyse the effects of connectivity, balance sheet and network positions of banks,
and liquidity level and distribution on crisis. As well as aggregate and idiosyncratic shocks, by considering
possible correlations on the asset sides of banks, I also introduce a shock hitting several banks at the
same time. This study may be useful for policy makers to predict the consequences of liquidity shocks
more accurately. The findings are also related to microprudential regulation on liquidity surcharge for
systemically important financial institutions (SIFI’s) and produce policy recommendations on minimum
liquidity requirements.

Keywords: systemic risk, liquidity risk, liquidity crisis, liquidity hoarding, random network, geometric
network, dynamic haircut, liquidity surcharge, systemically important financial institution (SIFI)
JEL Classification Numbers:

  ∗
   Address: Boğaziçi University, Department of Economics, Natuk Birkan Building, 34342 Bebek, Istanbul,
(Turkey). e-mail: can.sever@boun.edu.tr, cnsvr89@gmail.com.

                                                     1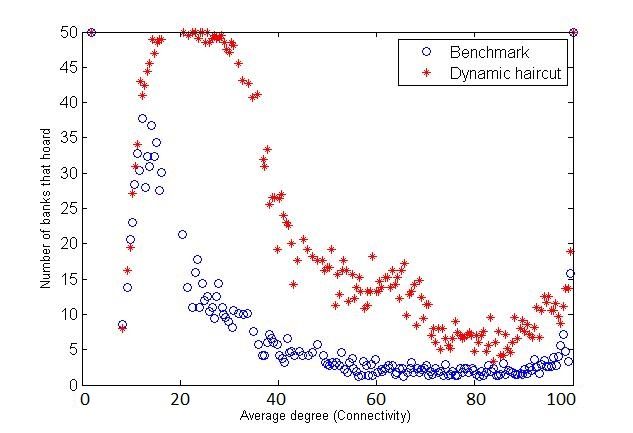
1       Introduction
    In recent years, especially after 2008 crisis, more effort has been directed by both policy makers and
academia in order to investigate and understand the nature and dynamics of systemic risk in financial
systems, since its social and economic costs are significant1 . The literature on systemic risk has differ-
ent approaches. One approach is market indicators as a measure of risk. Huang et al. (2011) study
individual contributions of banks to system-wide risk with default probability, institution size and asset
correlation, and recommend surcharge policy for systemically important financial institutions (SIFI’s).
Acharya (2009) models systemic risk as correlation of returns on assets that are held by banks by con-
sidering the market level impact of investment choices of individual banks. The level of market liquidity
is also a key parameter for systemic crisis. Acharya et al. (2010) provide an example of liquidation
costs in the market. Acharya and Merrouche (2010) analyse bank demand for liquidity and its effects
in the interbank market during the period of crisis. They conclude how liquidity hoarding ends in a
decreased volume of interbank market by using 2007-08 crisis data. Acharya and Skeie (2011) relate
financial crises to decreased volume of transactions, and explain it by modelling precautionary hoarding
of banks. They conclude that illiquidity of assets gives rise to low volumes in stress periods and finally
markets can completely freeze. Gai, Haldane and Kapadia (2011) provide a model of liquidity crisis with
hoarding and haircuts. As a benchmark, in the context of 2007-08 crisis, they show how the complex-
ity and concentration affect the contagious process. Another strand of literature focuses on the role of
leverage on systemic risk. Acharya et al. (2010) focus on the conflicting effects of leverage: improving
liquidation of the market and potential risks inherited to the system. Another type of studies on the
effect of liquidity on crisis includes haircuts. Gorton and Metrick (2010) reveal the evidence for increased
haircuts during the 2007-09 crisis, with the banking panic, which increases borrowing costs and makes
access to credit harder. It is not a financial shock which gives rise to a one jump in haircuts, but it is a
cycle through which haircut values increase. They argue that first stage shock and bad news following it
may start the cycle and a loss of confidence makes market liquidity dry and market freeze. Moro (2013)
is another study focusing on this fact. During the ongoing financial crisis, depositors even apply greater
haircuts on collaterals to allay their concerns about the default of their counterparties. Chapman et al.
(2011) present a model of central bank collateralized lending and get optimal haircut settings. Ghosal
et al. (2010) is on sovereign debt restructuring and size of haircuts. Their analysis suggest that there
is a correlation between delay length and size of haircut. Longworth (2010) argue about the the market
failure in the setting of haircuts has led to an deterioration of both the financial boom of the last decade
and the financial bust. He mentions about over-fluctuations that haircuts had been squeezed in the boom
and then rose dramatically during the period of crisis. He explains the spiral triggered by a lower market
liquidity and higher volatility. The cycle results in higher haircuts, which, at the end, gives rise to much
lower liquidity in the market. Since the trend of haircuts follows the financial cycle, they have procyclical
characteristics, and when market has liquidity losses, it makes the liquidity even lower.
    Another approach is to use network measures to identify SIFI’s. Hu et al. (2010) and Soramäki and
Cook (2013) develop different algorithms for the purpose. Simulation based network studies investigate
the role of interbank network as absorber or amplifier of the risk. Kuzubaş et al. (2014), in a balance
sheet based network model, investigate systemic impacts of network connectivity for heterogeneously
levered banks in the context of Nier et al. (2007). Iori et al. (2003) and Montagna and Lux (2012)
construct balance sheet based models in order to investigate the relation between network topology and
systemic risk. Iori et al. (2006) study banking systems with both homogeneous and heterogeneous banks.
    1
    See Hoggarth, Reis and Saporta (2002), Kapp and Vega (2012), Dijk and Mathijs (2013) and Goodman and Mance
(2011) for detailed analyses of costs of systemic financial crises.

                                                      2
Gai et al. (2012) produce policy recommendations on the architecture of network. Jo (2012) extends
to the network analysis in Chan-Lau (2010) linking liquidity risk and solvency risk and infers policy
recommendations for Basel requirements. Haldane et al. (2009) discuss the role of complexity and con-
centration, concluding the interconnections among institutions may act as amplifier or absorber for the
risk depending on the level of connectivity. Eisenberg and Noe (2001) and Diamond and Dybvig (1983)
include market dynamics in model based studies. Gleeson et al. (2011) propose a method for calculating
the expected size of contagion in the contexts of Nier et al. and Gai and Kapadia (2010). Ex-post descrip-
tive analysis of interbank networks is also useful to explore the feature of real-world financial systems2 .
Most of the studies using real-world networks of financial systems concludes that a few institutions have
relatively large number of linkages, thus financial networks, rather than being uniform, have scale-free
characteristics.
     In an interbank money market, in which financial institutions establish lending and borrowing rela-
tions, an idiosyncratic or/and systematic haircut shock hitting a bank in the system may be amplified
and spread over the entire system via liquidity hoarding of banks based on their balance sheet positions.
Even if an idiosyncratic shock may put only a bank in stress in its liquidity position in the first stage,
hoarding of the stressed bank may cause other banks to have shortages in liquidity, and they may be
forced to hoard their interbank assets, too. Thus, interbank lending linkages are an important channel
in a systemic liquidity crisis, which spreads from lender to borrower through the system. Moreover, a
first shock hitting a bank (or more) may cause a loss in confidence, start a banking panic and give rise
to the cycle of increases in haircuts, which ends in further loss of interbank funding of banks. As well as
hoarding, this may be the second channel of the risk inherited to the system. Resilience of the system
is measured by the amount of the systemic impacts of liquidity shock, that is, the contagion of liquidity
shortages. Balance sheet and network positions of banks, endogenous level of panic and perceived risk
in the system, and the topology and concentration of the network are both crucial aspects of financial
stability in liquidity crises. Therefore a model for banking system should take these features into account.
     In this paper, I introduce endogenously dynamic haircuts into a balance sheet based network model
of systemic liquidity crisis, which is missing in the previous literature. In the context of Gai, Haldane
and Kapadia (2011(, I endogenize haircuts for the period of crisis by considering Gorton and Metrick
(2010). They give the evidence about the haircuts that haircuts increase in the period of stress. They
show the trend how they increase during the recent 2007-09 crisis. Their findings suggest that 2007-09
financial crisis was a banking panic. Since repo haircuts are determined by agents in the market and
open to change, when participants are not ignorant, there may be increases in haircut levels, especially
followed by bad news, and financial institutions cannot finance themselves after a threshold. I try to
mimic time varying and procyclical characteristics of haircuts for the period of crisis. I incorporate this
type of endogenous and dynamic modelling of haircuts into the benchmark model. By considering the
evidence, my extension makes the benchmark model in Gai, Haldane and Kapadia (2011) more realistic.
I use same parameter values and as in the benchmark case in order to be comparable with their results.
The benchmark article interpret an event as ”systemic liquidity crisis” if 10% or more of banks have to
withdraw their interbank assets. To be more complete and comprehensible, I use number of banks that
have to hoard as the systemic risk measure. This new measure illustrates the exact difference between
dynamic and static haircuts. Following the benchmark article, both random and geometric networks
are analysed. By performing simulations in Monte Carlo framework, I compare my findings with the
static haircut case for each experiment, and I extend policy experiments on liquidity requirements. I
    2
      See Kuzubaş et al. (2013) for a descriptive analysis of Turkish 2001 banking crisis, Arnold et al. (2006) for the US
market, Benitez et al. (2012) for Mexican banking system, Puhr et al. (2012) for Austrian interbank market and Caldarelli
et al. (2007) for an analysis of Italian overnight money market

                                                            3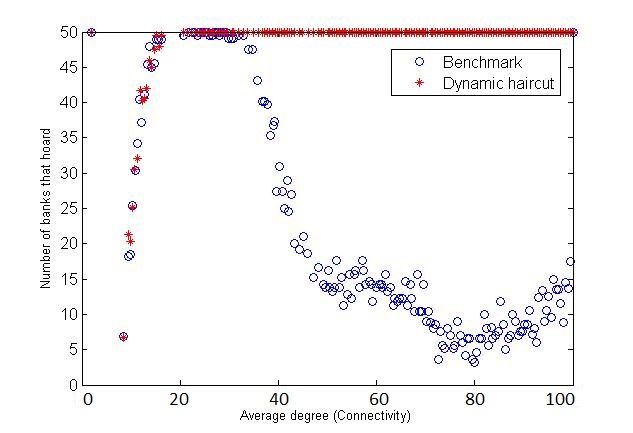
change the minimum requirements and amount of surcharge by keeping overall level of liquidity constant
in order to see the effect of liquidity distribution and bank characteristics on liquidity crisis. As in Gai,
Haldane and Kapadia (2011), I focus on both the idiosyncratic haircut shocks to a randomly chosen
bank, and a combined shock with a systematic haircut increase, and explore the change on the tipping
points of network, that is, the role of network complexity and concentration in the resilience of the system
against a liquidity crisis. Another question in the article is what if, instead random shocks, the most
interconnected lender bank is hit by a targeted shock. I extend benchmark experiment by adding also
least connected lender in order to see the effect of network positions of shocked bank more clearly. The
systemic impact of shocks for different asset and liability compositions and volume of interbank market
are also investigated. Since there may be correlations of returns on assets of some banks in the system, I
also apply a multiple shock procedure arising from high correlation of assets of several banks which invest
closely correlated assets3 . This type of shock hitting several banks at a time is between system-wide
and idiosyncratic shocks. I give shock to 10% of banks at the same time, and detect the results, which
is ignored in the previous simulation based studies. The policy experiment on liquidity suggests some
to-the-point policy recommendations for higher minimum requirements with lower liquidity surcharge for
the same system-wide liquidity level. I observe how a constant haircut framework underestimates the
systemic impacts of haircut shocks and how results significantly differ from a constant haircut framework
for each experiment.
    In section 2, I introduce the model and define environment. In section 3, simulation, experiments and
following policy implications are illustrated and discussed. Finally Section 4 concludes.

2        Theoretical Framework
    In this study, I have extended Gai, Haldane, Kapadia (2011) by introducing dynamic and endogenous
haircuts into the period of crisis. They construct an interbank money market network model with N
institutions with balance sheets given as in Table 1:

                                           Balance Sheet of Bank i
              Total Assets(Ai )                        Total Liabilities(Li )
                                F
              Fixed Assets (Ai )                       Retail Deposits (Li D )
                                    C
              Collateral Assets (Ai )                  Capital (Ki )
                                 RR
              Reverse Repo (Ai )                       Unsecured Interbank Liabilities (Li IB )
                                            IB
              Unsecured Interbank Assets (Ai )         Repo (Li R )
                                L
              Liquid Assets(Ai )

    Balance sheet identity of bank i is given by Li = Ai ∀i = 1...N. In the model, fully liquid assets
are assumed to be used as collateral to obtain repo funding without any haircut, or sold without any
discount in price, whereas fixed assets and unsecured interbank assets cannot be used as collateral for
repo financing. Aggregate haircut, h ∈ [0, 1], is associated with using collateral assets to get repo funding.
It reflects perceived risk of lender of the bank for the collateral of the borrower and protects the lender
against losses arising from counterparty default. They also use bank specific haircut, hi ∈ [0, 1], which is
associated with the specific risk of any bank in the system. As a result, maximum repo funding can be

    3
        See Acharya (2009).

                                                       4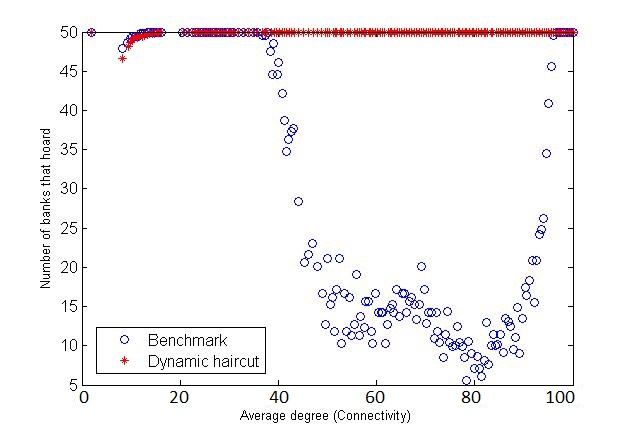
obtained from collateral assets is (1 − h − hi )Ai C . In addition, amount of collateral by reverse repo assets
is Ai RR /(1 − h), thus maximum repo funding by rehypothecating collateral is (1 − h − hi )Ai RR /(1 − h).
A bank is liquid if total amount of its collateral assets for repo funding plus its new unsecured borrowing
from interbank market, Li N , exceeds existing repo funding and a liquidity shock ei or possible interbank
fund losses arising from hoarding behavior of its lenders. Hoarding makes the network effect on liquidity
crisis central. If µi fraction of the lenders of bank i withdraws λ portion of their interbank lendings
from the bank, bank i may face an interbank funding loss in the amount of µi λLIB      i . Thus, the liquidity
constraint is4

                                             (1 − h − hi )Ai RR
                Ai L + (1 − h − hi )Ai C +                      + Li N − Li R − λi µi Li IB − ei ≥ 0                 (1)
                                                  (1 − h)

    where Li N is new unsecured borrowing5 .

2.1    Balance Sheet Construction and Shock Transmission
    The liability side of balance sheets are given homogeneously for all banks. Asset size is given exoge-
nously except Ai IB and Ai F . After network is constructed, Li IB for banks are distributed evenly among
their lenders. Through this way, interbank assets are drawn endogenously via network. Finally, according
the Ai IB , Ai F values are determined. At the end, total interbank liabilities are equal to total interbank
borrowing in the interbank money market6 . That is,
                                                 N
                                                 X             N
                                                               X
                                                       LIB
                                                        i =          AIB
                                                                      i                                              (2)
                                                 i=1           i=1

    As in the benchmark article, I introduce a liquidity shock which measn an increase in idiosyncratic
haircut (hi ) and it wipes out some amount of repo funding of bank i. In some experiments, it is given to
a randomly chosen bank, whereas, for geometric network I also shock the bank which has the maximum
and numbers of lending links in the system. I also incorporate aggregate haircut shock, an increase in h
with idiosyncratic shock. All banks at initial state use all of their collateral assets to get repo funding.
That is, at the initial state,

                                                                 (1 − h − hi )Ai RR
                                   Li R = (1 − h − hi )Ai C +                                                        (3)
                                                                      (1 − h)

    At the first step, after an idiosyncratic haircut shock hits a bank (or a system-wide haircut shock hits
all banks), it losses some percentage of its repo funding with existing collaterals. If its repo financing
(including liquid assets) cannot meet its repo borrowing7 , Li R , as a defensive action, it is forced to
withdraw its interbank assets from its borrowers. Thus its borrowers lose interbank funding by hoarding
of their lender. If one or more of these borrowers face a liquidity shortage in their liquidity constraint, it
also has to hoard its interbank assets from its own borrowers. This domino effects spreads from lender to

   4
      To be comparable with benchmark case, I also assume that λ = 1 for each experiment, which means full withdrawing.
   5
      As in Gai, Haldane, Kapadia (2011), it is assumed to be 0.
    6
      Since my aim is to introduce the dynamic haircut, I use same benchmark values as in Gai, Haldane and Kapadia (2011)
for balance sheet components.
    7
      That is, if liquidity constraint falls below zero.

                                                           5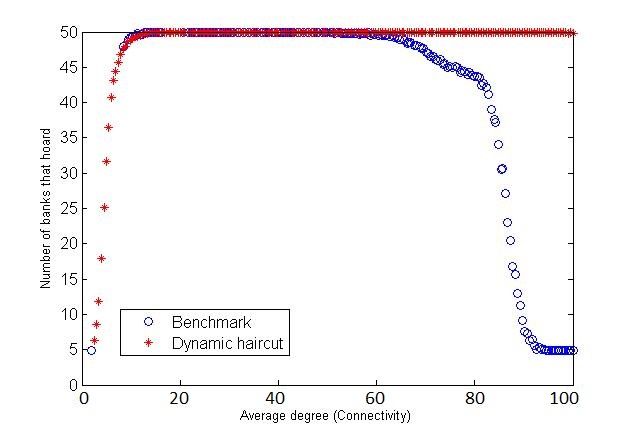
borrower8 . The procedure ends when either all banks have to hoard money or liquidity shock is absorbed
by the liquidity of the banks in some stage9 .
    The haircuts are given exogenously in the benchmark case. I endogenize them using the extent of
systemic impacts of the shock and time dimension of shock spread process. Following the shock, haircuts
increase as more banks have to hoard money. Gorton and Metrick (2010) argue about the bad news
which triggered the 2007-09 crisis by giving rise to increases in repo haircuts during the period. They
started the panic and worsened as more news arrive. The panic ended in increasing repo haircuts which
amplifies the first stage impact of the shock and has severe effects. Hence, it was not an only first stage
shock which lead one jump in haircuts, but it is a persistent process of increases in haircuts. The first
and relatively less effective shock creates a loss in confidence and starts the cycle through which liquidity
in the system dries up. In the procedure, period 1 starts when an exogenous and systematic and/or
idiosyncratic haircut shock hits the system, and ends when banks that have to hoard withdraw their
interbank assets from their borrowers. At the beginning of period 2, some lending links may be broken
by hoarding. Since participants are not ignorant and banking panic starts, they realise the systemic risk
in the system and measure the risk according to the number of banks which face liquidity shortage up to
now10 . In other words, I model the level of panic according to the number of banks that face liquidity
shortage up to that time period. By considering the evidence, I try to mimic the procyclicality and
time-varying features of haircuts in the model. I update haircuts endogenously, using same initial level as
in benchmark plus the endogenous level of perceived panic for the system. After a shock hits the system
at t = 0, the period of stress starts if some banks have to hoard money, and the haircut t time t,
                                                                    St
                                                       ht = 0.1 +                                                          (4)
                                                                    N
where St represents the number of banks that had to hoard money up to period t. Haircut increases
through the rounds if more banks have to hoard as time passes. As bad news arrive about the banks,
haircuts increase in a cycle of panic. Moreover, I update initial bank specific haircut according to the
liquidity position of banks. Instead of a zero bank specific haircut, I endogenize banks specific haircut,
too. If a bank is near to have liquidity shortage11 , its counterparties perceive it more risky and its hi
increases to 0.05. In other words, after news about a specific bank that it has less liquidity and may be
in stress with the next shock, its depositors perceive it as riskier than other banks. As h or hi increases
in a cycle triggered by an initial shock, same amount of collateral gets less funding, i.e. cost of borrowing
increases, since counterparties want to protect themselves more strictly with panic.

2.2    Simulation Procedure
    In this section, I describe the simulation procedure. Given the LIB          R  D         C    RR and AL
                                                                          i , Li , Li , Ki , Ai , Ai        i
values in the balance sheets, I create realisations of directed and unweighted random and geometric
networks. One source of randomness in the model stems from this network structure. It maps the
randomness of asset sides of balance sheets via interbank assets. In order to eliminate noise and differences
in realisations, I create a Monte Carlo framework over 1000 runs of the system with 1000 network
realisations, and I take average values of degree (connectivity) for nodes across realizations of graphs. In
the procedure, the lending links are dynamically updated because of hoarding behavior. In other words,
   8
     Through the procedure I count number of banks which have to hoard
   9
     For model and procedure details, I refer the reader to Gai, Haldane, Kapadia (2011).
  10
     Benchmark article use aggregate haircut as 0.1 for all experiments
  11
     I assume if its overall liquidity goes below 1% of its balance sheet, it is perceived to have greater default probability,
and its lenders may increase its haircut to provide extra protection.

                                                              6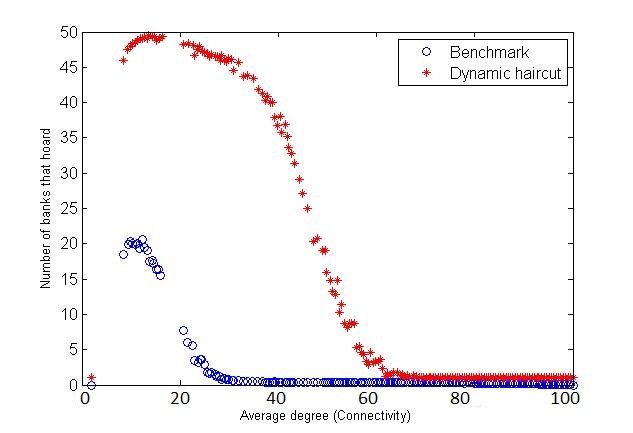
lenders have the priority to break thier lending links to their borrowers and withdraw their interbank
assets if they face shortages in liquidity. This leads to a decrease in the volume of interbank transactions
during the period of crisis12 . Links are not netted 13 .
    In some experiments, a randomly chosen bank (or 10% of banks) faces an idiosyncratic haircut shock
for each specific realisation of network. This is the second source of randomness. In order to eliminate
this, for each realisation of networks, I choose and shock random banks for 50 times, and I take average
number of hoarding banks14 .
    If bank j borrows from bank i in the network realisation, and if it also borrows k other banks in the
interbank market, the amount that bank i lends to bank j is LIB   j /(k + 1). That is, I follow the procedure
of benchmark study which distribute the interbank borrowing for each bank evenly among its interbank
lenders. In this way, having constructed the network, AIB             F
                                                           i (thus Ai ) values are determined endogenously.
Benchmark parameter values are represented in the Table 1:

                                        Summary of benchmark    parameters of the model
    Parameter   Description                                      Benchmark value                               Range
    N           Number of banks in the system                    50                                            Fixed
    LIB
      i         Unsecured interbank liabilities                  15%                                           15% and 25%
    LRi         Repo liabilities                                 20%                                           Fixed
    AIB
      i         Unsecured interbank assets assets                Endogenous by network                         -
    Ki          Capital                                          4%                                            Fixed
    LNi         New unsecured interbank borrowing after shock    0                                             Fixed
    ACi         Collateral assets                                10%                                           Fixed
    AFi         Fixed assets                                     Endogenous by AIBi                            -
    ARR
      i         Reverse repo assets                              11%                                           Fixed
    h           Aggregate haircut                                Endogenous by systematic liquidity shortage   0.1-0.9
    hi          Bank specific haircut                            0                                             0-0.15
    λ           Proportion of deposits withdrawn by hoarding     1                                             Fixed

                                       Table 1: Benchmark parameter values

3        Simulations and Results
    In this section, I illustrate and discuss my results based on simulations.
    I observe, the framework for liquidity crisis which assumes constant haircuts in the period of stress
may underestimate the systemic impacts of liquidity shocks. The gap between dynamic and constant
haircut cases are persistent for most levels of connectivity and different balance sheet and network posi-
tions of banks.
    Since some banks invest same (or highly correlated) assets, a shock may hit several banks in the
system at the same time. In the multiple shock experiment, the system is affected severely for both
dynamic and constant haircut cases. Even less banks are affected for very high level of connectivities

    12
      For evidence to this decrease, see Gorton and Metrick (2010).
    13
      I allow for both lender and borrower linkage for any two banks in the system. Both ij and ji elements of the adjacency
matrix can be 1 at the same realisation of the network. If bank i both lends to bank j and borrows money to bank j, they are
both lender and borrower for each others. They both may hoard their lending from each others and shock may propagate
both form j to i and i to j. Note that in the network, ji element means j lends to i, as a convention for simulations.
   14
      I take averages first for 50 of randomly chosen banks, and 1000 realisation for each of this random bank choice. The
average value of number of banks that hoard over 1000 realisations is taken after the average of 50 shock spread process for
randomly chosen banks.

                                                                7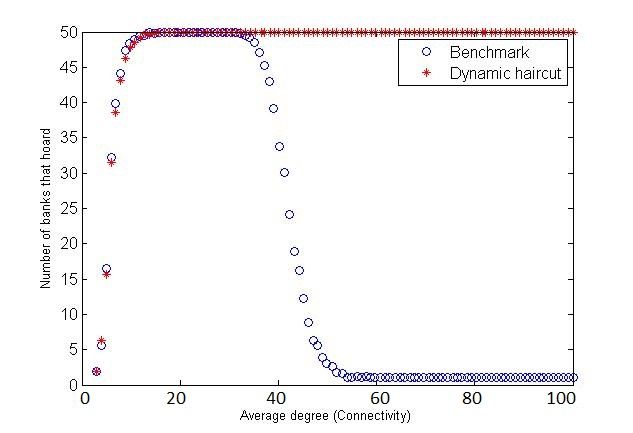
for static haircuts, network topology and connectivity do not make the system more resilient when I
update haircuts. Since the effect of shock is multiplied by the cycle of increasing haircuts in the dynamic
case, the network effect on absorbing the inherited liquidity shortage is not strong enough even for high
connectivity levels.
    If a shock (combined with a systematic haircut shock) hits the most or least connected lender in the
system, for static haircut case, the role of network in absorbing or amplifying the shock changes signifi-
cantly according to the connectivity level. On the other side, when haircuts are dynamically changed, no
turning point for connectivity is observed, system collapses for most levels of connectivity.
    In the case of targeted shocks, since the effect of a combined shock is too high to see the tipping
points of connectivity in the case of dynamic haircuts, I also introduce specific haircut shocks to the
most and least connected lenders. If only a bank specific shock hits the most and the least connected
lenders, the role of network on liquidity crisis gains importance for the dynamic case, too. The trend of
systemic impact with connectivity level is similar for both versions, but there is again a persistent gap in
the number of banks affected. If the least connected lender faces with an idiosyncratic haircut increase,
its effect to the system is significantly lower for low and high level of connectivities when compared with
the case of most connected lender.
    Keeping the total amount of liquid assets same for the whole system, a policy which decreases the
minimum required individual level of liquidity and compensates it by applying a tough surcharge accord-
ing to the volume of individual interbank transactions, changing only the distribution of liquidity with
individual surcharges, may impair the resilience of the system against liquidity shocks. Additionally, no
matter how it is distributed, a higher level of system-wide liquidity makes system more resilient for both
dynamic and static cases.

3.1     Examples from Network Realisations
    Gai, Haldane and Kapadia (2011) state that real-world financial networks do not have a uniform
degree distribution, instead they have fail tail distributions with a small number of players that have
large number of links15 . The simulations for uniformly distributed network are interpreted as benchmark,
whereas fat-tailed geometric network is more suitable for real-world networks. Following Figure 1 and 2
illustrate examples from both of realisations of the two16 and corresponding degrees17 of nodes.

   15
      Boss et al. (2004), Arnold et al. (2007), Caldarelli et al. (2008), Benitez et al. (2012) reveal the evidence from different
interbank markets.
   16
      p=0.2
   17
      The degree of any bank represents its total number of interbank relations including borrowing and lending links.

                                                                8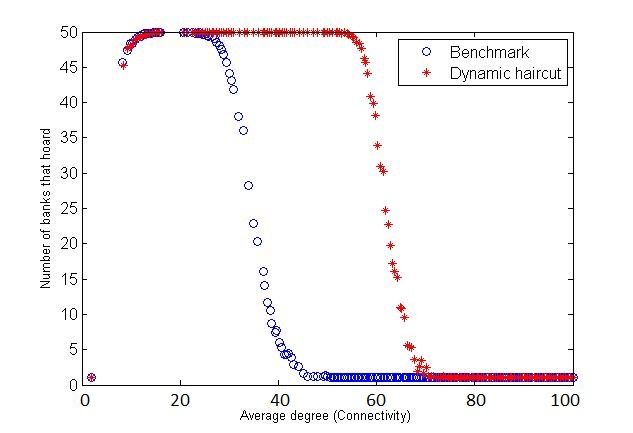
((a)) ((b))
Figure 1: Interbank random network
((a)) ((b))
Figure 2: Interbank geometric network
As can be seen, in a geometric network, the links are not distributed evenly, and a few banks have a
large number of links which mean that they are highly connected when compared to other banks. On the
other side, in a random network, there are no such outliers18 . Geometric network also gives the chance
to select differently connected lenders in the experiments.
18
No node with a degree greater than 30 for this specific realisation.
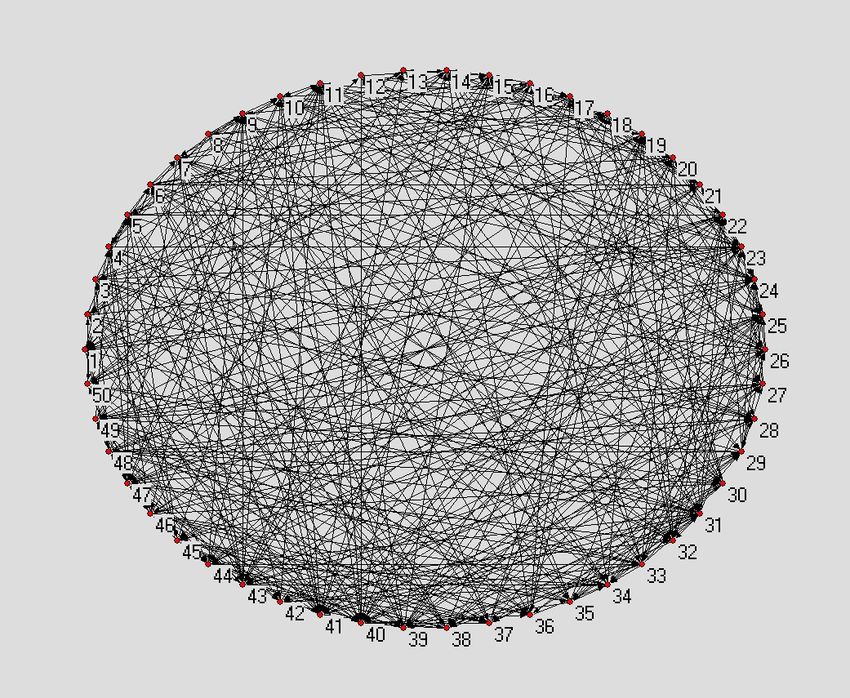
93.2 Random Network
3.2.1 Idiosyncratic and Combined Shocks
((a)) The effect of idiosyncratic shock ((b)) The effect of combined shock
Figure 3: Effects of shocks
In Figure 3(a), a randomly chosen bank faces with a haircut increase, I observe the difference in the
number of banks that have to hoard between benchmark and dynamic haircut cases in each connectivity
levels. For low connectivity levels, the level of crisis does not show much difference, but after a level of
connectivity around 10, dynamic haircuts cause more banks to face liquidity shortage. Approximately
all the banks face liquidity shortage and hoard interbank assets for a large range of connectivity. This
means that volume of interbank market is close to zero because of broken lending links, i.e. interbank
market freezes. In case case of static haircuts, on the other side, shock does not effect all banks in the
system for even the worst situation, and number of banks that hoard goes down earlier. For high level
of connectivity, since I distribute the amount borrowed for a bank among its creditor, all banks enough
many borrowing and lending links to absorb the hoarding behavior some of their lenders. As a result,
systemic impacts of liquidity shock decreases and system becomes more resilient for both dynamic and
static cases19 . In Figure 3(b), an idiosyncratic shock that hits a random bank is combined with a sys-
tematic haircut increase. The results worsen for both cases. The number of banks that have to withdraw
their interbank assets increase and very high for a larger range of connectivity for benchmark case; but
it is devastating for dynamic case. No matter in with level the system is connected, systematic plus
idiosyncratic haircut shock case, system collapses for endogenous haircuts. In this case, increasing level
of connectivity is not enough to absorb the systemic effect of individual liquidity shortages, since bad
news and panic followed by it pulls the haircuts to higher levels and since initial level of aggregate haircut
is already high.
19
The result on the role of connectivity on systemic risk is consistent with Kuzubaş, Saltoğlu and Sever (2014).
103.3 Geometric Network
In this section, the links in the system are not distributed evenly, instead, geometric distribution i
chosen and some banks are expected to have higher number of links20 .
3.3.1 Idiosyncratic and Combined Shocks
((a)) The effect of idiosyncratic shock ((b)) The effect of combined shock
Figure 4: Effects of shocks
In Figure 4(a), a random bank is by an idiosyncratic shock, whereas in Figure 4(b), an idiosyncratic
shock to a randomly chosen bank is combined with a systematic haircut shock, I observe similar results as
in random network for both cases. Even the trends for the role of connectivity in absorbing or amplifying
the shock are similar for both types of networks, the main distinction is that geometric network acts as
a stronger absorber of the shock with a decrease in the number of banks that have to hoard.
3.3.2 Multiple Shock
In this experiment, I introduce a series of multiple idiosyncratic shock to randomly chosen banks. A
systematic shock is modelled as system-wide haircut increase in the model, whereas idiosyncratic shocks
are represented as an increase in bank specific haircuts. Between the two types of shocks, because of
close characteristics of asset sides of banks, there may be shock that hit several, but not all, banks in
the network. I choose 10% of banks randomly and hit them by shock. In this case, for connectivity
levels up to 60, we do not observe a difference between dynamic and static haircut cases, for both all
banks have liquidity shortages and system collapse. After this turning point, the network connectivity
starts to absorb the risk inherited to the system for static case, whereas it does not have such a strong
effect for dynamic case which still gives rise to the collapse of all system. For the most connected case,
where connectivity is 100, the levels of crisis is highly different between 2 cases. As mentioned in Acharya
(2009), this multiple shock may mimic the fact that banks may invest same (or highly correlated) assets,
thus a shock that hits these of kind of assets may harm several banks at a time in the system. This may
be a comprehensive analysis to foresee the systemic effects of real-world shocks.
20
Gai, Haldane and Kapadia (2011) use random network as benchmark, and since geometric network is better to mimic
real world financial systems, they conduct experiments with geometric networks. I follow the same pattern.
11Figure 5: Effect of multiple shock
3.3.3 Volume of Interbank Market
Figure 6: Effect of LIB
i
Figure 8 represents the results for a different liability21 composition of banks in the case of an id-
iosyncratic haircut increase for a randomly chosen bank. Following the benchmark article, I increase the
average volume of interbank transaction to 25% in the balance sheets of banks22 . In this case, I have
applied only an idiosyncratic haircut shock to a randomly chosen bank, thus the result is comparable
with Figure 5. By comparing the two, I observe that the increase in the size of interbank money market
makes the system more fragile for a wider range of connectivity level for both dynamic and static cases.
When banks borrow and lend higher amounts in interbank money market, the borrowers will be affected
severely when a creditor hoards its money from them, since the amount of their losses are greater. Thus,
21
Since interbank assets of banks are determined endogenously via network, higher interbank liability for all banks maps
to higher interbank assets for whole system.
N N
22
AIB LIB
P P
When I increase interbank liabilities to this level, since i = i , even if interbank assets are distributed
i=1 i=1
heterogeneously, average value of interbank assets will increase 25% for the system.
12for a larger range of connectivity, the banks are more vulnerable to the losses of their interbank funding.
On the other hand, for very high level of connectivities, it is still resilient against liquidity shocks. In
this case, th connectivity threshold where liquidity shortage can be absorbed by the network is higher,
since the shortage inherited to the system by any bank is larger and it loses its effects when a borrower
borrows money from many lenders, which is higher than Figure 5.
3.3.4 Combined Shocks to Target Banks
For following two experiments, an idiosyncratic shock given to a random banks is combined with an
aggregate haircut increase.
((a)) The most connected lender ((b)) The least connected lender
Figure 7: Effect of a combined shock to target banks
In Figure 7(a), for each realisation of geometric network, following the benchmark article, I choose
the bank which has highest number of lending relationships and hit it by an idiosyncratic shock with
a combined aggregate haircut shock. Since it is the bank which may potentially pass liquidity crisis to
the largest number of banks in the system, the shock has severe effects. It is comparable with Figure
4(b), and I see that the absorbing effect of increasing connectivity levels are not that clear in this case
for static haircuts. It first decreases then fluctuates, but amplifies the shock sharply for very high level of
connectivity. Figure 7(b) illustrates the results when I hit the bank with lowest lending links. Although
I observe same pattern for both cases, for Figure 7(b) in static framework, after connectivity level of 80,
we do not observe such an increase in number of banks that hoard. Even in high levels of connectivity,
since it is the bank with lowest number of borrowers and its borrowers has lent money from many other
lenders, a shock spreading from it may be absorbed in highly connected networks. Since the level of shock
is too high for dynamic case, in order to observe tipping points of the network for dynamic case too, next
section illustrates the results when only idiosyncratic shock hits the system.
3.3.5 Idiosyncratic Shocks to Target Banks
Figure 8 represents the results for an idiosyncratic shock hitting the lenders with most and least
number of lending links in the system.
13((a)) The most connected lender ((b)) The least connected lender
Figure 8: Effect of an idiosyncratic shock to target banks
Figure 8 is comparable with Figure 4(a) which represents the results when a bank randomly chosen
and hit by an idiosyncratic shock. In both 8(a) and 8(b), the role of network on systemic crisis follows
the similar pattern for both dynamic and static cases. The main difference is in the higher and lower
levels of connectivity. A shock to the most connected lender create severe results when compared with a
shock to the least connected one, especially for these connectivities. The gap for the dynamic and static
frameworks is again persistent and static haircut model may underestimate the number of banks that
have to hoard.
3.3.6 Policy Recommendations on Liquidity Requirements
In this section, the system is by an increase in aggregate haircut and a randomly chosen bank receives
a haircut shock. In the first figure, a strict minimum liquidity requirement, 3.5%, is applied for all banks.
For the second experiment, minimum requirement is decreased to 2% of balance sheet for liquid assets,
but a liquidity surcharge policy is conducted in order to keep the overall liquidity level in the system
constant for all cases. All banks have to keep an additional amount of 10% of their interbank assets
as liquid, in the form of Ai L . Thirdly, minimum liquidity rule is even reduced to 1%, but again with
the same purpose, 16.3% of the interbank assets are required to be kept as liquid. Finally the values
are 1% and 20%23 . I extend the experiment in the benchmark article to see the effect of minimum
requirement more clearly. The reason why I conduct experiments even with more reduced minimum
requirements up to 0.5% is to analyse the effect of liquidity distribution over banks in the case of same
levels for system-wide liquidity. Lower minimum requirements with tough surcharge policies according
to the volume of individual transactions in interbank market versus higher minimum requirements with
softer (or no) surcharge policies are analysed. The following four experiments show the implications of
these two patterns in policy making.
23
A strict minimum liquidity require the 3.5% of total assets to be liquid for all banks, whereas other three experiments
changes the distribution of liquidity and creates differently liquid banks. Note that all four experiments keep the overall
level of liquidity same for the system. Since AIB
i is 15% for the system, for both cases, 3.5% of total assets are liquid.
14(a) Minimum requirement: 3.5% (b) Minimum requirement: 2%
(c) Minimum requirement: 1% (d) Minimum requirement: 0.5%
Figure 9: Policy experiments on liquidity requirements
In Figure 9, from first to fourth policy experiment, I observe, for both dynamic and static cases, the
extent of crisis increases as the distribution of liquidity becomes more asymmetric among banks. Although
system-w,de level of liquidity is same, as minimum requirement is decreased and a surcharge policy is
applied, there are banks with low and high individual liquidity levels, and ystemic impact of liquidity
shock worsens. It becomes harder to absorb the shock. That is because, when minimum requirement is
low, there are some vulnerable banks which may face liquidity shortage easily and starts the cycle of stress
by hoarding. Their hoarding behavior first makes other banks lose their interbank funds, and secondly
for dynamic case, gives rise the cycle of increases in haircuts. I also note that even the lower minimum
liquidity requirement makes system more vulnerable for both cases, the effect of minimum requirement
is more clear for dynamic case, since the vulnerable banks may easily give rise to the cycle of increasing
haircuts as a second channel of crisis. The lowest minimum level, despite the fact that total liquid assets
are same in the system on average, gives rise to worse results. I conclude that a tough and uniform level
of liquidity requirement may be more useful when compared with low minimum liquidity requirement
with aggressive surcharge policy. In addition, when compared with Figure 4(b), if overall level of liquidity
is higher in the system, even if it is distributed asymmetrically among banks, system is more resilient. A
tough macroprudential regulation improves the strength of the financial network.
154 Conclusion
In recent years, systemic risk, meaning contagious threat on liquidity shortages for whole financial
system triggered from lenders to borrowers has drawn significant attention from the literature. Intro-
ducing time varying and procyclical trend of haircuts in crisis periods, I try to construct a more realistic
framework of liquidity crisis. To the best of my knowledge, this study is the first attempt to endogenize
haircuts in a balance sheet based network model of liquidity crisis. It gives a room for more accurate
predictions of the extent of crisis and to see the effect of dynamic haircuts by comparing with the static
case. I repeat all the experiments of benchmark case in also dynamic contexts. I also extend the ex-
periments of benchmark article. Firstly, target shock is also given the least connected lender, as well
as the most connected one, in order to see the effect of the network position of the shocked bank more
clearly. As a measure, I count number of banks that have to hoard, instead of count ”systemic liquidity
crisis” events. This measure is more complete and allows me to see the gap between dynamic and static
cases. I broaden the policy experiments on liquidity requirements in order to observe the effect of tough
minimum requirement and surcharge policies on liquidity crisis more clearly. By considering Acharya
(2009), I conduct an experiment in which several banks are hit by the shock at the same time. This is
also an attempt to get more realistic results. Since evidence suggest that the assumption of constant
haircuts during the crisis is unrealistic, a model using static haircuts may underestimate the impacts of
all types of haircut shocks. Through the experiments, I observe that the gap between dynamic and con-
stant haircut cases are persistent different network connectivities and topologies, as well as for different
balance sheet and network positions of banks. My extension on haircuts is an attempt to model the
banking panic endogenously and the results mimic the reduction of the volume of interbank market and
decreasing interbank lending relationships for the crisis. Moreover, the experiment by multiple shocks
for 10% of banks may help to predict the effect of shocks that hit potentially correlated assets of banks.
For both dynamic and constant haircut cases, a multiple shock affects the system severely. I observe, less
banks are affected for very high level of connectivities for static case, since the systemic impacts of shock
is too large to absorb, network topology and connectivity do not have significant effects for dynamic case.
In order to see the effect of connectedness of the lender that is hit by the shock, other than randomly
chosen banks, I give a combined (aggregate plus idiosyncratic) and idiosyncratic shocks to the most and
least connected lenders in the system. If an idiosyncratic shock hits these lenders, for static case, the role
of network in absorbing or amplifying the systemic risk changes significantly by the connectivity. On the
other hand, when haircuts are procyclical, no turning point in the role of connectivity is observed, system
collapses for most connectivity levels, since the consequences of shock is too high for dynamic case to
absorb. Secondly, an idiosyncratic shock is given to same banks in order to see the effect of connectivity
for the dynamic case, too. Since the amount of shock is less, it is possible to track the tipping points
for dynamic haircut case also. If the most connected lender receives the shock, the role of network on
crisis changes significantly, with connectivity, for both dynamic and static cases. The trend of systemic
impact with connectivity level is similar for both versions of haircuts, but there is again a persistent gap
in banks affected. If the least connected lender faces a bank specific haircut increase, especially for low
and high levels of connectivity, its effect to the system is significantly low, when compared with the most
connected lender case. The aim for policy experiments is to measure the effect of bank and system-wide
liquidity policies on the systemic liquidity crisis. Keeping the total amount of liquid assets same for
banking system, a tough policy with high liquidity requirement for all banks makes system more resilient.
The microprudential policy which decreases the minimum required level of liquidity, and compensates
it by applying a tough surcharge related to interbank assets of banks, may impair the resilience of the
system. In addition, a macroprudential policy of high level system-wide liquidity, no matter what is the
16microprudential regulation, makes system more resilient, when compared with the low level of overall
liquidity. This study, as a attempt for the combination of time varying haircuts into a liquidity crisis
framework, can be taken as a benchmark. The results may also produce policy recommendations for
BASEL III.
5 References
Acharya V. V. and Skeie D. R., 2011, ’A Model of Liquidity Hoarding and Term Premia in Inter-Bank
Markets’, FRB of New York Staff Report No. 498.
Acharya V. V. and Gale D. M., Yorulmazer T., 2010, ’Rollover Risk and Market Freezes’, EFA, Bergen
Meetings Paper.
Acharya V.V., Mehran H. and Thakor A., 2010, ’Caught Between Scylla and Charybdis? Regulating
Bank Leverage When There Is Rent Seeking and Risk Shifting’, Federal Reserve Bank of New York Staff
Report No.469
Acharya V. and Merrouche O., 2010, ’Precautionary Hoarding of Liquidity and Inter-Bank Markets:
Evidence from the Sub-Prime Crisis’. NYU Working Paper No. FIN-09-018
Acharya V. V., Pedersen, L.H., Philippon, T. and Richardson M. P., 2010, ’Measuring Systemic Risk’,
AFA 2011, Denver Meetings Paper.
Acharya V.V., 2009, ’A theory of systemic risk and design of prudential bank regulation’, Journal of
Financial Stability, Forthcoming
Adrian T. and Shin H.S., 2008, ’Liquidity and financial cycles’, Bank for International Settlements,
BIS Working Papers 256.
Boss M., Elsinger H., Summer M. and Thurner S., 2004 ’Network topology of the interbank market’,
Quantitative Finance, 4:6, pp. 677-684
Chan-Lau J.A., 2010, ’Regulatory Capital Charges for Too-Connected-to-Fail Institutions: A Practi-
cal Proposal’, IMF Working Paper 10/98
Chapman J., Chiu J. and Molico M. 2010, ’Central Bank Haircut Policy’, Bank of Canada, Working
Paper 2010-23
Degryse H. and Nguyen G., 2004, ’ Interbank Exposures: An Empirical Examination of System Risk
in the Belgian Banking System’, Working Paper Nationale Bank van Belgi, no.43.
Diamond D. and Dybvig P., 1983, ’ Bank Runs, Deposit Insurance and Liquidity ’, Journal of Political
Economy, no. 91 (3), pp. 401-419.
Dijk M.A.V. and Mathijs A., 2013, ’The Social Costs of Financial Crises’, Available at SSRN:
ssrn.com/abstract=2278526
Eisenberg L., Noe T.H., 2001, ’Systemic Risk in Financial Systems’, Management Science, Vol. 47,
no. 2, Pages:236-249.
Erlend N., Yang J., Yorulmazer T. and Alentorn A., 2007, ’Network Models and Financial stability’,
Journal of Economic Dynamics Control, vol.31, pp 2033-2060.
Gai P. and Kapadia S., 2010, ’Contagion in Financial Networks’, Proc. R. Soc. A, 466 (2120) 2401-
2423.
Gai P., Anand K., Kapadia S., Brennan S. and Willison M., 2012, A Network Model of Financial
System Resilience, Journal of Economic Behavior and Organization, forthcoming
Gai P., Anand K., Marsili M., 2012, Rollover Risk, Network Structure and Systemic Financial Crises,
Journal of Economic Dynamics and Control, forthcoming
17Gai P., Haldane A. and Kapadia S., 2011, ’Complexity, Concentration and Contagion’, Journal of
Monetary Economics, Volume 58, Issue 5, July, Pages: 453-470.
Ghosal S., Miller M. and Thampanishvong K., 2010, ’Delay and Haircuts in Sovereign Debt: Recovery
and Sustainability’, University of St. Andrews, Discussion Paper Series 1004
Goodman J.C and Mance S.M., 2011, ’Employment loss and the 2007-09 recession: an overview’,
Monthly Labor Review, April 2011, Available at bls.gov/opub/mlr/2011/04/art1full.pdf
Gorton G. and Metrick A., 2010, ’Haircuts’, Federal Reserve Bank of St. Louis Review, Novem-
ber/December 2010, 92(6), pp. 507-19.
Haldane A. G., 2009, ’Rethinking the Financial Network’, Bank of England.
Hoggarth G., Reis R. and Saporta V., 2001, ’Costs of Banking System Instability: Some Empirical
Evidence’, EFA 2001 Barcelona Meetings, Bank of England Working Paper No. 144.
Huang X., Zhou H. and Zhu H., 2011, ’Systemic Risk Contributions’
Iori G., Jafarey S. and Padilla F., 2003, ’Interbank Lending, Reserve Requirements and Systemic
Risk: Modeling, Computing, and Mastering Complexity’, Society for Computational Economics, 17
Iori G., Masi G.D., Precup O.V., Gabbid G. and Caldarelli G., 2007, ’A Network Analysis of the
Italian Overnight Money Market’, Journal of Economic Dynamics Control, vol. 32, pp. 259â“278.
Iori G., Jafarey S. and Padilla F.G., 2006, ’Systemic Risk on the Interbank Market’,Journal of Eco-
nomic Behavior and Organization, vol. 61, pp. 525-542.
Jaramillo M., Kabadjova S., Benitez B., Margain B. and Pablo J., 2012, ’An Empirical Study of the
Mexican Banking System’s Network and Its Implications for Systemic Risk’, Bank of Mexico, Working
Paper No. 2012-07.
Jo H.J., 2012, ’Managing systemic risk from the perspective of the financial network under macroe-
conomic distress’ , Financial Stability Institute
Kapp, D. and Vega M., 2012, ’Real Output Costs of Financial Crises: A Loss Distribution Approach’,
MPRA Paper 35706, University Library of Munich, Germany
Kuzubaş T.U, Omercikoğlu I. and Saltoğlu B., 2013, ’Network Centrality Measures and Systemic
Risk: An Application to the Turkish Financial Crisis’, Boğazici University Working Papers.
Longworth D., 2010, ’Warding Off Financial Market Failure: How to Avoid Squeezed Margins and
Bad Haircuts’, C.D. Howe Institute Backgrounder 12/2010
May R.M. and Arinaminpathy N., 2010, ’Systemic risk: the dynamics of model banking systems’, J
R Soc Interface, Vol:7, 1742-5689, Pages:823-838.
Montagna M. and Lux T., 2013, ’Hubs and resilience: towards more realistic models of the interbank
markets’, Kiel Institute for the World Economy, Working Paper, No:1826.
Moro B., 2013, ’The Run on Repo and the Liquidity Shortage Problems of the Current Global Fi-
nancial Crisis: Europe vs US’, Ekonomi-tek, Forthcoming
Puhr C., Seliger R. and Sigmund M., 2011, ’Contagiousness and Vulnerability in the Austrian Inter-
bank Market’, Austrian Central Bank, Financial Stability Report.
Soramäki K., Bech M.L., Arnold J., Glass R.J., Beyeler W., 2006, The topology of interbank payment
flows’, Federal Reserve Bank of New York, Staff Reports 243.
Soramäki K. and Cook S., 2013, ’Algorithm for Identifying Systemically Important Banks in Payment
Systems’, Economics: The Open-Access, Open-Assessment E-Journal, Vol. 7, 2013-28
18You can also read