Reliable Multilane Detection and Classification by Utilizing CNN as a Regression Network - WHITE PAPER www.visteon.com
←
→
Page content transcription
If your browser does not render page correctly, please read the page content below
WHITE PAPER
                www.visteon.com

Reliable Multilane
Detection and
Classification by Utilizing
CNN as a Regression
Network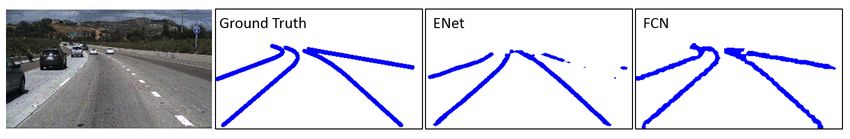
Reliable multilane detection and classification by
     utilizing CNN as a regression network

    Shriyash Chougule1 , Nora Koznek2 , Asad Ismail2 , Ganesh Adam1 , Vikram
                         Narayan2 and Matthias Schulze2
        1
          Visteon Corporation, Pune, India {schougu1, gadam}@visteon.com
                    2
                      Visteon Corporation, karlsruhe, Germany
     {nkozone2, aismail2, vikram.narayan, matthias.schulze}@visteon.com

        Abstract. Reliable lane detection is crucial functionality for autonomo-
        us driving. Additionally positional information of ego lanes and side lanes
        is pivotal for critical tasks like overtaking assistants and path planning. In
        this work we present a CNN based regression approach for detecting mul-
        tiple lanes as well as positionally classifying them. Present deep learning
        approaches for lane detection are inherently CNN semantic segmenta-
        tion networks, which concentrate on classifying each pixel correctly and
        require post processing operations to infer lane information. We iden-
        tify that such segmentation approach is not effective for detecting thin
        and elongated lane boundaries, which occupy relatively few pixels in the
        scene and is often occluded by vehicles. We pose the lane detection and
        classification problem as CNN regression task, which relaxes per pixel
        classification requirement to a few points along lane boundary. Our net-
        works has better accuracy than the recent CNN based segmentation so-
        lution, and does not require any post processing or tracking operations.
        Particularly we observe improved robustness in occlusions and amidst
        shadows due to over bridge and trees. We have validated the network
        on our test vehicle using Nvidia’s PX2 platform, where we observe a
        promising performance of 25 FPS.

        Keywords: Multilane detection, CNN regression, Multilane classifica-
        tion

1     Introduction

Advanced Driver Assistance Systems (ADAS) have been proven to be effective
in reducing vehicle accidents and minimizing driver injury risks [2]. Hence in
recent time, ADAS system are being rapidly adopted in modern cars [1]. Au-
tonomous navigation is most desired functionality among the driver assistance
functions offered by ADAS, which in turn is highly dependent on reliable and
accurate lane detection. Information of ego lane and side lane is also crucial
for other driving assistance tasks like lane keeping, lane departure warning and
overtaking assistance. Camera sensor has been used extensively for lane detec-
tion task, and has been a low cost solution over costly LiDAR sensors. Although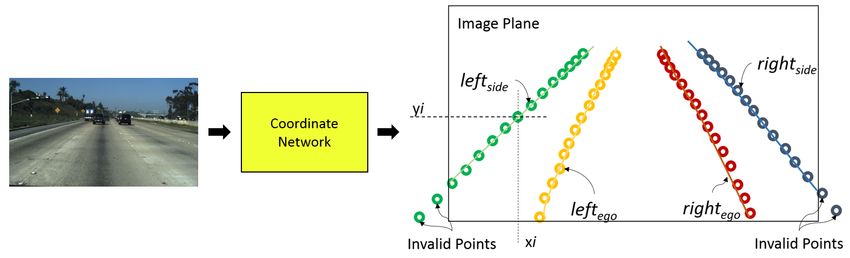
2 S. Chougule, N. Koznek, A. Ismail, G. Adam, V. Narayan, M. Schulze
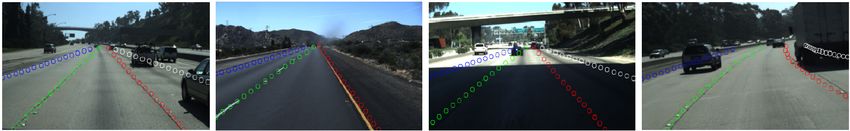
Fig. 1. Example of multilane detection and classification by our network, where the
output is in the form of lane boundary image coordinates represented by small color
circles (best viewed on computer screen when zoomed in). Classified leftside, leftego,
rightego and rightside lane boundaries are represented by blue, green, red and white
colors respectively (best seen in color)
cost effective, vision based approach incurs lot of challenges in extracting lane
features from varying driving conditions. Low light condition during dawn and
dusk, and reduced visibility in bad weather directly affects the lane detection
accuracy. Road surface may vary in appearance due to construction material
used, tyre markings and because of shadows casted by vehicles and neighboring
trees, making detection error prone. Also presence of informative road markings
increases chances of false classification. Occlusion of lane markings due to vehi-
cles is a usual situation which adds to the challenge of inferring lane boundaries,
lane markings may be completely occluded in heavy traffic conditions. The chal-
lenge gets amplified for side lane detection as their visual signatures are weak
due to the road geometry ahead. As well as side lane detection is rarely studied
problem in the literature since most of the methods attempts to address ego lane
detection problem.
Most of the lane detection methods employ traditional computer vision tech-
niques where a hand-crafted features are designed by arduous process of fine
tuning. Such specialized features works under a controlled environment and are
not robust enough in complex driving scenarios, hence not suitable for practical
deployment. A computer vision approach designed with CNN, has potential to
provide reliable and accurate solution to lane detection. Recent lane detection
solutions based on CNN semantic segmentation were impressive in their per-
formance [10][11][12]. Though impressive the CNN based segmentation methods
require post processing and model fitting operations to obtain final lane pre-
dictions. Also the potential of CNN to summarize patterns is not completely
explored in the literature. We describe the related work in Section 2.
In our work, we analyze renowned semantic segmentation CNN architectures
for task of lane detection. We identify that the segmentation approach is inef-
ficient particularly for lane detection problem as described in Section 3.1. The
generated lane segmentation masks appear splattered and fragmented due to low
segmentation accuracy of lane boundaries. Further requiring a post processing
steps like tracking and model fitting to obtain lane parameters. We pose the
lane detection problem as regression problem (Section 3.2), where our network
can be trained for producing parameterized lane information in terms of image
coordinates as shown in Fig 1. This new paradigm of using regression instead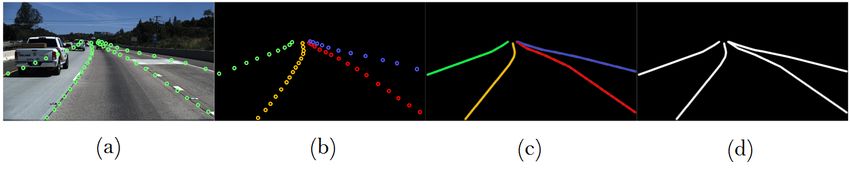
Multilane detection and classification using CNN as a regression network   3

of segmentation, produces better detection accuracy as it does not demand each
pixel to get classified accurately. We derive our dataset using TuSimple [22]
dataset (Section 3.3), and the dataset format enables us to train our network
in end-to-end manner. We obtain improved detection accuracy over the recent
segmentation based methods, without employing any post processing operations
as explained in Section 4.

2     Related Work

2.1    Traditional approaches

The robustness of traditional lane detection techniques directly depends on re-
liable feature extraction procedure from the input road scene. An HSV based
feature is designed to adapt with the changes in lightning condition, is demon-
strated to detect lane markers in [3]. Inverse perspective mapping (IPM) tech-
nique is often used as a primary operation in lane detection. Method in [4] apply
a steerable filter on equally spaced horizontal band in the IPM of input frame
to extract lane marking feature. Accuracy of approaches using IPM is lowered
due to false positives introduced by vehicles present in the scene. A method in
[5] detect vehicle ahead in the scene using SVM classifier, and uses this vehicle
presence information to add robustness to approach in [4]. Data from multiple
sensors can be combined to improve detection accuracy. Vision based multilane
detection system [15] combines GPS information and map data. A feature de-
rived from fusion of LiDAR and vision data statistics is use detect curb location
along the road [6]. This curb information is further used for lane detection with
help of thresholding (OTSU’s), morphological operation (TopHat) and PPHT
(progressive probabilistic hough transform). Another usual approach to produce
robustness against noisy feature measurement is use of a detection and tracking
framework like particle and kalman filtering [16]. An ego lane detection method
[7] makes use of multiple particle filters to detect and track of lane boundary lo-
cations. This superparticle approach tracks lane boundary points by propagating
particles in bottom-up direction of input frame, independently for left and right
ego lane boundaries. An efficient particle filter variant [14] is shown to identify
road geometry ahead in real-time. An energy efficient named Lanquest [9] de-
tects ego-vehicle’s position on the lane using inertial sensor in the smartphone,
but it cannot be used to identify road turnings ahead.

2.2    CNN based approaches

Recent approaches incorporating CNNs for the lane marker detection [11][12]
have proven to be more robust than model based methods. A CNN used as a
preprocessing step in a lane detection system [10], helps in enhancing edge infor-
mation by noise suppression. DeepLanes [13] detects immediate sideward lane
markings with laterally mounted camera system. Although DeepLanes achieve
real time performance with high accuracy, it cannot detect road turning ahead.
4       S. Chougule, N. Koznek, A. Ismail, G. Adam, V. Narayan, M. Schulze

Multilane detection method in [8] makes use of CNN and regression to iden-
tify line segments that approximate a lane boundary effectively, it requires high
resolution images to work with which hampers the speed. SegNet[18] based mul-
tilane detection network [17] segment out lanes, though promising the segmented
mask are not accurate at road turnings. VPGNet [25] detects and classify lane
markings along with road informative markings, it is inspired by the human intu-
ition of identifying lane layout from global context like road structure and traffic
flow. VPGNet trains a baseline network for task of vanishing point detection
and further fine tune it for lane and road marking detection task, which helps
to improve the overall accuracy. To improve segmentation accuracy of thin and
elongated objects like poles and lanes boundaries, Spatial CNN (SCNN) [26] re-
places the conventional layer-by-layer convolution with slice-by-slice convolution
within feature maps. Such an arrangement provides information flow between
pixels across rows and columns, which is hypothesized to be effective for summa-
rizing the global context. A GAN framework is utilized in [27] for lane boundary
segmentation, where the discriminator network is trained using an “embedding
loss” function which iteratively helps the generator network in learning of higher
structural semantics of lanes. LaneNet [24] is a instance segmentation network
which makes use of a branched structure to output binary lane segmentation
mask and pixel localization mask, which is further used to infer lane instance
by clustering process. Apart from LaneNet, a separate network is trained for
obtaining parametric lane information form lane instance segmentation mask.
    Our work mainly differs in two ways. Firstly unlike the recent network which
have complex structure (from training perspective) and specialized message pass-
ing connections, our network has relatively simple structure consisting of known
layer operations. The change of paradigm from segmentation to regression gives
performance edge to our network. Secondly, no post processing is needed to infer
lane information as our network can be trained in end-to-end way.

3     Coordinate Network
3.1   Issues with segmentation approach
Though the recent CNN semantic segmentation approaches have been proven
to be effective, they are still an inefficient way for detecting lane boundaries.
Semantic segmentation network carry out multiclass classification for each pixel,

Fig. 2. Segmentation mask generated by ENet [20] and FCN [19] network show frag-
mentation and splattering issues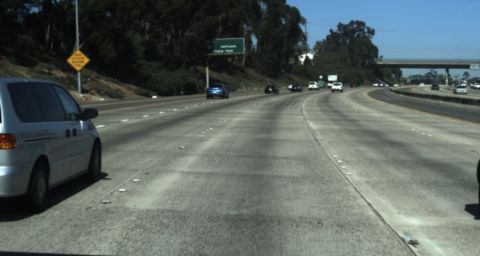
Multilane detection and classification using CNN as a regression network        5

producing a dense pixel mask as output. Thus the segmentation paradigm is too
exacting in nature as the emphasis is on obtaining accurate classification per
pixel, instead of identifying a shape. Moreover the lane boundaries appear as a
thin and elongated shapes in the road scene, unlike cars and pedestrian which
appear blob shaped. A small loss in segmentation accuracy can significantly de-
grade the segmentation mask of lane boundaries, rendering them fragmented and
splattered as shown in Fig 2. Additional post processing operations like model
fitting and tracking are needed to infer lane boundaries from these noisy segmen-
tation lane masks. In order to overcome these issues, we pose the lane detection
problem as CNN regression task. We devise a network to output parameterized
lane boundaries in terms of image coordinate. Unlike the segmentation approach,
this new approach is less demanding as it does not rely on each pixel to get clas-
sified correctly, and does not require any post processing stage as well. Also
the format of our derived dataset enables to train a network in an end-to-end
fashion.

3.2    Network architecture

For implementing the regression approach for lane detection and classification,
we develop a CNN model which outputs four lane coordinate vectors representing
the predicted positions of lane boundaries in the given road scene. The four
lane coordinate vector corresponds to four lane boundary types (classes) i.e
rightego, leftego, rightside and leftside. A single lane coordinate vector consist of 15
points (x,y) on the image plane, representing the sampled locations of the lane
boundary. The predicted points may lie outside the image plane and are treated
to be invalid (see Fig. 3). The usual structure of semantic segmentation network
consist of an encoder, followed by a decoder which expands the feature map to
a denser segmentation map. Unlike the segmentation network, our network has
just the encoder followed by four bifurcating branches of fully connected layers.
Where each of the branch outputs a lane coordinate vector corresponding to
one of the lane boundary type as shown in Fig 4. The encoder operates on an
image of resolution 256x480 and comprises of five sections, where each section

Fig. 3. Coordinate network outputs four lane vectors corresponding to four lane bound-
ary types, each containing 15 locations along the predicted lane boundary
6       S. Chougule, N. Koznek, A. Ismail, G. Adam, V. Narayan, M. Schulze

                            Fig. 4. Network architecture

consist of two convolutional layer followed by a max-pooling layer (max-pooling
is excluded for last section) as shown in Fig 4. Two fully connected layers are
added back-to-back for each lane type (class), giving the network a branched
structure. Such branched arrangement minimizes misclassifications of predicted
lane points (coordinates). The network details are given in Table 1.

3.3   Dataset preparation and network training
In order to train our network for lane detection and classification task, we derive
a dataset from TuSimple [22] dataset published for lane detection challenge. The
challenge dataset consist of 3626 images of highway driving scenes, along with
their corresponding lane annotations. These images are of 720x1280 resolution
and are recorded in medium to good weather conditions during daytime. The
lane annotation information consist a list of the column position (index) for the
lane boundaries corresponding to a fixed row positions (indexes). Fig 5(a) shows
the visualization of an example from TuSimple dataset. On an average there are
four lanes annotated per image, marking the left and right ego lane boundaries
and the left and right side lane boundaries. Lanes which are occluded by vehicles,
or cannot be seen because of abrasion are also retained.

Fig. 5. (a) Example from TuSimple dataset (b) Derived dataset for training coordinate
network which has positional as well as lane type information (best seen in color) (c)
Derived dataset for training segmentation networks (LaneNet and UNet) (d) Derived
dataset for analyzing lane detection abilities of segmentation networks (ENet and FCN)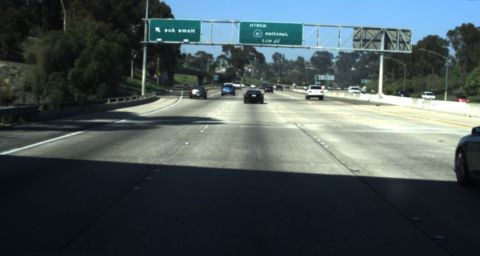
Multilane detection and classification using CNN as a regression network              7

                           Table 1. Network Description

    Layer Name Type                      Kernel                         Stride Padding
    Conv1 1      Convolution             (3x3)                          (1x1)   1
    Conv1 2      Convolution             (3x3)                          (1x1)   1
    Pool1        Max-Pooling             (2x2)                          (2x2)   1
                   Repeat above sequence for encoder section 2,3 and 4
    Conv5 1      Convolution             (3x3)                          (1x1)   1
    Conv5 2      Convolution             (3x3)                          (1x1)   1
                               Structure of a single branch
    FC 1         Fully connected layer   outputs vector of 90 feature   -       -
    FC 2         Fully connected layer   outputs vector of 30 values    -       -

     The TuSimple dataset does not distinguish between the lane boundary type
i.e. ego right, ego left, side right and side left (see Fig. 5(a)). So we derive a
dataset which has the lane boundary position as well as lane type information
(see Fig 5(b)) and has images of 256x480 resolution. In order to compare our
approach with the segmentation approach, we are required to train and evaluate
semantic segmentation networks for the task of lane detection and classification
as well. Hence we also derive a second dataset for semantic segmentation task
by fitting curves over the lane points (coordinates) from the derived dataset of
the coordinate network (see Fig 5(c)). All the curves drawn in the ground truth
images are of 8 pixels in thickness. As shown in Fig. 5(d), we also derive a third
dataset which contains just the lane positional information for analyzing the
segmentation capability of ENet[20] and FCN[19] (refer Fig 2).
     As the number of images in challenge dataset is low to effectively train the
CNN variants, we adopt data augmentation and transfer learning strategies to
improve the learning result. Data augmentation is a technique to synthetically
extend a given dataset by applying different image processing operations. Ef-
fective application of data augmentation can increase the size of a training set
10-fold or more. Additionally, data augmentation adds immunity against over-
fitting of the network. To extend our derived dataset to 11196 images, we used
operations like cropping, mirroring, adding noise and rotating the images around
varying degrees. Similar procedure is followed for augmenting all the derived
datasets, and for generating test dataset from TuSimple test images. During
transfer learning we borrow the weights of the encoder section of UNet [23],
trained on Cityscape Dataset [21]. Later our network is fine-tuned with the de-
rived dataset. During network training, we used stochastical gradient descent
optimizer with learning rate of 0.001. The batch size was kept to 1 and training
was done for 75 epochs. We used following L1 loss function:

                            15
                            X                       15
                                                    X
                   Loss =         | xpi − xgi | +         | ypi − ygi |                  (1)
                            i=1                     i=1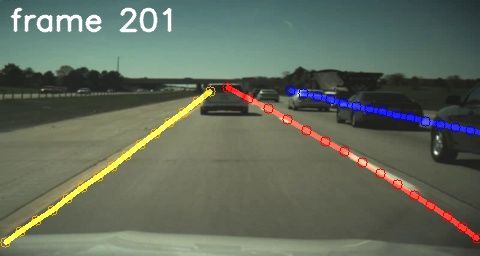
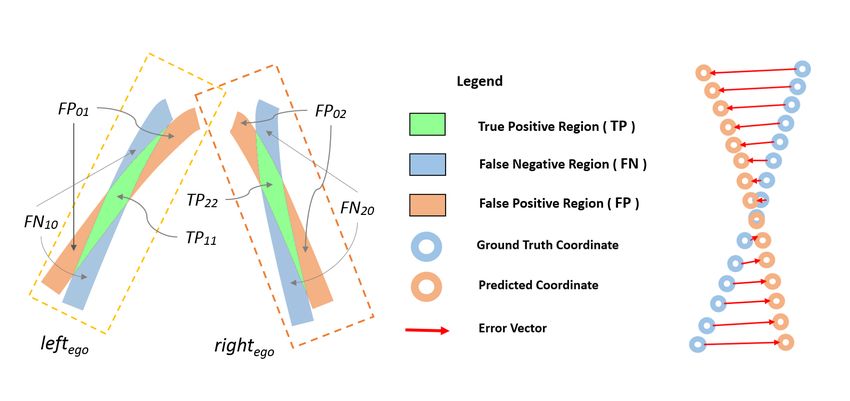
8       S. Chougule, N. Koznek, A. Ismail, G. Adam, V. Narayan, M. Schulze

Fig. 6. Metric illustration. Left hand side figure illustrates MIoU metric components
where the background, ego lane left boundary and ego lane right boundary have class
id as 0, 1 and 2 respectively. The right hand side figure shows the Euclidean error
vector between the predicted and ground truth coordinates

where (xpi, ypi ) are predicted lane coordinates, and (xgi, ygi ) are the correspond-
ing ground truth coordinates.

4     Evaluation
The coordinate network is devised to be an improvement over the recent lane de-
tection approaches those which primarily perform semantic segmentation. Hence
in order to compare our network, we choose the LaneNet [24] which is an in-
stances segmentation network developed as a lane detection and classification
solution. LaneNet makes use of discriminative loss function [24] which gives it a
performance edge over semantic segmentation networks. Since the weights of our
network’s encoder section are borrowed from UNet [23] (trained on CityScape
dataset[21]), we choose UNet as a second network for comparison in our work. We
train UNet and LaneNet as a five-class semantic segmentation network using our
derived segmentation dataset with IoU (Intersection over Union) and discrimi-
native loss [24] functions respectively. The four lane boundaries are identified by
four distinct classes and background forms the fifth class.

4.1   Quantitative Analysis
Most common metrics for evaluating segmentation accuracy are based on simi-
larity measures between predicted and ground truth pixels. Hence our coordinate
network cannot be directly compared with LaneNet and UNet, as our network
outputs image coordinates (xpi, ypi ) instead of a dense pixel-wise prediction. To
make the performance of the coordinate network comparable to the LaneNet
Multilane detection and classification using CNN as a regression network           9

and UNet, the output of our network is adapted. We generate the lane segmen-
tation image (mask) by fitting the curve on the predicated lane coordinates. The
drawn lanes have the width consistent to the lane width used for generating the
ground truth images of the derived segmentation dataset. The predictions of all
the networks are then compared to the ground truth in the test dataset using
the MIoU (mean intersection over union) metric. The MIoU metric for a single
test image is defined as follows:
                              k
                         1 X                 T Pii
               M IoU =                                                               (2)
                       1 + k i=0 kj=0 F Nij + kj=0 F Pji − T Pii
                                P            P

where k is number of classes (k =5 in our case i.e rightego, leftego, rightside, leftside
and background ).TP, FN and FP are pixel counts of true positive, false negative
and false positive regions respectively as illustrated in Fig 6.

            Table 2. Lane detection accuracy measured as MIoU metric

                       Network                             MIoU
                       UNet (Semantic Segmentation)    64.5
                       LaneNet (Instance Segmentation) 65.7
                       Ours (Regression)               67.2

    We evaluate all the networks on the 1000 test images, with their performance
summarized in Table 2. Although LaneNet demonstrate better accuracy (MIoU)
over UNet, our coordinate model outperform LaneNet as can be seen from the
Table 2. As the CNN regression approach seems most promising both in visual
examination and in terms of MIoU metric, we investigate the coordinate net-
work more thoroughly. In Table 3, we summarize the performance of coordinate
network on the four lane types. We compute the mean error between predicted
lane coordinates with the corresponding ground truth values as a Euclidean dis-
tance (in terms of pixels), for each lane type and over entire test dataset. The
mean prediction error for single lane boundary class is defined as follows and
illustrated in Fig 6.
                                           15
                                        1 Xp
         Mean Prediction Error =              (xpi − xgi )2 + (ypi − ygi )2          (3)
                                       15 i=1

where (xpi, ypi ) are predicted lane coordinates, and (xgi, ygi ) are the correspond-
ing ground truth coordinates. From prediction error statistics in Table 3 and it
can observe that the mean error is relatively low for ego lane boundaries as
compared to side lane boundaries. Particularly for side lane boundaries, we also
record the count of missed lanes i.e. lanes that were present in the ground truth
but were completely missed-out by the network. Similarly we note the count of
10 S. Chougule, N. Koznek, A. Ismail, G. Adam, V. Narayan, M. Schulze
Input Image
Ground Truth
UNet
LaneNet
Ours
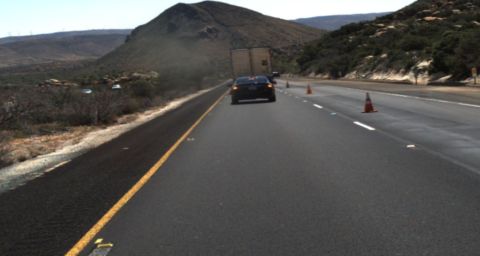
Fig. 7. Multilane detection and classification on different road driving scenarios. Out-
put of our network is adapted for visualization. Classified leftside, leftego, rightego and
rightside lane types are represented by green, orange, red and blue colors respectively
(best seen in color)
“Over-predicted” lanes as those lanes that were predicted by the network but
were not present in the ground truth. From Table 3, it can be observed that the
missed lane count is low compared to the falsely predicted side lane boundaries.
Also it can be observed that the mean error values for ego lane boundaries are
within the thickness of ground truth lane boundary (i.e. 8 pixels), justifying the
improved MIoU metric.
Table 3. Prediction error statistics in terms of pixels computed for 256 x 480 image
resolution
Lane Type Mean Prediction Maximum Minimum Missed “Over-predicted”
Error [pixels] [pixels] [pixels] Lanes Lanes
rightego 6.05 30 0.61 - -
leftego 6.54 32.05 0.95 - -
rightside 8.99 100.4 1.38 1 3
leftside 9.94 94.26 1.13 2 7
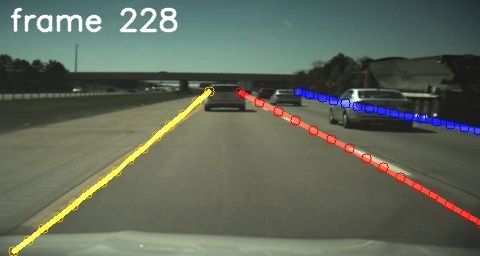
4.2 Qualitative analysis
In order to visually compare the coordinate network’s output with rest of the
segmentation networks, we fit and plot the curves using the predicted lane image
coordinates. We obtain predictions of all the networks on driving scenarios likeMultilane detection and classification using CNN as a regression network 11 Fig. 8. Stable and consistent detection and classification observed during highway test drive, without utilizing any tracking framework occlusions due to vehicles, poorly lane marked roads and high contrast illumi- nations due to over bridge shadows. As can be seen form Fig 7, the coordinate model is more reliable in detecting and classifying of multiple lanes when com- pared to other two networks. Particularly UNet and LaneNet fail in detecting lane boundaries in high contrast images arising in the scenario of under pass, and also performs poorly during occlusions due to vehicles. Moreover we observe that UNet and LaneNet tend to confuse between lane boundary types for lane markings those are away from the camera, which get manifested as broken lane boundaries in predicted segmentation mask. Coordinate network on the other hand has better detection accuracy in occlusions, and particularly in scenarios like shadows casted by over bridge. We validated the coordinate network in our test vehicle using Nvidia’s PX2 platform. We observe a consistent and stable detection without using any tracking framework during highway test drive, as shown in Fig 8. 5 Conclusions We presented a CNN based regression network for reliably detecting multiple lanes as well as classifying them based on position, where our network produces parameterized lane information in terms of image coordinates. Unlike the recent CNN segmentation based methods which produces dense pixel masks, our regres- sion approach removes the stringent criterion of classifying each pixel correctly. Thereupon improving the detection accuracy of both the ego lane and side lane boundaries. The convenient format of our derived dataset enables training of the network in an end-to-end fashion, thus eliminating any need of post-processing operations. We found our network performing better than LaneNet and UNet during evaluation, particularly in high contrast scenes formed due to over bridge shadow and in situation where lane markings are occluded by vehicles. Moreover our network is relatively better in identifying distant lane markings, which are often misclassified by segmentation based methods. We validated the network on our test vehicle under usual highway driving conditions, where we observed a consistent and stable detection and classification of lane boundaries without employing any tracking operation. Our network attains a promising performance of 25 FPS on Nvidia’s PX2 platform.
12      S. Chougule, N. Koznek, A. Ismail, G. Adam, V. Narayan, M. Schulze

References
1. K. Bengler, K. Dietmayer, B. Farber, M. Maurer, C. Stiller, and H. Winner, Three
   Decades of Driver Assistance Systems: Review and Future Perspectives, IEEE Intell.
   Transp. Syst. Mag., vol. 6, no. 4, pp. 6-22, 2014.
2. S. Sternlund, J. Strandroth, M. Rizzi, A. Lie, and C. Tingvall, The effectiveness
   of lane departure warning systems: A reduction in real-world passenger car injury
   crashes, Traffic Inj. Prev., vol. 18, no. 2, pp. 225-229, 2017.
3. V. S. Bottazzi, P. V. Borges, and B. Stantic. Adaptive regions of interest based on
   hsv histogram for lane marks detection. Robot Intelligence Technology and Appli-
   cations 2, 274:677-687.
4. R. K. Satzoda and M. M. Trivedi, Vision-based Lane Analysis: Exploration of Issues
   and Approaches for Embedded Realization, 2013.
5. R. K. Satzoda and M. M. Trivedi, Efficient lane and vehicle detection with integrated
   synergies (ELVIS), in IEEE Computer Society Conference on Computer Vision and
   Pattern Recognition Workshops, 2014, pp. 708-713.
6. Q. Li, L. Chen, M. Li, S. L. Shaw, and A. Nuchter, A sensor-fusion drivable-region
   and lane-detection system for autonomous vehicle navigation in challenging road
   scenarios, IEEE Trans. Veh. Technol., vol. 63, no. 2, pp. 540-555, 2014.
7. B. S. Shin, J. Tao, and R. Klette, A superparticle filter for lane detection, Pattern
   Recognit., vol. 48, no. 11, pp. 3333-3345, 2015.
8. A. Bar Hillel, R. Lerner, D. Levi, and G. Raz, Recent progress in road and lane
   detection: A survey, Machine Vision and Applications, vol. 25, no. 3. pp. 727-745,
   2014.
9. H. Aly, A. Basalamah, and M. Youssef, LaneQuest: An accurate and energy-efficient
   lane detection system, in 2015 IEEE International Conference on Pervasive Com-
   puting and Communications, PerCom 2015, 2015, pp. 163-171.
10. J. Kim, J. Kim, G. J. Jang, and M. Lee, Fast learning method for convolutional
   neural networks using extreme learning machine and its application to lane detec-
   tion, Neural Networks, vol. 87, pp. 109-121, 2017.
11. M. Park, K. Yoo, Y. Park, and Y. Lee, Diagonally-reinforced Lane Detection
   Scheme for High-performance Advanced Driver Assistance Systems, jsts.org, vol.
   17, no. 1, pp. 79-85, 2017.
12. J. Li, X. Mei, D. Prokhorov, and D. Tao, Deep Neural Network for Structural
   Prediction and Lane Detection in Traffic Scene, IEEE Trans. Neural Networks Learn.
   Syst., vol. 28, no. 3, pp. 690-703, 2017.
13. A. Gurghian, T. Koduri, S. V Bailur, K. J. Carey, and V. N. Murali, DeepLanes:
   End-To-End Lane Position Estimation using Deep Neural Networks, Comput. Vis.
   Pattern Recognit., pp. 38-45, 2016.
14. M. Nieto, A. Corts, O. Otaegui, J. A.-J. of R.-T., and U. 2016, Real-time lane
   tracking using Rao-Blackwellized particle filter, Springer.
15. D. Cui, J. Xue, S. Du, and N. Zheng, Real-time global localization of intelligent
   road vehicles in lane-level via lane marking detection and shape registration, in IEEE
   International Conference on Intelligent Robots and Systems, 2014, pp. 4958-4964.
16. M. T. Smith, Robust lane detection and tracking with RANSAC and kalman filter
   Amol Borkar, Monson Hayes, Image Process., pp. 3261-3264, 2009.
17. J. Kim and C. Park, End-To-End Ego Lane Estimation Based on Sequential Trans-
   fer Learning for Self-Driving Cars, in IEEE Computer Society Conference on Com-
   puter Vision and Pattern Recognition Workshops, 2017, vol. 2017 July, pp. 1194-
   1202.
Multilane detection and classification using CNN as a regression network      13

18. V. Badrinarayanan, A. Kendall, and R. Cipolla. SegNet: A deep convo-
   lutional encoder-decoder architecture for image segmentation. arXiv preprint
   arXiv:1511.00561, 2015.
19. J. Long, E. Shelhamer, and T. Darrell, Fully convolutional networks for semantic
   segmentation, Proc. IEEE Comput. Soc. Conf. Comput. Vis. Pattern Recognit., vol.
   07 12 June, pp. 3431-3440, 2015.
20. A. Paszke, A. Chaurasia, S. Kim, and E. Culurciello. ENet: A deep neural network
   architecture for real-time semantic segmentation. arXiv preprint arXiv:1606.02147,
   2016.
21. M. Cordts et al., The Cityscapes Dataset for Semantic Urban Scene Understanding,
   cv-foundation.org, 2016.
22. http://benchmark.tusimple.ai/#/t/1
23. O. Ronneberger, P. Fischer, and T. Brox, U-Net: Convolutional Networks for
   Biomedical Image Segmentation, Miccai, pp. 234241, May 2015.
24. D. Neven, B. De Brabandere, S. Georgoulis, M. Proesmans, and L. Van Gool,
   Towards End-to-End Lane Detection: an Instance Segmentation Approach, Feb.
   2018.
25. S. Lee et al., VPGNet: Vanishing Point Guided Network for Lane and Road Mark-
   ing Detection and Recognition. 2017.
26. X. Pan, J. Shi, P. Luo, X. Wang, and X. Tang, Spatial As Deep: Spatial CNN for
   Traffic Scene Understanding, 2017.
27. M. Ghafoorian, C. Nugteren, N. Baka, O. Booij, and M. Hofmann, EL-GAN: Em-
   bedding Loss Driven Generative Adversarial Networks for Lane Detection, Jun.
   2018.
You can also read


