DT-QDC: A Dataset for Question Comprehension in Online Test - Association for Computational Linguistics
←
→
Page content transcription
If your browser does not render page correctly, please read the page content below
DT-QDC: A Dataset for Question Comprehension in Online Test
        Sijin Wu1 , Yujiu Yang 1 ( ) , Nicholas Yung2 , Zhengchen Shen3 , Zeyang Lei4
            1
              Tsinghua Shenzhen International Graduate School, Tsinghua University
                                         2
                                           Bielcrystal Datalab
               3
                 Institute for Network Sciences and Cyberspace, Tsinghua University
                                               4
                                                 Baidu Inc
            {wusj18, szc18}@mails.tsinghua.edu.cn, yang.yujiu@sz.tsinghua.edu.cn
                      nicholas.yung@bielcrystal.com.hk, leizeyang@baidu.com

                                                     Abstract

    As education switches from the traditional classroom environment to online education and as-
    sessment, teachers could not follow students’ learning behavior closely which leads to inaccurate
    assessment of students’ knowledge. A well-defined method to precisely measure difficulty of
    questions is critical as it can guide teachers in assessing students’ performance and help provide
    customized attention to students. In this paper, we explore the concept of question difficulty
    and share our new Chinese Driving Test Question Difficulty Comprehension (DT-QDC) dataset.
    Different from the existing question datasets, we mainly design for question evaluation and com-
    prehension in online testing, so each question has enriched attributes and difficulty label. Addi-
    tional attributes such as keywords, chapter, and question type would allow models to understand
    questions more precisely. We proposed the Ordinal Regression Multi-Source BERT (ORMS-
    BERT) model to assess the difficulty of the question, which outperforms different baselines by
    6.77% on F1-score and 15.92% on MAE, 28.26% on MSE on the DT-QDC dataset, laying the
    foundation for the question difficulty comprehension task.

1   Introduction
Intelligent education systems are heavily studied and investigated since it can generate great value
both academically and commercially, especially when the COVID-19 pandemics is prevailing. A well-
developed educational assistance system can facilitate students to grasp the learning progress and cus-
tomize personalized learning approaches. It improves the whole learning experience, enhances students’
initiative, and results in better performance in assessments.
   One key component of an intelligent education system is to assess the level of understanding of stu-
dents, and asking questions is the most intuitive way of accomplishing that. However, the most online
quiz system treats questions equally without factoring in the difference in difficulty.
   Some researcher (Sonkar et al., 2020) argued that we should not treat all questions equivalently, be-
cause questions exhibit significant variations in difficulty and discrimination (Embretson and Reise,
2013). Pardos et al. (Pardos and Heffernan, 2011) once introduced the modeling of the problem dif-
ficulty in the knowledge tracing task, but they only used the guess-and-slip parameters related to the
question, without paying attention to the nature of the question itself. For every new question, they must
use the corresponding user answer data to estimate its difficulty.
   In this paper, we go one step further to investigate methods that perform question difficulty com-
prehension using various attributes of the question. Question understanding is one of the key com-
ponent in machine reading comprehension, which is viewed as the sign of machine understand nature
language (Nakanishi et al., 2018). Although question comprehension is not studied as a special task, it
is positively related to the difficulty of the question. Generally speaking, the difficulty is a more abstract
and personalized concept, and it is difficult to quantify to define. To evaluate the students online, We can
measure the difficulty of a question to be answered from the perspective of classification.
This work is licensed under a Creative Commons Attribution 4.0 International Licence.      Licence details: http://
creativecommons.org/licenses/by/4.0/.

                                                        6470
            Proceedings of the 28th International Conference on Computational Linguistics, pages 6470–6480
                                     Barcelona, Spain (Online), December 8-13, 2020
By evaluating the difficulty of each question, the performance of downstream applications such as deep
knowledge tracing and question answering can be improved. We release a dataset, Chinese Driving Test
Question Difficulty Comprehension (DT-QDC), which is formed with a large volume of user records
from the Driving License Examination Website. The dataset contains 14,933 questions with 10 attributes.
Figure 1 shows two examples of questions in the dataset, which attribution includes question explanation,
keywords and test information, etc.

                               Figure 1: Examples from DT-QDC dataset

  Some other datasets exist such as: a genuine grade-school level, multiple-choice science questions
dataset is contributed by (Clark et al., 2018), Wasim et al. (Wasim et al., 2019) submitted a Multi-label
biomedical question dataset, and Li et al. (Li and Roth, 2002) proposed a free-form questions dataset, yet
these datasets only have question text and label, and their volume is relatively lacking. In comparison,
our dataset is larger and richer in attributes, which is very valuable for future research communities to
design, evaluate, and understand questions.
  We propose the Ordinal Regression Multi-Source BERT (ORMS-BERT) model to solve the diffi-
culty comprehension problem. Multi-source BERT (Devlin et al., 2018) text representation and relation
modeling enable us to better understand question difficulty. A novel category encoding technique is
applied to transform multi-class classification tasks into multiple binary classification tasks. Our model
outperforms different baselines by 6.77% on F1 score and 15.92% on MAE, 28.26% on MSE.
  To summarize our contributions:
    • We have clear definitions of question difficulty: absolute difficulty and field difficulty. And we
      propose the task of question difficulty comprehension.
    • We constructed the first question difficulty comprehension dataset DT-QDC, annotated question
      difficulty label based on statistics of tens of millions of users’ answering records.
    • We benchmark a variety of neural models trained on the new DT-QDC dataset, and we propose
      ORMS-BERT for the question difficulty comprehension task, which achieves significant improve-
      ment than baselines.
2    Related work
In order to simplify the online questions comprehension task, we mainly consider the question difficulty
definition, fine-grained division and modeling. Related work includes the following two-fold:

                                                  6471
2.1 Text difficulty predicting
When learning new knowledge, it is important to select the proper material for each student. Text dif-
ficulty predicting systems can help educators find texts from abundant text materials that are grade-
appropriate for the individual student. Balyan et al. (Balyan et al., 2018) proposed four classification
machine learning approaches (flat, one-vs-one, one-vs-all, and hierarchical) used natural language pro-
cessing features in predicting human ratings of text difficulty. Ruseti et al. (Ruseti et al., 2018) used
recurrent neural networks to predicted question depth (very shallow to very deep), in order to provide
feedback on questions generated by students.
2.2 Knowledge Tracing
Knowledge Tracing (KT) is the task of modeling and predicting how human beings learn. There were
several works using Bayesian Knowledge Tracing (BKT) to building temporal models of student learning
(de Baker et al., 2008; Yudelson et al., 2013). Especially, Pardos et al. (Pardos and Heffernan, 2011) uesd
guessing and slipping estimates to model the problem difficulty. Recent work (Piech et al., 2015) has
explored deep knowledge tracing, combining Long Short Term Memory (LSTM) networks with a knowl-
edge tracing task. Sonkar et al. (Sonkar et al., 2020) proposed a question-centric deep knowledge tracing
method, which leveraged question-level information and incorporates graph Laplacian regularization to
smooth predictions under each skill.
3 Dataset Construction and its Statistical Characteristic
3.1 Difficulty and Task Definitions
In this paper, we define the Absolute Difficulty of a problem as the unobservable intrinsic difficulty of
solving the problem. Absolute Difficulty is constituted by the prior knowledge and the comprehensive
ability required to tackle the challenge.
Definition 1. (Absolute Difficulty) Let Q be the set of all questions in a certain field, and the absolute
difficulty be a mapping from Q to a set of non-negative real numbers, annotated as da .
We give two examples to illustrate the idea:
1). We would require at least understanding linear algebra, differentiation, and analysis to
complete a problem on advanced calculus. Whereas solving a set of simultaneous equations
would require less prior knowledge.
2). If Question A asks a student to simply spell out a formula, where Question B presents a
situation that the student needs to first extract the data and then apply the formula. Question B
is more difficult to solve as human reasoning and induction are involved.
We define another concept, Field Difficulty, to factor in individual differences. Field Difficulty of a
question is the difficulty a problem solver feels on ‘field’. It depends on the problem solver and could
change dynamically along the time dimension.
Definition 2. (Field difficulty) Let Q be the set of all the questions in a certain field, S be the set of all
characteristics associated with the problem solver, and the field difficulty is a mapping from Q × S to the
real number set, denoted dp .
People may have different depths of understanding of the prior knowledge, and as time goes, they
would have become more familiar on the subject and hence the difficulty is reduced. Ultimately, when a
problem solver has full control and understanding of all prior knowledge required to solve the problem,
Field Difficulty would approach the Absolute Difficulty. Unless they forget some key knowledge as time
goes and hence the Field Difficulty goes up again.
Task Definition Upon collecting a sufficient amount of data, the absolute difficulty of a problem can
be estimated and be compared to other questions’ absolute difficulty. We also map and discretize the
Absolute Difficulty into M levels D = {1, 2, ..., M }, making it more suitable for comparison and inter-
pretation. To simplify the configuration, M is set to 5 in this paper.
6472Definition 3. (prediction of question difficulty) Given a set of questions {q1 , q2 , ..., qm } in a certain field,
and a set of problem solvers G = {G1 , G2 , ..., Gn }, let the set of Absolute Difficulty after discretization
be D as defined above. We would like to find a mapping f to map a question qi to the set D, where the
following is true:
f (qi , G) = s where s = argmax prob (qi , G, k) (1)
1≤k≤M
Among them, prob is the probability that the absolute difficulty performance of test question q for
group G is k.
The absolute difficulty of the question will affect its error rate, so we use the error rate of a large
number of users as an observation of absolute difficulty.
3.2 Data collection
The Driving License Examination Website1 is an online platform that provides mock questions where
users undertake to test their knowledge before the actual driving exam. We have constructed our Driving
Test Question Difficulty Comprehension (DT-QDC) dataset2 with the platform’s questions and the cor-
responding user answer records. By analyzing these question-answer record pairs, we can inference the
true and objective difficulty of these questions. 14933 questions with 10 attributes were collected from
136 chapters of the Driving License Examination.
3.3 Dataset annotation
In our dataset, TrueCount means number of users who answered the question correctly, FalseCount
means number of users who answered the question incorrectly, Here WrongRate(error rate) is calculated
by the following formula:
F alseCount
W rongRate(errorrate) = (2)
(T rueCount + F alseCount)
Therefore, the distribution of difficulty labels in the dataset is shown in Table 1 below.
Difficulty 1 2 3 4 5 Total
Question Num 2,883 2,955 4,411 3,011 1,673 14,933
Avg TrueCount 25,739,616 23,683,489 17,619,332 12,897,705 4,175,229 16,823,075
Avg FalseCount 655,865 1,618,286 3,057,488 5,127,322 3,354,505 2,762,693
Avg WrongRate 2.53% 6.58% 15.03% 28.89% 47.52% 20.11%
Table 1: Statistics for each difficulty level in the DT-QDC dataset.
The Driving License Examination Website has provided difficulty labels for questions, which bases
on the previous error rate. As shown in Table 1, the difficulty label we obtained through the record of
tens of millions of users’ answer record, which can prove that our difficulty label is consistent with the
human answer record.
We believe that the error rate is the question absolute difficulty observation, it related to not only ques-
tion difficulty but also many other random factors. Over time, the error rate of some questions fluctuates
slightly, but it does not affect the difficulty level of the question. This is also the purpose of the difficulty
label discretization. When multiple users answer the same question, they will experience different field
difficulty according to their different knowledge levels and comprehensive abilities. Since our difficulty
label comes from the behavior of tens of millions of users, we can minimize the deviation caused by
different backgrounds of users. Therefore, the absolute difficulty of the problem can be inferred from the
difficulty observation. The correlation between error rate and question difficulty is a strong evidence for
1
https://beijing.jiakaobaodian.com/
2
The dataset is made available for research use only.
6473the quality of the difficulty labels we have collected. As shown in Figure 2(b), The correlation between
the two is extremely obvious.
Because TrueCount, FalseCount, WrongRate are directly related to question’s difficulty label, and not
available in the inference stage, so we do not use them in our model, but use them to prove the quality of
the dataset.
3.4 Statistics of the Dataset
(a) Stacked map of difficulty on each chapter (b) Correlation between difficulty
labels and error rates
Figure 2: DT-QDC dataset statistics
By making a difficulty stack map of each chapter’s questions, as shown in Figure 2(a), we can observe
that the difficulty distribution in each chapter is quite different. For example, there is nearly no question
with difficulty level 1 in chapter 183-199, which proves that these chapters are generally difficult. The
questions in each chapter involve different sets of knowledge points and investigation methods, which in
turn affects the question difficulty. This shows that additional attributes can help question comprehension
task.
In the DT-QDC data set, there are three types of questions: True/ False questions, single choice ques-
tions, and multiple-choice questions. The distribution of difficulty labels on each question type is quite
different, as shown in Figure 3(a). Intuitively, it is difficult to judge the difficulty of a question literally.
The visualization of the semantic embedding of each question confirms it, as shown in Figure 3(b). Here
we use BERT embedding and use Principal components analysis to reduce the dimension from 768 to 3.
(a) Distribution of difficulty on each question type (b) Questions embedding. Questions with
difficulty levels 1, 2, 3, 4, and 5 are rep-
resented by red, blue, green, purple, and
yellow dots, respectively.
Figure 3: DT-QDC dataset statistics.
64744 Question difficulty Comprehension Model
Given an input question Q = (w1 , w2 , ..., wm ), which is asked with o = (y1 , y2 , ..., yn ) as its options
, e = (z1 , z2 , ..., zl ) as its explanation, k = (t1 , t2 , ..., th ) as its keywords, t as its question type, c
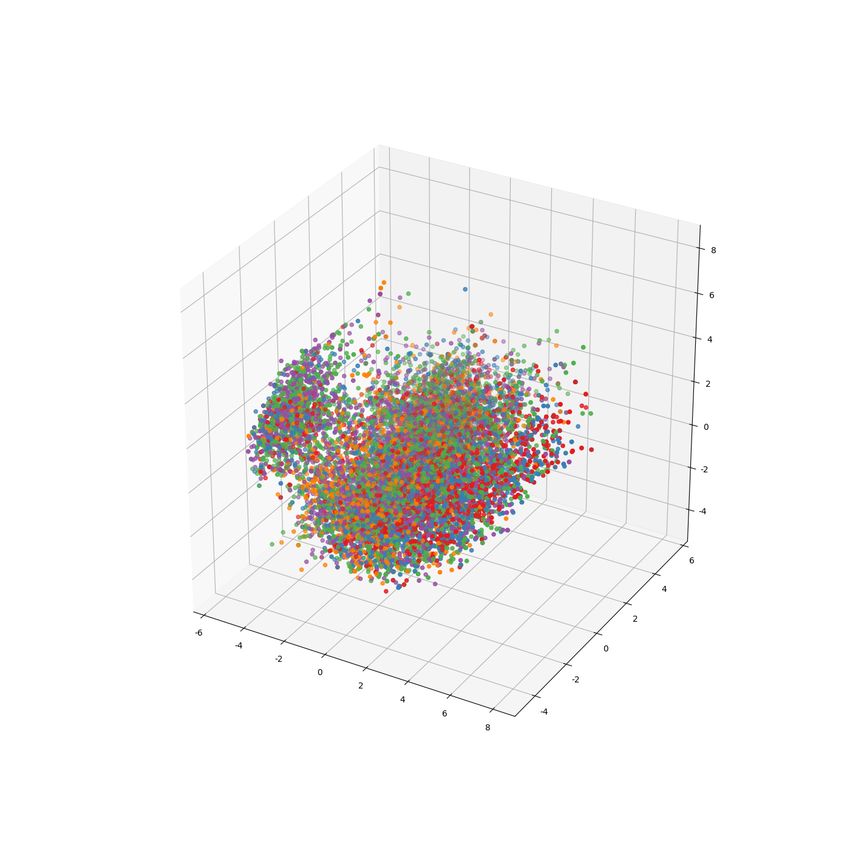
as its chapter, and a as its answer, our task is to predict its difficulty level d. The architecture of our
ORMS-BERT model is depicted in Figure 4.
The encoder takes the text and the discrete data as inputs. Two separate BERTs(Devlin et al., 2018)
are employed to encode the question and options into contextualized representations. And three sepa-
rate linear layers are used to learn the embedding of the question type, answer, and chapter. Besides
these standard elements, We also use the attention mechanism with average sequence pooling to model
question-option and option-option relationships. Moreover, we also apply ordinal regression loss to bet-
ter model the nature of the difficulty.
Figure 4: Model Architecture of the Proposed Model. Dark blue and yellow are the corresponding text
representation of the question and option. Orange is the question-option relationship representation,
green is the option confusion representation. Purple, light blue, and gray are the corresponding question
type, answer, and chapter representation.
4.1 Text Representations
We use two separate BERTs to encode the question and options:
hqi =BERTq (hqi−1 , xqi )
(3)
hoi =BERTo (hoi−1 , xoi )
where hqi and hoi are the hidden states at the i-th time step of the question-BERT and options-BERT.
This is because the question and options are not consecutive statements, their content often has both
connection and conflict. Using different BERTs to encode can better learn their representations sepa-
rately. This operation also increases the amount of model parameters.
This approach we refer as MS-BERT(Multi-Source BERT).
64754.2 Relation Modeling
According to intuition, the degree of confusion of options can determine the question difficulty. If the
options are not very different from each other, it is difficult to choose the correct answer from them.
To model the option-option relation, we use the attention mechanism to model the semantic similarity
between the options. Then use average sequence pooling to reduce the parameters size from n × d to
1 × d, where d is the hidden size.
n T
1X QK
Conf usion(Q, K, V ) = sof tmax( √ )V (4)
n dk
1
We use the same method to model the relationship between question and options, where Q, K, and V
represent question, options, and options respectively.
4.3 Ordinal Regression Loss
Different from ordinary classification tasks, categories in question difficulty classification task are not
completely independent, but rather follow a natural order (Diaz and Marathe, 2019). If our model in-
correctly predicts a difficulty level 1 question as a difficulty level 2, the penalty it receives should be
less than predicting a difficulty level 1 question as difficulty level 5. Therefore, we try to transform the
multi-classification problem into multiple binary classification problems following the (Niu et al., 2016),
while considering the relationship between categories.
Since the multi-classification task needs to be converted into multiple two-classification tasks, the dif-
ficulty label also needs to be mapped to the corresponding binary code. Each bit of the code corresponds
to a binary classification subtask. Our coding design ideas are as follows:
• Editing distance between codes of categories can reflect the natural distance between categories.
• Each bit of the code is the label of a subtask.
• The variance of the probability that each bit being 1 as small as possible. Let the model learn the
real task, rather than learning which bit in the binary code is more likely to be 1.
The improved encoding rules are as follows, with Nc representing the total number of categories, S(k)
is the binary code of the kth category. [n]h,N represents the operation of converting the integer n into its
N -bit h-ary code. If h is 2, it’s binary.
When Nc is odd:
h Nc −1 i
i k 6 Nc2−1
P 2
i=k 2 2,N −1
c
S(k) = h [0]2,Nc −1i k = Nc2+1 (k = 1, 2, ..., Nc ) (5)
P k i N +1
i= Nc +1 +1
2 k > c2 + 1
2 2,Nc −1
When Nc is even:
h Nc i
Nc
k6
P2 i
i=k 2 2,N
2
c
S(k) = hP i (k = 1, 2, ..., Nc ) (6)
k i Nc
N
i= c +1
2 k> 2 +1
2 2,Nc
Subtasks corresponding to each bit of the code are as follow. When the cth bit of the code is 1, the
corresponding subtask is T (c). x is the difficulty label of current sample.
When Nc is odd:
x 6 c c 6 Nc2−1
T (c) = (c = 1, 2, ..., Nc − 1) (7)
Nc −1
x>c c> 2
6476When Nc is even:
Nc
x 6 c c 6 2
T (c) = (c = 1, 2, ..., Nc ) (8)
Nc
x>c c>
2
For example, when Nc is 5, the number of binary coded digits is Nc − 1 = 4, the binary code of
categories is in Table 2.
Category 1 2 3 4 5
Binary code 1,1,0,0 0,1,0,0 0,0,0,0 0,0,1,0 0,0,1,1
Table 2: Binary Code Example
When Nc is 5, the corresponding subtasks of each bit of the binary code are in Table 3.
Bit 1th 2th 3th 4th
Subtask x61 x62 x>3 x>4
Table 3: Subtasks Example
We think that each subtask has the same weight, so the loss function is:
Ns
X
L= (di ∗ log(dei ) + (1 − di ) ∗ log(1 − dei )) (9)
1
where Ns is the total number of subtasks, di is the true label of the ith subtask, dei is the predicted label
of the ith subtask. This approach we refer as Ordinal-Regression Multi-Source BERT (ORMS-BERT).
5 Experiments
We constructed several baselines including powerful pre-trained models for comparison with our pro-
posed model and reported their performance on the new DT-QDC dataset.
5.1 Compared Models
For all the baseline models, we stitch together all text, including questions, options, explanations, and
keywords, as the first part of the input. We use gensim3 to train word2vec vectors(Mikolov et al., 2013)
to initialize non-pretrained models’ embedding layers, and then use TextCNN, Bi-LSTM, Bi-GRU, and
BERT to encode the text. At the same time, the discrete data including question type, answer, and chapter
are used as the second part of the input, we use linear layers to learn their embeddings. Two parts of
information are concated together before the final fully connected layer to predict the difficulty label.
(Xu et al., 2020) proposed BERT-QC model, which enumerate multi-label questions as multiple single-
label instances, to solve the question classification task. We use their code4 to get the result on DT-QDC
dataset. Because their model has no additional structure for discrete data, so we concated all the discrete
data at the end of texts. This may be the reason why BERT-QC performs worse than our BERT baseline.
We split the DT-QDC dataset by 8:1:1 as train, val, and test set. The performance of models mentioned
above on the test set is shown in Table 2, we report weighted Precision, Recall, and F1-score to make the
comparison fairer.
5.2 Experiments Settings
For TextCNN, Bi-LSTM, and Bi-GRU, the batch size is 512, the learning rate is 0.001, which is best for
its performance. For all BERT based models, max sequence length for texts is 40, the batch size is 36,
the learning rate is 4e-5. For each experiment, 5 runs were conducted and an average of the results were
taken.
3
https://radimrehurek.com/gensim/models/word2vec.html
4
https://github.com/cognitiveailab/questionclassification
6477Model Precision(%) Recall(%) F1(%) MAE MSE
TextCNN (Kim, 2014) 39.24 39.10 38.75 0.880 1.558
Bi-LSTM (Zhou et al., 2016) 43.26 43.98 43.26 0.761 1.247
Bi-GRU (Tang et al., 2016) 45.96 44.45 44.14 0.731 1.140
BERT (Devlin et al., 2018) 47.89 47.39 46.99 0.697 1.100
BERT-QC (Xu et al., 2020) 46.90 46.12 46.26 0.711 1.138
ORMS-BERT(Ours) 52.40 50.27 50.17 0.586 0.784
Table 4: Experiment Results
5.3 Experiment Results
As in Table 4, our best model ORMS-BERT outperforms other baselines by large margins. Our ORMS-
BERT achieved the best Precision, Recall, and F1-score, where we see 4.51, 2.88, and 3.18 improvement,
corresponding 9.42%, 6.08%, and 6.77%. which indicates our text representation and relation modeling
approach can learn the difference between difficulty levels better. Our ORMS-BERT also achieved best
MAE and MSE, where we see 0.11 and 0.32 improvement, corresponding 15.92% and 28.68%, which
indicates our ordinal regression loss can help the model learn the relations between categories.
5.4 Ablation Study
Model Precision(%) Recall(%) F1(%) MAE MSE
MS-BERT w.o relations 48.68 48.33 48.23 0.667 1.021
MS-BERT w.o tags 48.15 47.19 47.10 0.687 1.076
MS-BERT 50.53 49.67 49.83 0.620 0.895
ORMS-BERT 52.40 50.27 50.17 0.586 0.784
Table 5: Ablation Study
When there is only a multi-class classification loss, MS-BERT’s F1-score performance is lower than
ORMS-BERT 0.34, MSE is greater than ORMS-BERT 0.11. This shows that the loss we defined allows
the model to learn the nature of difficulty better.
When removing our question-options relation and options confusion module, it will cause F1-score to
decrease by 1.6, and MSE increases 0.126. If removing all the tags, including question type, answer, and
chapter information, it will cause F1-score to decrease by 2.73, and MSE increases 0.181. The impact of
removing tags is greater than the impact of removing relations, which shows that additional attributes of
questions play an important role in the task of question comprehension.
6 Conclusion
We proposed the task of question difficulty comprehension and constructed a new dataset DT-QDC with
real-world user answer records and multi-attributes questions to target it. In addition, we provide a strong
model called ORMS-BERT, and then compared its performance with several baselines.
In the future, we will explore question difficulty comprehension tasks in the field of online education.
We expect to combine the question difficulty comprehension task with the question answering task and
knowledge tracing task to model the student performance more scientifically, so as to better assess the
student’s knowledge level and track the student’s learning progress. Our dataset can also be used to
explore related tasks such as question answering, question generation, option generation, question nor-
malization, question rewriting, etc. Our dataset is available online, and we expect it is beneficial for
future research in this field.
6478Acknowledgements
This research was partially supported by the Key Program of National Natural Science Foundation of
China under Grant No. U1903213, the Guangdong Basic and Applied Basic Research Foundation (No.
2019A1515011387), the Dedicated Fund for Promoting High-Quality Economic Development in Guang-
dong Province (Marine Economic Development Project: GDOE[2019]A45), and the Shenzhen Science
and Technology Project under Grant (ZDYBH201900000002, JCYJ20180508152042002).
References
Renu Balyan, Kathryn S. McCarthy, and Danielle S. McNamara. 2018. Comparing machine learning classification
approaches for predicting expository text difficulty. In Proceedings of the Thirty-First International Florida
Artificial Intelligence Research Society Conference, FLAIRS 2018, Melbourne, Florida, USA. May 21-23 2018,
pages 421–426.
Peter Clark, Isaac Cowhey, Oren Etzioni, Tushar Khot, Ashish Sabharwal, Carissa Schoenick, and Oyvind Tafjord.
2018. Think you have solved question answering? try arc, the AI2 reasoning challenge. CoRR, abs/1803.05457.
Ryan Shaun Joazeiro de Baker, Albert T. Corbett, and Vincent Aleven. 2008. More accurate student modeling
through contextual estimation of slip and guess probabilities in bayesian knowledge tracing. In Beverly Park
Woolf, Esma Aı̈meur, Roger Nkambou, and Susanne P. Lajoie, editors, Intelligent Tutoring Systems, 9th Inter-
national Conference, ITS 2008, Montreal, Canada, June 23-27, 2008, Proceedings, volume 5091 of Lecture
Notes in Computer Science, pages 406–415. Springer.
Jacob Devlin, Ming-Wei Chang, Kenton Lee, and Kristina Toutanova. 2018. Bert: Pre-training of deep bidirec-
tional transformers for language understanding. arXiv preprint arXiv:1810.04805.
Raul Diaz and Amit Marathe. 2019. Soft labels for ordinal regression. In IEEE Conference on Computer Vision
and Pattern Recognition, CVPR 2019, Long Beach, CA, USA, June 16-20, 2019, pages 4738–4747. Computer
Vision Foundation / IEEE.
Susan E Embretson and Steven P Reise. 2013. Item response theory. Psychology Press.
Yoon Kim. 2014. Convolutional neural networks for sentence classification. In Proceedings of the 2014 Confer-
ence on Empirical Methods in Natural Language Processing, EMNLP 2014, October 25-29, 2014, Doha, Qatar,
A meeting of SIGDAT, a Special Interest Group of the ACL, pages 1746–1751. ACL.
Xin Li and Dan Roth. 2002. Learning question classifiers. In 19th International Conference on Computational
Linguistics, COLING 2002, Howard International House and Academia Sinica, Taipei, Taiwan, August 24 -
September 1, 2002.
Tomas Mikolov, Ilya Sutskever, Kai Chen, Gregory S. Corrado, and Jeffrey Dean. 2013. Distributed representa-
tions of words and phrases and their compositionality. In Advances in Neural Information Processing Systems
26: 27th Annual Conference on Neural Information Processing Systems 2013. Proceedings of a meeting held
December 5-8, 2013, Lake Tahoe, Nevada, United States, pages 3111–3119.
Mao Nakanishi, Tetsunori Kobayashi, and Yoshihiko Hayashi. 2018. Answerable or not: Devising a dataset for
extending machine reading comprehension. In Proceedings of the 27th International Conference on Computa-
tional Linguistics, COLING 2018, Santa Fe, New Mexico, USA, August 20-26, 2018, pages 973–983. Associa-
tion for Computational Linguistics.
Zhenxing Niu, Mo Zhou, Le Wang, Xinbo Gao, and Gang Hua. 2016. Ordinal regression with multiple output
CNN for age estimation. In 2016 IEEE Conference on Computer Vision and Pattern Recognition, CVPR 2016,
Las Vegas, NV, USA, June 27-30, 2016, pages 4920–4928.
Zachary A. Pardos and Neil T. Heffernan. 2011. KT-IDEM: introducing item difficulty to the knowledge tracing
model. In User Modeling, Adaption and Personalization - 19th International Conference, UMAP 2011, Girona,
Spain, July 11-15, 2011. Proceedings, volume 6787, pages 243–254.
Chris Piech, Jonathan Bassen, Jonathan Huang, Surya Ganguli, Mehran Sahami, Leonidas J. Guibas, and Jascha
Sohl-Dickstein. 2015. Deep knowledge tracing. In Advances in Neural Information Processing Systems 28:
Annual Conference on Neural Information Processing Systems 2015, December 7-12, 2015, Montreal, Quebec,
Canada, pages 505–513.
6479Stefan Ruseti, Mihai Dascalu, Amy M. Johnson, Renu Balyan, Kristopher J. Kopp, Danielle S. McNamara, Scott A.
Crossley, and Stefan Trausan-Matu. 2018. Predicting question quality using recurrent neural networks. In
Artificial Intelligence in Education - 19th International Conference, AIED 2018, London, UK, June 27-30,
2018, Proceedings, Part I, Lecture Notes in Computer Science, pages 491–502. Springer.
Shashank Sonkar, Andrew E. Waters, Andrew S. Lan, Phillip J. Grimaldi, and Richard G. Baraniuk. 2020. qdkt:
Question-centric deep knowledge tracing. CoRR, abs/2005.12442.
Yaodong Tang, Yuchen Huang, Zhiyong Wu, Helen Meng, Mingxing Xu, and Lianhong Cai. 2016. Question
detection from acoustic features using recurrent neural network with gated recurrent unit. In 2016 IEEE Inter-
national Conference on Acoustics, Speech and Signal Processing (ICASSP), pages 6125–6129. IEEE.
Muhammad Wasim, Muhammad Nabeel Asim, Muhammad Usman Ghani Khan, and Waqar Mahmood. 2019.
Multi-label biomedical question classification for lexical answer type prediction. J. Biomed. Informatics, 93.
Dongfang Xu, Peter A. Jansen, Jaycie Martin, Zhengnan Xie, Vikas Yadav, Harish Tayyar Madabushi, Oyvind
Tafjord, and Peter Clark. 2020. Multi-class hierarchical question classification for multiple choice science
exams. In Proceedings of The 12th Language Resources and Evaluation Conference, LREC 2020, Marseille,
France, May 11-16, 2020, pages 5370–5382. European Language Resources Association.
Michael V Yudelson, Kenneth R Koedinger, and Geoffrey J Gordon. 2013. Individualized bayesian knowledge
tracing models. In International conference on artificial intelligence in education, pages 171–180. Springer.
Peng Zhou, Wei Shi, Jun Tian, Zhenyu Qi, Bingchen Li, Hongwei Hao, and Bo Xu. 2016. Attention-based
bidirectional long short-term memory networks for relation classification. In Proceedings of the 54th Annual
Meeting of the Association for Computational Linguistics, ACL 2016, August 7-12, 2016, Berlin, Germany,
Volume 2: Short Papers. The Association for Computer Linguistics.
6480You can also read