Towards a definitive historical high-resolution climate dataset for Ireland - promoting climate research in Ireland - adv-sci-res.net
←
→
Page content transcription
If your browser does not render page correctly, please read the page content below
17th EMS Annual Meeting: European Conference for Applied Meteorology and Climatology 2017
Adv. Sci. Res., 15, 263–276, 2019
https://doi.org/10.5194/asr-15-263-2019
© Author(s) 2019. This work is distributed under
the Creative Commons Attribution 4.0 License.

                     Towards a definitive historical high-resolution
                        climate dataset for Ireland – promoting
                              climate research in Ireland
                          Jason Flanagan1 , Paul Nolan1 , Ray McGrath2 , and Christopher Werner1
          1 Irish   Centre for High-End Computing (ICHEC), National University of Ireland Galway, Galway, Ireland
                     2 School of Mathematical Sciences, University College Dublin, Belfield, Dublin 4, Ireland

                                  Correspondence: Jason Flanagan (jason.flanagan@ichec.ie)

             Received: 15 February 2018 – Revised: 15 February 2019 – Accepted: 1 April 2019 – Published: 17 April 2019

       Abstract. There is strong and constant demand from various sectors (research, industry and government) for
       long-term, high-resolution (both temporal and spatial), gridded climate datasets. To address this demand, the
       Irish Centre for High-End Computing (ICHEC) has recently performed two high-resolution simulations of the
       Irish climate, utilising the Regional Climate Models (RCMs) COSMO-CLM5 and WRF v3.7.1. The datasets
       produced contain hourly outputs for an array of sub-surface, surface and atmospheric fields for the entire 36-
       year period 1981–2016. In this work, we list the climate variables that have been archived at ICHEC. We present
       preliminary uncertainty estimates (error, standard deviation, mean absolute error) based on Met Éireann station
       observations, for several of the more commonly used variables: 2 m temperature, 10 m wind speeds and mean sea
       level pressure at the hourly time scale; and precipitation at hourly and daily time scales. Additionally, analyses
       of 10 cm soil temperatures, CAPE 3 km, Showalter index and surface lifted index are presented.

1   Introduction                                                    with few stations; station data are prone to error and/or miss-
                                                                    ing values; precipitation under-catch and excessive smooth-
Gridded climate datasets are invaluable aids to studies in ob-      ing.
served climate change trends and variability. Additionally,            The outputs from numerical weather models represent
they have potential application to many other diverse areas         an alternative to observations for the production of gridded
of interest – agriculture, hydrology, renewable energy (wind,       datasets. The European Centre for Medium-Range Weather
wave and solar), public health and socio-economic planning.         Forecast (ECMWF) has initiated several global reanalysis
In Ireland, station observations have traditionally been used       datasets beginning with ERA-15 (1979–1993; 190 km res-
to describe the Irish climate (in conjunction with satellite ob-    olution; Gibson et al., 1997). As the models used have
servations) and produce gridded datasets. For instance, daily       improved, finer resolution datasets have followed: ERA-40
and monthly gridded datasets (at 1 km resolution) of precipi-       (1957–2002; 125 km; Uppala et al., 2005); ERA-Interim
tation have been created for Ireland (Walsh, 2012, 2016) and        (1979–present; 80 km; Dee et al., 2011) and more recently
are based on station data from Met Éireann’s rainfall network       ERA5 (1950–present; 31 km).
– the identification of changes in Irish precipitation patterns,       Regional reanalysis and dynamical downscaling are two
whether they be driven by natural variability or man-made           methods often used to achieve higher resolution (and over-
climate change, is particularly important to the country with       come the associated computational cost). Both methods
recent projections pointing to an increased likelihood of sum-      make use of forcing by global reanalysis data at the bound-
mer droughts and winter flooding (Nolan et al., 2013a, b).          aries, with the former assimilating regional data and the latter
Unfortunately, gridded datasets based on station observations       making use of nested domains (without data assimilation).
come with numerous caveats as detailed by Prein and Gobiet          In recent years, numerous regional reanalyses and down-
(2017): they may not be particularly representative in regions      scaled products have been published – two examples of the

Published by Copernicus Publications.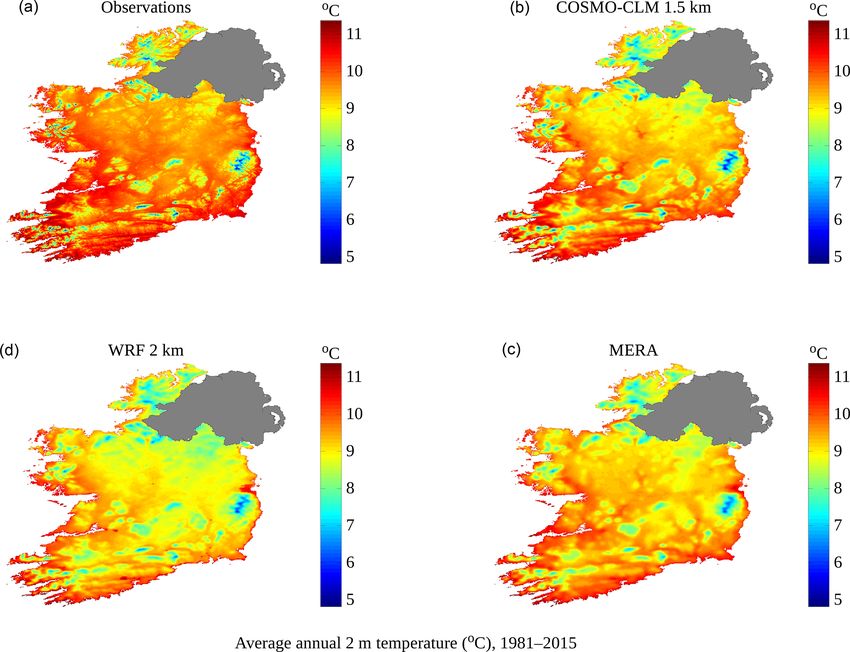
264                               J. Flanagan et al.: Towards a definitive historical high-resolution climate dataset for Ireland

former being HIRLAM (1979–2014; 22 km; Dahlgreen et
al., 2016) and COSMO-REA6 (1997–2004; 6 km; Bollmeyer
et al., 2015) whilst two examples of the latter are described
in Lucas-Picher et al. (2012) and Dasari and Challa (2015).
There are both advantages and disadvantages to the down-
scaling approach: downscaling can offer both finer detail
and less computational cost than regional reanalysis (Kana-
mitsu and Kanamaru, 2007); errors are cascaded with new
errors introduced through the flow of information at the
boundaries. There are however, many examples that illus-
trate the method’s ability to simulate precipitation (Kendon
et al., 2012; Lucas-Picher et al., 2012), near-surface temper-
ature (Di Luca et al., 2016) and winds (Feser et al., 2011) at
high resolution.
   Although there are numerous high-resolution regional re-
analysis datasets available, up until recently (2017), there
have been none that cover Ireland at spatial resolutions
higher than 6 km. In 2017, Met Éireann completed a 36-year
simulation (MÉRA) at 2.5 km resolution for the period 1981–
2016 (Gleeson et al., 2017). The MÉRA datasets, which are
stored as a series of 3 and 33 h forecasts, have been archived
by Met Éireann at 1 h intervals. A full description of the
                                                                     Figure 1. The nested domains used for the COSMO-CLM (a, c, e)
available data and some associated preliminary uncertainty
                                                                     and WRF (b, d, f) model runs showing model topography at three
estimates are given in Whelan et al. (2017) and Gleeson et
                                                                     spatial resolutions; 18 km (a, b), 6 km (c, d) and 2 km (e, f).
al. (2017).
   Additionally, in 2017, two high-resolution simulations of
the Irish Climate, covering the period 1981–2016, were
                                                                     2     Model setups and outputs
completed by the Irish Centre for High-End Computing
(ICHEC). The simulations were achieved by downscaling                2.1    Model setups
ERA-Interim data using the RCMs; the Weather Research
and Forecasting model (WRF v3.7.1) (Skamarock et al.,                Both the ICHEC WRF and COSMO-CLM RCM simulations
2008) and COSMO-CLM5 (Rockel et al., 2008). The RCMs                 were performed utilising nested domains with 18, 6, and
were run at 2 and 1.5 km spatial resolution respectively, with       2 km (WRF) or 1.5 km (COSMO-CLM) resolutions. Figure 1
two additional 6 and 18 km simulations for both models. The          illustrates the spatial coverage and topography of the three
data produced by each ICHEC reanalysis has been archived             COSMO-CLM and WRF domains. The WRF 18 km domain
at 1 h intervals. Although the MÉRA resolution is lower than         is composed of a 176 × 183 grid with latitudinal extent 36.76
those of the two ICHEC simulations, it does have the ad-             to 67.56◦ N and longitudinal extent 42.15◦ W to 24.15◦ E,
vantage of data assimilation (optimal interpolation for sur-         the 6 km domain is on a 216 × 210 grid with latitudinal ex-
face parameters, 3DVAR assimilation for upper-air parame-            tent 47.74 to 59.52◦ N and longitudinal extent 17.78◦ W to
ters). Together, the three datasets constitute a first step toward   4.72◦ E and the 2 km domain is on a 216 × 273 grid with
the production of definitive, high-resolution, gridded climate       latitudinal extent 50.81 to 55.77◦ N and longitudinal extent
datasets for Ireland.                                                11.57 to 4.71◦ W. The three COSMO-CLM domains are only
   In Sect. 2, a description of the model setup for each of          slightly larger than the WRF domains: 18 km on a 188 × 188
the ICHEC simulations is given and a description of the cli-         grid with latitudinal extent 35.51 to 68.36◦ N and longitudi-
mate variables archived at ICHEC is provided. In Sect. 3, un-        nal extent 45.54◦ W to 27.26◦ E; 6 km on a 245 × 245 grid
certainty estimates (error, standard deviation and mean abso-        with latitudinal extent 46.84 to 60.45◦ N and longitudinal ex-
lute error) utilising station observations are assigned to some      tent 20.16◦ W to 5.76◦ E; and 1.5 km on a 328 × 398 grid
of the basic parameters (precipitation, 2 m temperature, 10 m        with latitudinal extent 50.64 to 56.04◦ N and longitudinal ex-
wind speeds and mean sea-level pressure). Finally, in Sect. 4,       tent 11.93 to 4.11◦ W. The 18 km simulations were driven
the results and plans for future work are discussed.                 at the boundaries by ERA-Interim reanalysis data, produced
                                                                     by ECMWF at 80 km resolution, with all outputs (Sect. 2.2)
                                                                     from each individual nested domain (for both COSMO-CLM
                                                                     and WRF) archived at hourly intervals.
                                                                        The WRF model used here (v3.7.1) comes with topogra-
                                                                     phy data at four resolutions (10, 5, 2 and 0.5 arcmin) that

Adv. Sci. Res., 15, 263–276, 2019                                                             www.adv-sci-res.net/15/263/2019/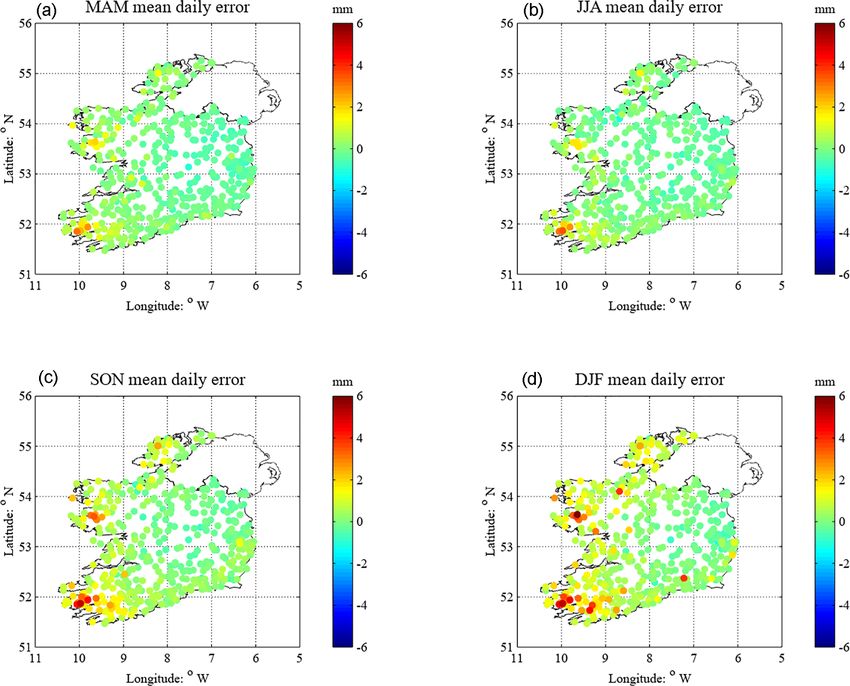
J. Flanagan et al.: Towards a definitive historical high-resolution climate dataset for Ireland                                265

can be used to construct terrain data for the model grid.           commonly-used parameters: 2 m temperature, 10 m wind
Given that some climate variables (e.g. winds) are affected by      speed, pressure and precipitation. All estimates are at the
nearby topography, it was realised that underlying data with        hourly time scale, with the inclusion of mean daily error for
much finer resolution was required. Therefore, a 1 arcsec to-       precipitation, and are based on observations from Met Éire-
pography dataset (The Advanced Spaceborne Thermal Emis-             ann’s 25 synoptic stations (hourly) and 484 station rainfall
sion and Reflection Radiometer (ASTER) Global Digital El-           network (daily/monthly). The results of these analyses are
evation Model (GDEM)) was obtained and incorporated into            presented in Sect. 3.1–3.4. Additionally, preliminary analy-
the WRF simulations using the WRF Preprocessing System              ses of less commonly-used parameters (10 cm soil tempera-
(WPS). By contrast, the COSMO-CLM model already in-                 ture, CAPE 3 km, Showalter and surface lifted indices) have
cludes the high-resolution ASTER topography dataset as part         been performed utilising station and/or radiosonde data at ap-
of the preprocessing stage (ExtPAR).                                propriate timescales and are described in Sect. 3.5 and 3.6.
   Both models have numerous parameter schemes that can                Gridded datasets of observed daily (00:00–00:00 UTC)
potentially affect outputs. For instance, it is known that          temperature and (09:00–09:00 UTC) accumulated precipita-
the choice of WRF sub-grid orographic, flow blocking and            tion, at 1 km resolution, covering the Republic of Ireland for
gravity wave drag schemes can influence bias in 10 m                the period 1981–2015 have been obtained from Met Éire-
wind speeds, 2 m temperature and surface pressure (Koo et           ann and form part of a preliminary qualitative comparison
al., 2018). To ensure the most accurate options were em-            detailed below. Comprehensive details concerning the pro-
ployed, the results from several 1-month validation simula-         duction of these datasets are provided in Walsh (2017) (tem-
tions previously performed at ICHEC (Nolan et al., 2017)            perature) and Walsh (2016) (precipitation).
were utilised. Summaries of the individual model settings,             Additionally, hourly MÉRA precipitation and 2 m temper-
where different from the default option (or between different       ature data has been obtained for the same period. The MÉRA
resolutions) are given in Tables 1 and 2.                           data is contained within three-hour and 33 h forecast files
                                                                    (each containing hourly forecasts) and have been converted
2.2    Model outputs                                                to daily records in the following ways: for precipitation,
                                                                    records have been built utilising 33 h (accumulated precip-
All outputs from each of the 18 km, 6 km and highest reso-          itation) forecast files (thereby avoiding any negative impact
lution 2 km (WRF) and 1.5 km (COSMO-CLM) RCM simu-                  from spin-up through use of the 3 h forecast files) and con-
lations have been archived at hourly intervals by ICHEC. A          secutive subtractions of the 9 h forecast from the 33 h fore-
full listing of all climate parameters (and their relevant units)   cast for each day; for 2 m temperature, hourly values were
archived at ICHEC is given in Tables 3–5 (COSMO-CLM)                first obtained from the 3 h files, followed by daily averaging.
and 6–8 (WRF). The COSMO-CLM dataset is composed                    Daily records are relatively straightforward to derive from
of 48 surface/near-surface parameters (Table 3), two sub-           the COSMO-CLM and WRF temperature and precipitation
surface parameters at eight levels (Table 4) and three upper-       datasets – each daily record is simply the mean of hourly
air parameters at 10 heights (Table 5). The WRF dataset con-        values over the relevant 00:00–00:00 UTC period for temper-
tains 23 surface/near-surface parameters (Table 6), two sub-        ature, and the sum of hourly values over the relevant 09:00–
surface parameters at four levels (Table 7) and two upper-air       09:00 UTC period for precipitation. Annual records for the
parameters at five levels (Table 8).                                gridded observations and each of the three models are then
   The climate parameters presented here constitute the high-       easily obtained through summation (precipitation) and aver-
est (spatial) resolution, hourly dataset currently available for    aging (2 m temperature).
Ireland for the period 1981–2016 (data for 2017 is nearing             The average annual 2 m temperature and precipitation
completion and will soon be added to the dataset). Addi-            amounts, derived from each of the available gridded datasets
tionally, the datasets contain parameters that are currently        are shown in Figs. 2 and 3, respectively. For temperature, all
not available elsewhere (MÉRA or observations). These new           four datasets show similar spatial distribution – particularly
high-resolution parameters have potential for many applica-         (to-be-expected) cooler temperatures in the north and over
tions and will be of use to researchers from different fields.      mountains. However, there is a distinct warm region visible
For instance: hydrology (surface and subsurface runoff);            over the midlands that diminishes in strength as we move
wind energy (air density at turbine heights); extreme events        from the observations-based dataset and on to the COSMO-
(CAPE 3 km, Showalter index, surface lifted index); and             CLM, MÉRA and WRF datasets, in turn. For precipitation,
agriculture (soil temperature and moisture content at four          all four datasets again show similar spatial distribution with
(WRF) and eight (COSMO-CLM) levels).                                higher rainfall amounts in the west and over mountains,
                                                                    with particularly strong agreement between the observations-
3     Parameter verification                                        based and WRF datasets in these regions. Additionally, each
                                                                    of the three model datasets show greater agreement in east-
Basic uncertainty estimates (error, standard deviation and          ern regions – there is a drier trend in the observations dataset
mean absolute error) have been calculated for the more

www.adv-sci-res.net/15/263/2019/                                                              Adv. Sci. Res., 15, 263–276, 2019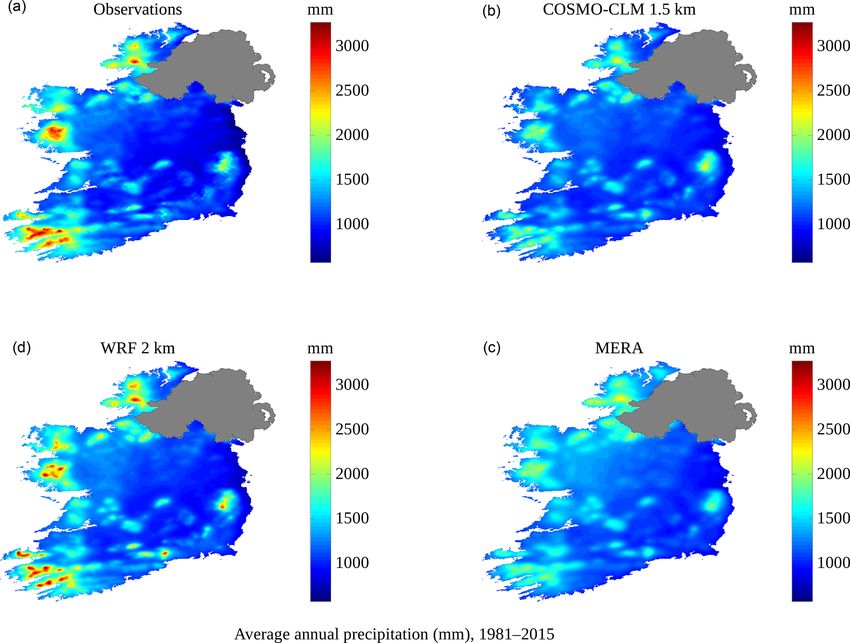
266                                   J. Flanagan et al.: Towards a definitive historical high-resolution climate dataset for Ireland

Table 1. Namelist options used for each of the three COSMO-CLM simulations.

               COSMO-CLM Option                                                     Namelist         1.5 km       6 km     18 km
               Time Step                                                            dt               12           50       120
               Number of Soil Levels                                                ke_soil          8            8        8
               Number of Vertical Levels                                            ke_tot           40           40       40
               Interval between calls to radiation scheme (in hours)                hincrad          0.125        0.25     0.33
               Interval between calls to convection scheme (no. of time steps)      ninconv          4            2        1
               Moist Convection Scheme                                              itype_conv       3            0        0
               Microphysics Parameterisation Scheme                                 itype_gscp       4            4        3
               Subgrid Scale Orography                                              lsso             False        True     True
               Aerosol Option                                                       itype_aerosol    2            2        2
               Solar Surface Albedo                                                 itype_albedo     2            2        2

Table 2. Namelist options used for each of the three WRF simulations.

                      WRF Option                      namelist               Physics Scheme    2 km        6 km    18 km
                      Adaptive Time Step              max_time_step          n/a                    19       57      171
                      Number of Soil Levels           num_soil_layers        n/a                     4        4        4
                      Number of Vertical Levels       e_vert                 n/a                    50       50       50
                      Microphysics                    mp_physics             WSM6                    6        6        6
                      PBL Scheme                      bl_pbl_physics         YSU                     1        1        1
                      Convective Scheme               cu_physics             Kain–Fritsch            0        1        1
                      Shortwave Radiation             ra_sw_physics          RRTMG                   4        4        4
                      Longwave Radiation              ra_lw_physics          RRTMG                   4        4        4
                      Land Surface Model              sf_surface_physics     Noah                    2        2        2

                    n/a: not applicable.

that is not as evident in the COSMO-CLM, WRF and MÉRA                      the performance of each model. Overall, both COSMO-CLM
datasets.                                                                  and WRF display somewhat similar error, with WRF slightly
                                                                           more likely to be within 1 ◦ C of observed values. Except for
                                                                           the error range [−2, −1), WRF is consistently more likely
3.1   Hourly 2 m temperature                                               than COSMO-CLM to underestimate 2 m temperature. In
                                                                           turn, COSMO-CLM shows a higher frequency of large pos-
Hourly station observations of air temperature have been ob-               itive error. Additionally, whilst the mean errors and standard
tained from Met Éireann. In total, there are 25 of these sta-              deviations of both models are similar for the left-most er-
tions with varying record lengths available. The COSMO-                    ror range (−4.83 and 0.82 ◦ C (COSMO-CLM) and −4.85
CLM and WRF datasets have been processed so that a com-                    and 0.81 ◦ C (WRF) respectively) COSMO-CLM produces
parison with these observations could be made – the 2 m                    larger positive outliers (mean error = 5.38 ◦ C and standard
temperature data is already stored in hourly files and data                deviation = 1.33 ◦ C versus 5.10 and 1.10 ◦ C respectively, for
at the relevant station locations can be extracted immedi-                 WRF).
ately through (bilinear) interpolation. Overall values have
been determined by treating all available station data as a
single dataset. The (mean) error values found are −0.18 ◦ C                3.2   Hourly 10 m wind speeds
(COSMO-CLM) and −0.31 ◦ C (WRF), whilst the overall
standard deviations are 1.79 ◦ C (COSMO-CLM) and 1.71 ◦ C                  Hourly 10 m wind speed synoptic station observations have
(WRF). Additionally, the mean absolute error (MAE) has                     also been obtained from Met Éireann. For both WRF and
been calculated (using the entire station dataset) – the val-              COSMO-CLM, the 10 m U and V wind components have
ues found are 1.34 ◦ C (COSMO-CLM) and 1.31 ◦ C (WRF).                     been found at each station location through bilinear
                                                                                                                            √ interpo-
For comparison, an identical analysis of hourly MÉRA 2 m                   lation and used to calculate 10 m wind speeds ( U 2 + V 2 )
temperature yields the values −0.10 ◦ C (mean error), 1.09 ◦               which are then compared to observations. Overall mean
(standard deviation) and 0.81 ◦ C (MAE).                                   error values found are 0.85 m s−1 (COSMO-CLM) and
   In Fig. 4, the 2 m temperature error distributions for                  0.07 m s−1 (WRF), whilst the overall standard deviations
COSMO-CLM and WRF are shown to provide insight into                        are 2.30 m s−1 (COSMO-CLM) and 2.24 m s−1 (WRF). The

Adv. Sci. Res., 15, 263–276, 2019                                                                        www.adv-sci-res.net/15/263/2019/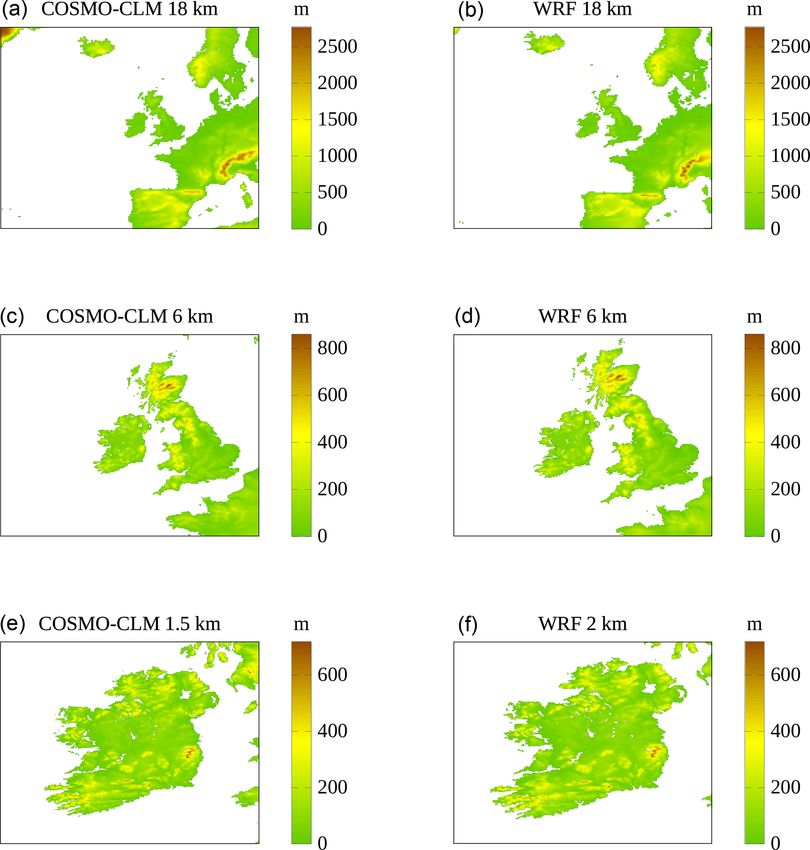
J. Flanagan et al.: Towards a definitive historical high-resolution climate dataset for Ireland                                   267

Table 3. COSMO-CLM surface or near-surface parameters (with units) archived by ICHEC at 1 h intervals.

            Variable                                                                                             Unit
            Precipitation rate                                                                                   kg m−2 s−1
            Large scale rainfall, Convective rainfall, Large scale snowfall, Large scale graupel,                kg m−2
            Total precipitation amount, Surface runoff, Surface evaporation, Subsurface runoff,
            Vertical integrated water vapour, Vertical integrated cloud ice, Vertical integrated cloud water
            Total cloud cover, Low cloud cover, Medium cloud cover, High cloud cover, Surface albedo             0–1
            Surface temperature, 2 m temperature, 2 m dew point temperature,                                     K
            Snow surface temperature, Surface lifted index, Showalter index
            Surface pressure, Mean sea level pressure                                                            Pa
            U and V components of 10 m wind, Maximum 10 m wind speed                                             m s−1
            Surface net downward shortwave (SW) radiation, Average surface net downward SW radiation,            W m−2
            Averaged surface diffuse downward SW radiation, Averaged surface diffuse upward SW radiation,
            Averaged downward longwave (LW) radiation at the surface, Averaged upward LW radiation
            at the surface, Averaged surface net downward LW radiation, Averaged surface photosynthetic
            active radiation, Surface latent heat flux, Surface sensible heat flux
            Surface roughness length, Thickness of snow, Height of freezing level                                m
            Surface specific humidity, 2 m specific humidity                                                     kg kg−1
            2 m relative humidity                                                                                %
            CAPE 3 km                                                                                            J kg−1

Figure 2. Average annual temperature (◦ C) for the period 1981–2015. Shown are the values found from (working clockwise): (a) gridded
observations provided by Met Éireann; (b) the COSMO-CLM 1.5 km dataset; (c) the MÉRA dataset; (d) the WRF 2 km dataset.

www.adv-sci-res.net/15/263/2019/                                                                     Adv. Sci. Res., 15, 263–276, 2019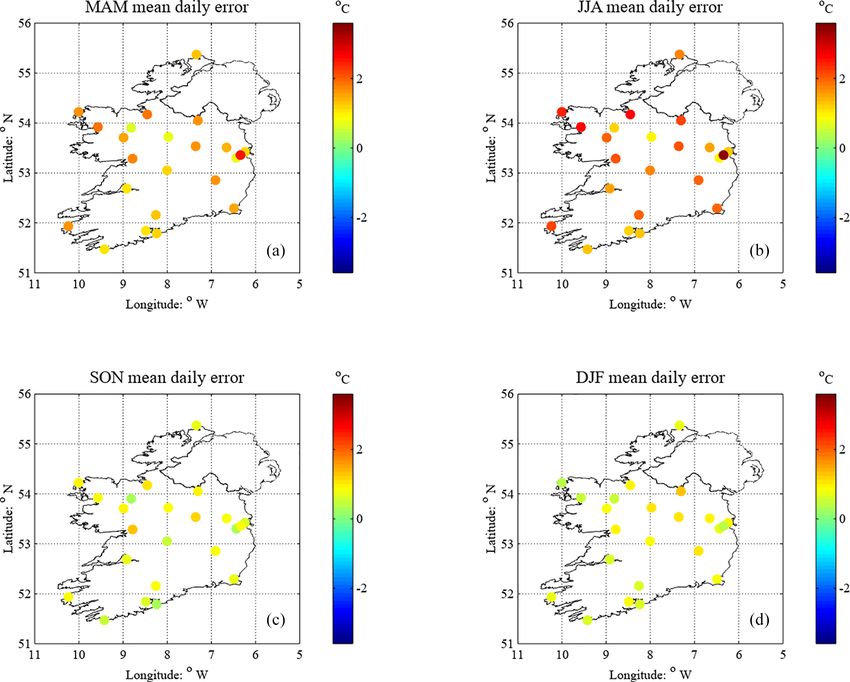
268                                 J. Flanagan et al.: Towards a definitive historical high-resolution climate dataset for Ireland

Figure 3. Average annual rainfall (mm) over the period 1981–2015. Shown are the values found from (working clockwise): (a) gridded
observations provided by Met Éireann; (b) the COSMO-CLM 1.5 km dataset; (c) the MÉRA dataset; (d) the WRF 2 km dataset.

Table 4. COSMO-CLM sub-surface parameters (with units) at
8 levels (0.005, 0.02, 0.06, 0.18, 0.54, 1.62, 4.86 and 14.58 m)
archived by ICHEC at 1 h intervals.

                     Variable               Unit
                     Soil temperature       K
                     Soil water content     m

Table 5. COSMO-CLM upper-air parameters (with units) at 10
heights (20, 40, . . ., 200 m) archived by ICHEC at 1 h intervals.

             Variable                           Unit
             U and V components of wind         m s−1
             Air density                        kg m−3                Figure 4. Bar graph showing the 2 m temperature error distribu-
                                                                      tions for the COSMO-CLM (in blue) and WRF (in red) models,
                                                                      derived through comparison with available hourly station observa-
                                                                      tions (3 344 194 in total).
overall MAEs found are 1.89 m s−1 (COSMO-CLM) and
1.67 m s−1 (WRF). For comparison, an identical analysis of
hourly MÉRA 10 m wind speeds yields the values 0.29 m s−1             similar mean errors (approximately −5.5 and 5.3 m s−1 , re-
(mean error), 1.65 m s−1 (standard deviation) and 1.27 m s−1 .        spectively) and standard deviations (1.5 and 1.3 m s−1 , re-
   Figure 5 shows the 10 m wind speed error distributions             spectively).
found for COSMO-CLM and WRF. It can be readily seen
that the COSMO-CLM distribution exhibits greater fre-                 3.3   Hourly sea-level pressure
quency of error at higher ranges. An opposite, but weaker,
behaviour is evident for negative ranges where WRF shows              A similar analysis to that in Sect. 3.1 and 3.2 has been per-
higher frequencies. At the extremes (less than −4 m s−1 and           formed for sea-level pressures utilising synoptic station data
greater than 4 m s−1 ) both COSMO-CLM and WRF exhibit                 from Met Éireann. The overall (mean) error values found are

Adv. Sci. Res., 15, 263–276, 2019                                                               www.adv-sci-res.net/15/263/2019/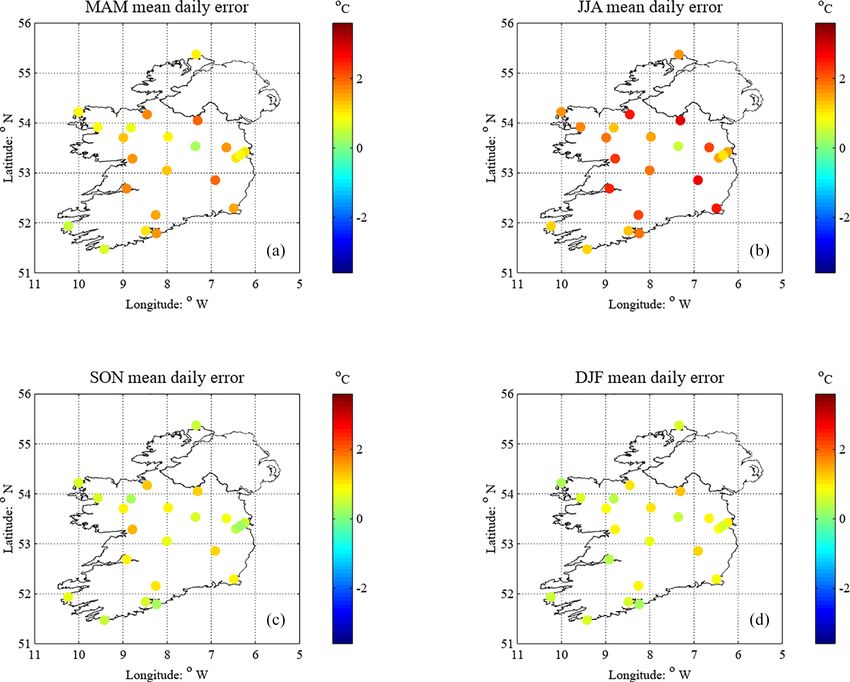
J. Flanagan et al.: Towards a definitive historical high-resolution climate dataset for Ireland                                     269

Table 6. WRF surface or near-surface parameters (with units) archived by ICHEC at 1 h intervals.

         Variable                                                                                                      Unit
         Total precipitation, Accumulated snowfall                                                                     mm
         Total cloud fraction                                                                                          0–1
         Surface temperature                                                                                           K
         Surface pressure, Sea level pressure                                                                          Pa
         2 m temperature                                                                                               ◦C

         Time varying roughness height, Physical snow depth                                                            m
         Water vapour mixing ratio at 2 m                                                                              kg kg−1
         Relative humidity at 2 m                                                                                      %
         U and V components of wind at 10 m, Maximum 10 m wind speed at previous output time, Friction velocity        m s−1
         Air density at lowest model level                                                                             kg m3
         Shortwave (SW) flux downward at surface instant, SW flux downward at surface accumulated,                     W m−2
         Bucket SW flux downward at surface accumulated, Ground heat flux
         Liquid path water, Ice path water, Water evaporation flux at surface                                          kg m−2

Table 7. WRF sub-surface parameters (with units) at 4 levels (5,
25, 75 and 150 cm below the surface) archived by ICHEC at 1 h
intervals.

                    Variable           Unit
                    Soil temperature   K
                    Soil moisture      m3 m−3

Table 8. WRF upper-air parameters (with units) at 5 heights (40,
60, 80, 100, 120 m) archived by ICHEC at 1 h intervals.

             Variable                           Unit
             U and V components of wind         m s−1
                                                                        Figure 5. Bar graph showing the 10 m wind speed error distribu-
                                                                        tions for the COSMO-CLM (in blue) and WRF (in red) models,
                                                                        derived through comparison with available hourly station observa-
                                                                        tions (3 448 209 in total).
−0.87 hPa (COSMO-CLM) and −0.20 hPa (WRF), whilst
the overall standard deviations are 2.56 hPa (COSMO-CLM)
and 2.39 hPa (WRF). The overall MAEs found are 1.96 hPa                 3.4     Precipitation
(COSMO-CLM) and 1.69 hPa (WRF). By comparison, an
identical analysis of hourly MÉRA sea-level pressures gives             An analysis of hourly precipitation amounts has been per-
the values 0.03 hPa (mean error), 0.51 hPa (standard devia-             formed, again using synoptic station data sourced from Met
tion) and 0.37 hPa (MAE).                                               Éireann. Both COSMO-CLM and WRF show remarkably
   The COSMO-CLM and WRF error distributions are                        similar error and standard deviations – overall error values
shown in Fig. 6, where COSMO-CLM has greater frequency                  are less than 0.01 mm and overall standard deviations are
at all negative ranges, whilst an opposite but weaker ef-               0.63 mm, for both models. Additionally, the MAEs found are
fect occurs at positive ranges. At extreme ranges (less than            0.18 mm for both models. By comparison, an identical anal-
−4 hPa and greater than 4 hPa) both models exhibit similar              ysis performed for hourly MÉRA precipitation results in the
mean errors (−6 and 6 hPa, respectively) and standard devi-             values: < 0.01 mm (error), 0.55 mm (standard deviation) and
ations (2.2 and 2.1 hPa, respectively).                                 0.16 mm (MAE).

www.adv-sci-res.net/15/263/2019/                                                                   Adv. Sci. Res., 15, 263–276, 2019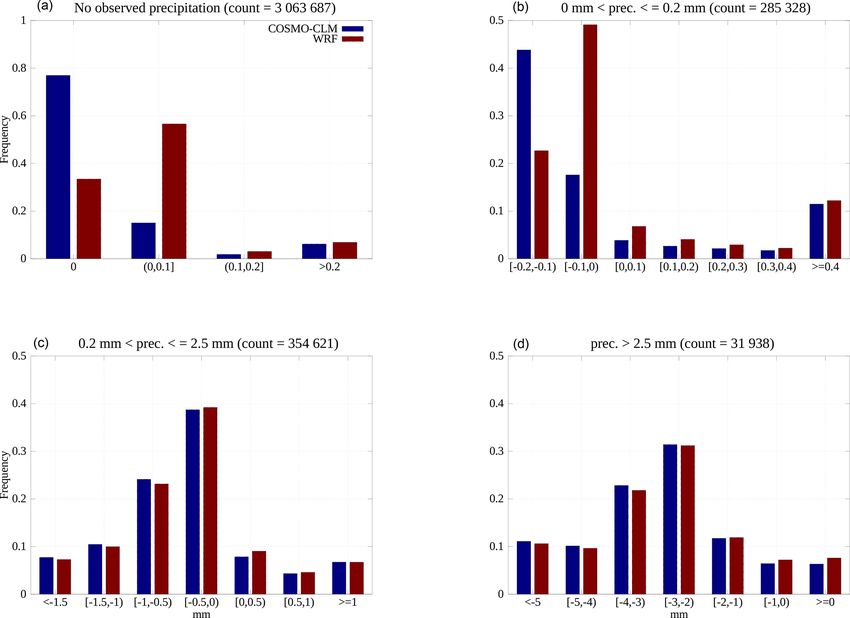
270                               J. Flanagan et al.: Towards a definitive historical high-resolution climate dataset for Ireland

                                                                        Heavy precipitation is relatively rare in Ireland – the over-
                                                                     all observed count (31 938) is an order of magnitude lower
                                                                     than that of the other two wet categories. For this category,
                                                                     both models typically under-predict, with WRF perform-
                                                                     ing only marginally better than COSMO-CLM – the overall
                                                                     mean errors and standard deviations are −2.95 and 2.33 mm
                                                                     for COSMO-CLM and −2.84 and 2.32 mm for WRF. In-
                                                                     deed, the frequency of error in the range ≥ 0 mm is less
                                                                     than 0.1 for both models, with WRF performing slightly
                                                                     better – mean errors and standard deviations are 1.88 and
                                                                     2.37 mm for COSMO-CLM and 1.63 and 1.98 mm for WRF.
                                                                     The frequencies, mean error (−7 mm) and standard deviation
                                                                     (2.5 mm) of large negative error are similar for both mod-
                                                                     els, with WRF exhibiting only slightly lower frequency than
Figure 6. Bar graph showing the sea-level pressure error distribu-   COSMO-CLM.
tions for the COSMO-CLM (in blue) and WRF (in red) models,              Daily precipitation amounts have been obtained from Met
derived through comparison with available hourly station observa-    Éireann’s 484 station rainfall network and used to esti-
tions (3 676 703 in total).                                          mate mean 24 h accumulation errors for both COSMO-CLM
                                                                     (Fig. 8) and WRF (Fig. 9). Overall mean errors, standard de-
                                                                     viations and MAEs found for COSMO-CLM are −0.23, 5.94
   Figure 7 presents the error distributions for both mod-           and 2.97 mm, respectively, whilst for WRF the respective
els for four different observed precipitation categories: dry        values found are 0.10, 5.41 and 2.69 mm. By comparison,
(0 mm), light (up to 0.2 mm), moderate (0.2–2.5 mm) and              an identical analysis of MÉRA produces the values −0.09,
heavy (> 2.5 mm).                                                    4.59 and 2.28 mm. For both COSMO-CLM and WRF, the
   For no observed precipitation (Fig. 7, top-left panel), the       largest errors occur over regions with complex topography
count (3 063 887) is approximately 4.6 times higher than all         (mountainous regions in the west) and during autumn and
other categories combined (671 887) – it does not rain as of-        winter months when rainfall amounts tend to be largest. Both
ten as is commonly perceived. In this category, COSMO-               models tend to under-predict during drier spring and sum-
CLM has much higher frequency of correct predictions.                mer months – the mean errors found for WRF are −0.45 and
However, the overall error and standard deviation of both            −0.26 mm respectively, whilst for COSMO-CLM, the val-
models are similar (0.07 and 0.4 mm, respectively). This is          ues found are −0.002 and −0.01 mm. Although COSMO-
a result of COSMO-CLM producing larger (although fewer)              CLM shows better accuracy than WRF during drier seasons,
errors than WRF – the means for the highest error range              the reverse is true during autumn and winter, when rain-
(> 0.2 mm) are 1 and 0.9 mm, respectively.                           fall amounts are higher and both models over-predict – the
   For light rainfall (Fig. 7, top-right panel), both models         mean values found for WRF are 0.29 and 1.20 mm respec-
display higher frequency of negative error, with WRF ex-             tively, whilst for COSMO-CLM the values found are 0.43
hibiting higher frequency of low error. However, both show           and 1.45 mm.
similar frequencies, means (1.3 mm) and standard deviations
(1.3 mm) at the extreme error range (≥ 0.4 mm) which con-
tribute to similar overall errors (> 0.1 mm) and standard de-        3.5   10 cm soil temperature
viations (0.65 mm) for this category.
   Both models exhibit similar error distributions for the           An analysis of daily mean 10 cm soil temperatures has been
moderate (Fig. 7, bottom-left panel) and heavy (Fig. 7,              performed through comparison with daily values from 23
bottom-right panel) precipitation categories. For moderate           Met Éireann stations. Simple linear vertical interpolation
precipitation, both models under-predict with the majority (∼        (cdo command intlevel, Schulzweida, 2018) has been used
0.85) of error values falling in the combined range [−1 mm,          to generate model data at this level from the archived lev-
0 mm). The overall errors and standard deviations for this cat-      els (Tables 4 and 7). Horizontal bilinear interpolation to the
egory are similar: −0.38 and 1.05 mm (COSMO-CLM) and                 station locations has then been applied for all stations sur-
−0.35 and 1.01 mm (WRF). The frequencies of large neg-               rounded by land points. Where a station is next to a sea
ative and positive error are both less than 0.1. Both models         point, a simple nearest-neighbour approach was taken. For
exhibit similar mean errors and standard deviations for the          those stations where bilinear interpolation was possible, the
error range < 1.5 mm: −1.9 and 0.27 mm respectively. For             nearest-neighbour method was tested and compared – abso-
the error range ≥ 1 mm, the corresponding values are slightly        lute differences in mean temperature values were small (typ-
different: 2.35 and 1.8 mm (COSMO-CLM) and 2.23 and                  ically less than 0.1 ◦ C) and usually in favour of the bilin-
1.6 mm (WRF).                                                        ear method. The overall daily errors, standard deviations and

Adv. Sci. Res., 15, 263–276, 2019                                                              www.adv-sci-res.net/15/263/2019/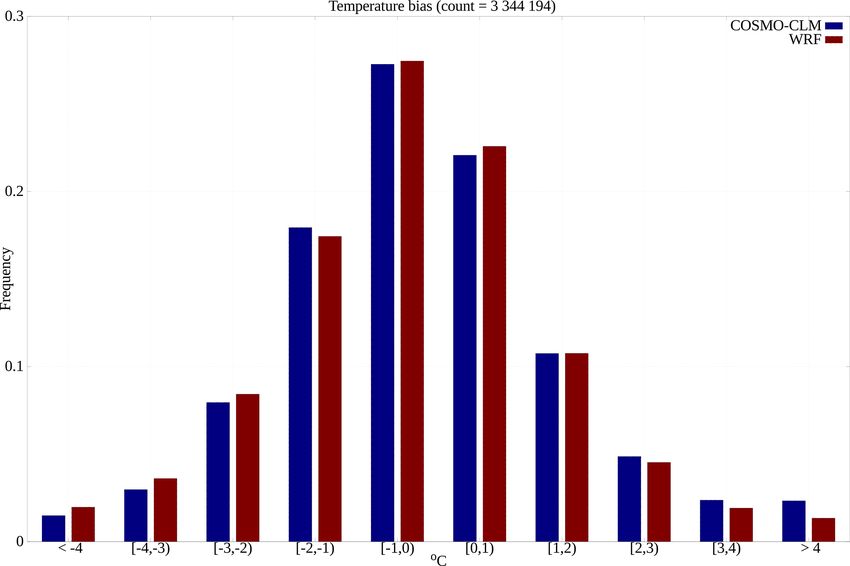
J. Flanagan et al.: Towards a definitive historical high-resolution climate dataset for Ireland 271
Figure 7. Bar graphs showing the precipitation error distributions found for the COSMO-CLM (in blue) and WRF (in red) models and cate-
gorised according to observed hourly station amounts. (a) No precipitation; (b) light precipitation (0 mm, 0.2 mm]; (c) moderate precipitation
(0.2 mm, 2.5 mm]; (d) heavy precipitation, > 2.5 mm.
MAEs found were 1.17, 1.26 and 1.37 ◦ C (COSMO-CLM) 3.6 CAPE 3 km, Showalter and surface lifted indices
and 1.01, 1.16 and 1.18 ◦ C (WRF).
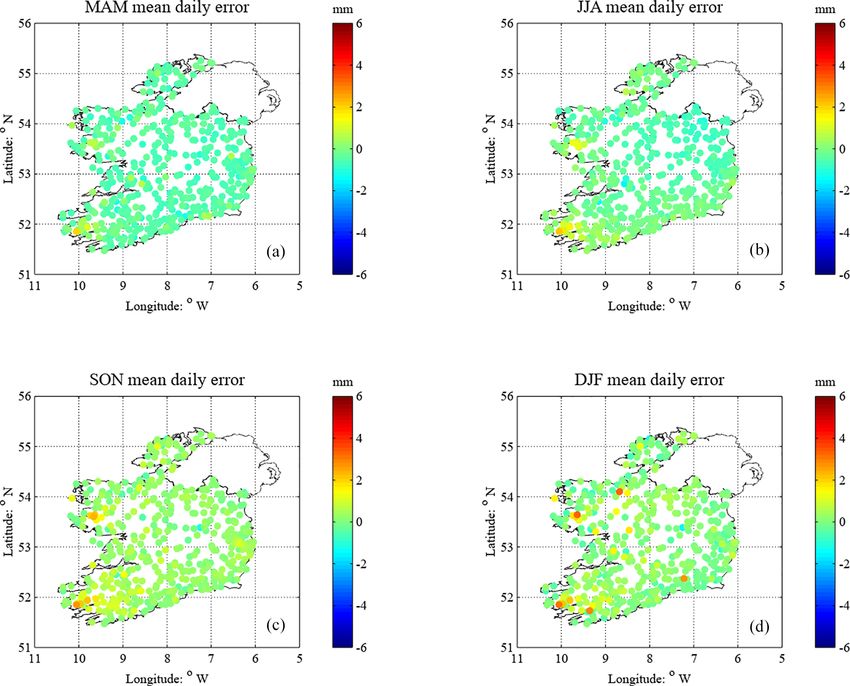
The mean daily errors per season for each station are A preliminary analysis of COSMO-CLM parameters that are
shown in Figs. 10 (COSMO-CLM) and 11 (WRF). Both potentially of interest to researchers of weather extremes
models exhibit positive mean error for each season (MAM, has been conducted. Observational data for these parame-
JJA, SON, DJF) with least error during colder seasons: ters are both rare and difficult to obtain. However, radiosonde
(1.34, 1.79, 0.76, 0.78 ◦ C) COSMO-CLM; (1.08, 1.62, 0.67, data has been obtained for two locations in Ireland: Valentia
0.68 ◦ C) WRF. By comparison, Gleeson et al. (2017) (their and Castor Bay. The Valentia data covers the period 1981–
Fig. 8a) show lower mean error over the equivalent time pe- present, whilst the Castor Bay data covers the period 2003–
riods, albeit for 20 cm soil temperature, with consistent over- present. Typically, the soundings are recorded every 6 hours
(under-) prediction during winter (summer) months. beginning at midnight on each day.
The standard deviations found were (1.47, 1.92, 1.08, For CAPE 3 km, the overall errors, standard deviations and
1.01 ◦ C) for COSMO-CLM and (1.25, 1.72, 0.85, 0.88 ◦ C) MAEs found for Valentia are 2.31, 47.5 and 2.31 J kg−1 , re-
for WRF whilst the MAEs found were (1.19, 1.35, 1.13, spectively. For Castor Bay, the equivalent values are −0.68,
1.07 ◦ C) for COSMO-CLM and (1.20, 1.33, 0.87, 0.93 ◦ C) 34.9 and 10.33 J kg−1 . The Showalter index results at Valen-
for WRF. The two models show similar MAEs during spring tia are −0.05, 3.51 and 2.58 whilst at Castor Bay the values
and summer months, whereas WRF shows greater accuracy are quite similar: 0.43, 3.36 and 2.52. The surface lifted in-
during autumn and winter months when temperatures are dex results are 0.06, 3.03 and 2.27 (Valentia) and 1.08, 3.09
lower. From Figs. 10 and 11, there does not appear to be and 2.58 (Castor Bay).
a pattern to the spatial distribution of errors. However, this The error distributions for each parameter at Valentia and
could simply be due to the lack of observational data avail- Castor Bay are shown in Figs. 12 and 13, respectively. For
able – 23 stations here compared to 484 for the rainfall anal- each parameter and location, the distributions typically have
ysis in Sect. 3.4. long tails – evidenced by the relatively large frequencies at
the extremes of each as well as the means and standard devi-
ations found for these ranges. For CAPE 3 km at Valentia, the
www.adv-sci-res.net/15/263/2019/ Adv. Sci. Res., 15, 263–276, 2019272 J. Flanagan et al.: Towards a definitive historical high-resolution climate dataset for Ireland Figure 8. COSMO-CLM daily precipitation error (by season) for the period 1981–2015, found utilising Met Éireann daily station data for: (a) Spring (MAM); (b) Summer (JJA); (c) Autumn (SON); (d) Winter (DJF). Figure 9. WRF daily precipitation error (by season) for the period 1981–2015, found utilising Met Éireann daily station data for: (a) Spring (MAM); (b) Summer (JJA); (c) Autumn (SON); (d) Winter (DJF). Adv. Sci. Res., 15, 263–276, 2019 www.adv-sci-res.net/15/263/2019/
J. Flanagan et al.: Towards a definitive historical high-resolution climate dataset for Ireland                             273

Figure 10. COSMO-CLM mean daily 10 cm soil temperature error per season found through comparison with observations from 23 Met
Éireann station data for: (a) Spring (MAM); (b) Summer (JJA); (c) Autumn (SON); (d) Winter (DJF).

Figure 11. WRF mean daily 10 cm soil temperature error per season found through comparison with observations from 23 Met Éireann
station data for: (a) Spring (MAM); (b) Summer (JJA); (c) Autumn (SON); (d) Winter (DJF).

www.adv-sci-res.net/15/263/2019/                                                               Adv. Sci. Res., 15, 263–276, 2019
274                              J. Flanagan et al.: Towards a definitive historical high-resolution climate dataset for Ireland

                                                                   4   Conclusions

                                                                   We have described the model setups and the (hourly) climate
                                                                   parameters output from two high-resolution downscaled sim-
                                                                   ulations (using the RCMs COSMO-CLM5 and WRF v3.7.1)
                                                                   of the Irish climate that cover the period 1981–2016 and
                                                                   which have recently been completed and archived by re-
                                                                   searchers at ICHEC. These parameters represent the highest-
                                                                   resolution, hourly climate datasets that are currently avail-
                                                                   able for Ireland for the period concerned. These new datasets
                                                                   contain parameters that are currently not available elsewhere:
                                                                   surface and subsurface runoff; air density at turbine heights;
                                                                   CAPE 3 km, Showalter index and surface lifted index; soil
                                                                   temperature and moisture content at four (WRF) and eight
                                                                   (COSMO-CLM) levels. Additional data that covers 2017 will
                                                                   soon be added to the datasets.
                                                                      Preliminary analysis shows that for annual 2 m tempera-
Figure 12. Error distributions for three COSMO-CLM parameters,     ture and precipitation, there is good agreement between the
found through comparison with Valentia radiosonde data. (a) Cape   ICHEC datasets and other available datasets (Met Éireann
3 km. (b) Showalter index. (c) surface lifted index.               1 km gridded observations and MÉRA). We have also pre-
                                                                   sented uncertainty estimates (error, standard deviation and
                                                                   MAE) for some of the basic parameters (2 m temperature,
                                                                   10 m winds, sea-level pressure and precipitation) and for
                                                                   several other lesser-used parameters: 10 cm soil temperature
                                                                   (COSMO-CLM and WRF); CAPE 3 km, Showalter index
                                                                   and surface lifted index (COSMO-CLM).
                                                                      Both COSMO-CLM and WRF show similar hourly er-
                                                                   ror and variance for 2 m temperature and precipitation, with
                                                                   WRF showing lower error and variance for both 10 m wind
                                                                   speeds and pressure. At daily time scales, WRF shows lower
                                                                   precipitation error during wetter seasons (autumn and win-
                                                                   ter) whilst the reverse is true during drier seasons. Also at
                                                                   daily time scales, WRF consistently shows lower 10 cm soil
                                                                   temperature error, both overall and for each season.
                                                                      Additionally, a preliminary analysis of CAPE 3 km,
                                                                   Showalter index and surface lifted index using radiosonde
                                                                   data from two locations (Valentia and Castor Bay) show
                                                                   low overall error for each parameter: 2.31 and −0.68 J kg−1
                                                                   (CAPE 3 km); −0.05 and 0.43 (Showalter index); 0.06 and
Figure 13. Error distributions for three COSMO-CLM parame-         1.08 (surface lifted index).
ters, found through comparison with Castor Bay radiosonde data.       The uncertainty estimates reported here for hourly 2 m
(a) Cape 3 km. (b) Showalter index. (c) Surface lifted index.      temperature, hourly and daily precipitation and hourly 10 m
                                                                   winds are comparable to those found for MÉRA. How-
                                                                   ever, those found for hourly pressure are considerably higher
respective values are −64.5 and 105.3 J kg−1 (< −15 range)         whilst an analysis of mean soil temperatures (albeit at
and 55.3 and 36.6 J kg−1 (> 15 range). At Castor Bay, the          10 cm rather than 20 cm) shows a different seasonal pattern
equivalent values found are −55.5 and 88.9 J kg−1 , and 49.0       (COSMO-CLM and WRF consistently over-estimate) to that
and 35.0 J kg−1 respectively. For Showalter index at Valen-        seen in Gleeson et al. (2017).
tia, the respective values are −7.7 and 2.4 (< −5 range) and          Ongoing (and future) work has been (will be) undertaken
6.7 and 1.9 (≥ 5 range). At Castor Bay, the equivalent values      to provide a more complete analysis of uncertainty for the
are similar: −7.7 and 2.5, and 6.6 and 1.6 respectively. Fi-       numerous climate parameters available at ICHEC, at vari-
nally, for Valentia surface lifted index, the respective values    ous spatial and temporal scales, utilising station (including
are −7.2 and 2.2 (< −5 range) and 6.5 and 1.8 (≥ 5 range),         wind turbine) and satellite (particularly solar) observations.
whilst at Castor Bay, the equivalent values are (again) simi-      Additionally, appropriate skill scores such as (but not limited
lar: −7.1 and 2.1, and 6.4 and 1.4 respectively.                   to) hit rate, false alarm rate, Hannsen–Kuiper skill score and

Adv. Sci. Res., 15, 263–276, 2019                                                           www.adv-sci-res.net/15/263/2019/
J. Flanagan et al.: Towards a definitive historical high-resolution climate dataset for Ireland 275
equitable threat score are/will be calculated for each model Dahlgreen, P., Landelius, T., Kallberg, P., and Gollvik, S.:
parameter. This analysis will also be applied to the MÉRA A high-resolution regional reanalysis for Europe. Part 1:
dataset as each parameter becomes available. Ultimately, the Three-dimensional reanalysis with the regional High-Resolution
aim is to provide researchers with a definitive gridded climate Limited-Area Model (HIRLAM), Q. J. Roy. Meteorol. Soc., 142,
dataset for Ireland. 2119–2131, https://doi.org/10.1002/qj.2807, 2016.
Dee, D. P., Uppala, S. M., Simmons, A. J., Berrisford, P., Poli,
P., Kobayashi, S., Andrae, U., Balmaseda, M. A., Balsamo, G.,
Bauer, P., Bechtold, P., Beljaars, A. C. M., van de Berg, L., Bid-
Data availability. There is currently no publicly available method
lot, J., Bormann, N., Delsol, C., Dragani, R., Fuentes, M., Geer,
for access to the COSMO-CLM and WRF datasets. However, de-
A. J., Haimberger, L., Healy, S. B., Hersbach, H., Hólm, E. V.,
tails on their future public release will appear on ICHEC’s website
Isaksen, L., Kållberg, P., Köhler, M., Matricardi, M., McNally,
(https://www.ichec.ie, last access: 1 April 2019) during 2019. Upon
A. P., Monge-Sanz, B. M., Morcrette, J.-J., Park, B.-K., Peubey,
request, the authors can provide access to the parameters described
C., de Rosnay, P., Tavolato, C., Thépaut, J.-N., and Vitart, F.: The
in Sect. 3.1–3.6.
ERA-Interim reanalysis: configuration and performance of the
data assimilation system, Q. J. Roy. Meteor. Soc., 137, 553–597,
https://doi.org/10.1002/qj.828, 2011.
Author contributions. JF composed this article and carried out Di Luca, A., Argüeso, D., Evans, J. P., de Elía, R., and
the analysis. PN carried out the COSMO and WRF simulations. Laprise, R.: Quantifying the overall added value of dy-
RMG and CW provided guidance and sample scripts during the namical downscaling and the contribution from different
analysis. spatial scales, J. Geophys. Res.-Atmos., 121, 1575–1590,
https://doi.org/10.1002/2015JD024009, 2016.
Feser, F., Rockel, B., von Storch, H., Winterfeldt, J., and Zahn, M.:
Competing interests. The authors declare that they have no con- Regional climate models add value to global model data: a review
flict of interest. and selected examples, B. Am. Meteorol. Soc., 92, 1181–1192,
2011.
Gibson, J., Kallberg, P.W., Uppala, S., Hernandez, A., Nomura, A.,
Special issue statement. This article is part of the special issue and Serrano, E.: ERA 15, Re-Analysis (ERA) Project Report Se-
“17th EMS Annual Meeting: European Conference for Applied Me- ries, ECMWF, 1997.
teorology and Climatology 2017”. It is a result of the EMS Annual Gleeson, E., Whelan, E., and Hanley, J.: Met Éireann high
Meeting: European Conference for Applied Meteorology and Cli- resolution reanalysis for Ireland, Adv. Sci. Res., 14, 49–61,
matology 2017, Dublin, Ireland, 4–8 September 2017. https://doi.org/10.5194/asr-14-49-2017, 2017.
Kanamitsu, M. and Kanamaru, H.: Fifty-seven-year reanalysis
downscaling at 10 km (CaRD10). Part I: system detail and val-
Acknowledgements. The authors would like to thank Emily idation with observations, J. Climate, 20, 5553–5571, 2017.
Gleeson and Eoin Whelan for facilitating the download of the Kendon, E., Roberts, N., Senior, C., and Roberts, M.: Realism of
MÉRA data described in this article. We would also like to thank rainfall in a very high-resolution regional climate model, J. Cli-
Seamus Walsh at Met Éireann for providing the gridded observation mate, 25, 5791–5806, 2012.
datasets. The research presented in this article was funded by the Koo, M.-S., Choi, H.-J., and Han, J.-Y.: A Parameterization of
EPA Research Programme 2014–2020 Research Fellowship Grant Turbulent-Scale and Mesoscale Orographic Drag in a Global At-
2016-CCRP-FS.28. mospheric Model, J. Geophys. Res.-Atmos., 123, 8400–8417,
2018.
Lucas-Picher, P., Wulff-Nielsen, M., Christensen, J., Aðalgeirs-
dóttir, G., Mottram, R., and Simonsen, S. B.: Very high
Review statement. This paper was edited by Andrea K. Kaiser-
resolution regional climate model simulations over Green-
Weiss and reviewed by Deborah Niermann, Per Unden, and one
land: Identifying added value, J. Geophys. Res., 117, D02108,
anonymous referee.
https://doi.org/10.1029/2011JD016267, 2012.
Nolan, P., Goodman, P., O’Sullivan, P., Sweeney, C., Gleeson, E.,
and McGrath, R.: Climate change: impacts on Irish temperatures,
in: Ireland’s climate: the road ahead, edited by: Gleeson, E., Mc-
References Grath, R., and Treanor, M., Met Éireann, Dublin, Ireland, 33–40,
2013a.
Bollmeyer, C., Keller, J. D., Ohlwein, C., Wahl, S., Crewell, S., Nolan, P., McGrath, R., Gleeson, E., and Sweeney, C.: Impacts of
Friederichs, P., Hense, A., Keune, J., Kneifel, S., Pscheidt, I., climate change on Irish precipitation, in: Ireland’s climate: the
Redl, S., and Steinke, S.: Towards a high-resolution regional re- road ahead, edited by: Gleeson, E., McGrath, R., and Treanor,
analysis for the European CORDEX domain, Q. J. Roy. Meteor. M., Met Éireann, Dublin, Ireland, 57–62, 2013b.
Soc., 141, 1–15, https://doi.org/10.1002/qj.2486, 2015. Nolan, P., O’Sullivan, J., and McGrath, R.: Impacts of climate
Dasari, H. P. and Challa, V. S.: A study of precipitation climatol- change on mid-twenty-first century rainfall in Ireland: a high-
ogy and its variability over Europe using an advanced regional resolution regional climate model ensemble approach, Int. J. Cli-
model (WRF), American Journal of Climate Change, 4, 22–39,
https://doi.org/10.4236/ajcc.2015.41003, 2015.
www.adv-sci-res.net/15/263/2019/ Adv. Sci. Res., 15, 263–276, 2019276 J. Flanagan et al.: Towards a definitive historical high-resolution climate dataset for Ireland matol., 37, 4347–4363, 2017, https://doi.org/10.1002/joc.5091, Walsh, S.: A Summary of Climate Averages for Ireland 1981–2010, 2017. Met Éireann, Dublin, Climatological Note No. 14, 2012. Prein, A. F. and Gobiet, P.: Impacts of uncertainties in European Walsh, S.: Long-term rainfall averages for Ireland, 1981–2010, Met gridded precipitation observations on regional climate analysis, Éireann, Dublin, Climatological Note No. 15, 2016. Int. J. Climatol., 37, 305–327, 2017. Walsh, S.: Long-term temperature averages for Ireland, 1981–2010, Rockel, B., Will, A., and Hense, A.: The regional climate model Met Éireann, Dublin, Climatological Note No. 16, 2017. COSMO-CLM (CCLM), Meteorol. Z., 17, 347–348, 2008. Whelan, E., Hanley, J., and Gleeson, E.: ’The MÉRA Data Archive’, Schulzweida, U.: Climate Data Operators (CDO) User Guide Ver- Met Éireann, 2017-08-04, Met Éireann Technical Note, 65, 2017. sion 1.9.3, Max Planck Institute for Meteorologie, available at: https://code.mpimet.mpg.de/projects/cdo/embedded/cdo.pdf (last access: 1 April 2019), 2018. Skamarock, W. C., Klemp, J. B., Dudhia, J., Gill, D. O., Barker, D. M., Duda, M. G., Huang, X. Y., Wang, W., and Powers, J. G.: A Description of the Advanced Research WRF Version 3, Na- tional Center for Atmospheric ResearchBoulder, Colorado, USA, NCAR Technical Note, NCAR/TN-475_STR, 2008. Uppala, S. M., Kållberg, P. W., Simmons, A. J., Andrae, U., Da Costa Bechtold, V., Fiorino, M., Gibson, J. K., Haseler, J., Her- nandez, A., Kelly, G. A., Li, X., Onogi, K., Saarinen, S., Sokka, N., Allan, R. P., Andersson, E., Arpe, K., Balmaseda, M. A., Bel- jaars, A. C. M., Berg, L. V. D., Bidlot, J., Bormann, N., Caires, S., Chevallier, F., Dethof, A., Dragosavac, M., Fisher, M., Fuentes, M., Hagemann, S., Hólm, E., Hoskins, B. J., Isaksen, L., Janssen, P. A. E. M., Jenne, R., Mcnally, A. P., Mahfouf, J.-F., Morcrette, J.-J., Rayner, N. A., Saunders, R. W., Simon, P., Sterl, A., Tren- berth, K. E., Untch, A., Vasiljevic, D., Viterbo, P., and Woollen, J.: The ERA-40 re-analysis, Q. J. Roy. Meteor. Soc., 131, 2961– 3012, https://doi.org/10.1256/qj.04.176, 2005. Adv. Sci. Res., 15, 263–276, 2019 www.adv-sci-res.net/15/263/2019/
You can also read