On the relationship between atmospheric rivers, weather types and floods in Galicia (NW Spain) - NHESS
←
→
Page content transcription
If your browser does not render page correctly, please read the page content below
Nat. Hazards Earth Syst. Sci., 18, 1633–1645, 2018
https://doi.org/10.5194/nhess-18-1633-2018
© Author(s) 2018. This work is distributed under
the Creative Commons Attribution 3.0 License.
On the relationship between atmospheric rivers,
weather types and floods in Galicia (NW Spain)
Jorge Eiras-Barca1 , Nieves Lorenzo2 , Juan Taboada3 , Alba Robles2 , and Gonzalo Miguez-Macho1
1 Non-Linear Physics Group, Universidade de Santiago de Compostela, Santiago de Compostela, Galicia, Spain
2 Ephyslab,Universidade de Vigo, Vigo, Galicia, Spain
3 MeteoGalicia, Consellería de Medio Ambiente, Xunta de Galicia, Santiago de Compostela, Spain
Correspondence: Jorge Eiras-Barca (jorge.eiras@usc.es)
Received: 15 April 2017 – Discussion started: 6 June 2017
Revised: 14 May 2018 – Accepted: 25 May 2018 – Published: 13 June 2018
Abstract. Atmospheric rivers (ARs) – long and narrow struc- been recently reviewed by Guan and Waliser (2015), who
tures of anomalously high water vapor flux located in the proved that they exhibit a mean length of about 3700 km
warm sector of extratropical cyclones – have been shown and have average integrated vapor transport (IVT) fields of
to be closely related to extreme precipitation and flooding. 375 kg m−1 s−1 . ARs are usually found in the warm sector of
In this paper we analyze the connection between ARs and extratropical cyclones and are associated with the meridional
flooding in the northwestern Spanish region of Galicia under transport of latent and sensible heat from the (sub)tropics to
a variety of synoptic conditions represented by the so-called the midlatitudes (Newell et al., 1992; Zhu and Newell, 1998;
“weather types”, a classification of daily sea-level pressure Gimeno et al., 2010, 2014, 2016; Ralph and Dettinger, 2011;
patterns obtained by means of a simple scheme that adopts Lavers and Villarini, 2013; Matrosov, 2013; Neiman et al.,
the subjective procedure of Lamb. Flood events are identified 2013; Rutz et al., 2014; Garaboa-Paz et al., 2015; Waliser
from official reports conducted by the Spanish emergency and Guan, 2017).
management agency (Protección Civil) from 1979 to 2010. There has been a rise in the development of detection al-
Our results suggest that, although most flood events in Gali- gorithms for ARs over the past few years, with significant
cia do not coincide with the presence of an overhead AR, contributions made by numerous authors (e.g., Lavers et al.,
ARs are present in the majority of severe cases, particularly 2012; Guan and Waliser, 2015; Eiras-Barca et al., 2016;
in coastal areas. Flood events associated with ARs are con- Brands et al., 2016). Despite the fact that discrepancies in
nected to cyclonic weather types with westerly and south- the finer details of their detection remain, all algorithms in
westerly flows, which occur mostly in winter months. The the literature rely on an analysis of the integrated water vapor
link between ARs and severe flooding is not very apparent in column (IWV) and IVT fields. ARs are always characterized
inland areas or during summer months, in which case heavy by highly increased values of both variables when compared
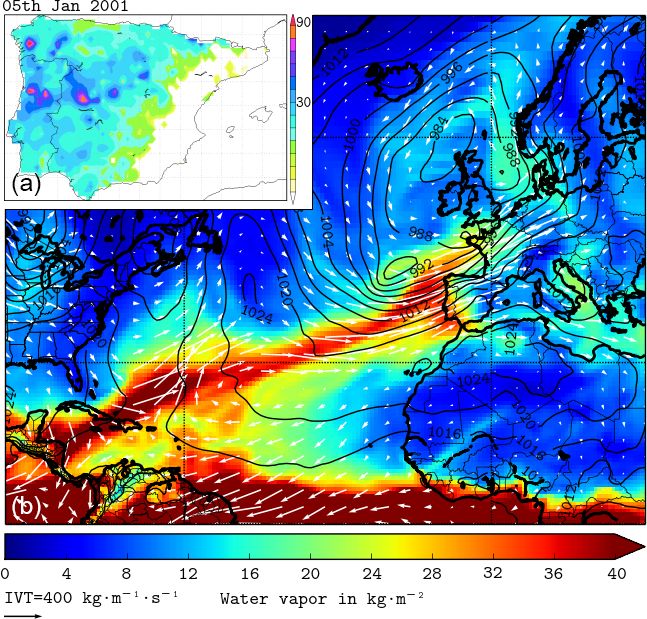
precipitation is usually not frontal in nature but rather con- with surrounding areas. An example of a well-defined AR
vective. Nevertheless, our results show that, in general, the making landfall on the Iberian Peninsula coast, along with
amount of precipitation in flood events in Galicia more than the associated extreme precipitation, can be found in Fig. 1.
doubles when an AR is present. Flood events (FEs) are major natural disasters that humans
face today, as flooding episodes worldwide are commonly as-
sociated with extensive socioeconomic impacts and fatalities.
The correlation and causality between ARs and extreme pre-
1 Introduction cipitation events have been soundly demonstrated in many
parts of the world, including the Iberian Peninsula (Ramos
Atmospheric rivers (ARs) are narrow, elongated structures et al., 2015; Eiras-Barca et al., 2016). Nevertheless, few stud-
that carry high quantities of water vapor in the lower tro- ies have used flood databases to analyze how the impact of
posphere. The climatological characteristics of ARs have
Published by Copernicus Publications on behalf of the European Geosciences Union.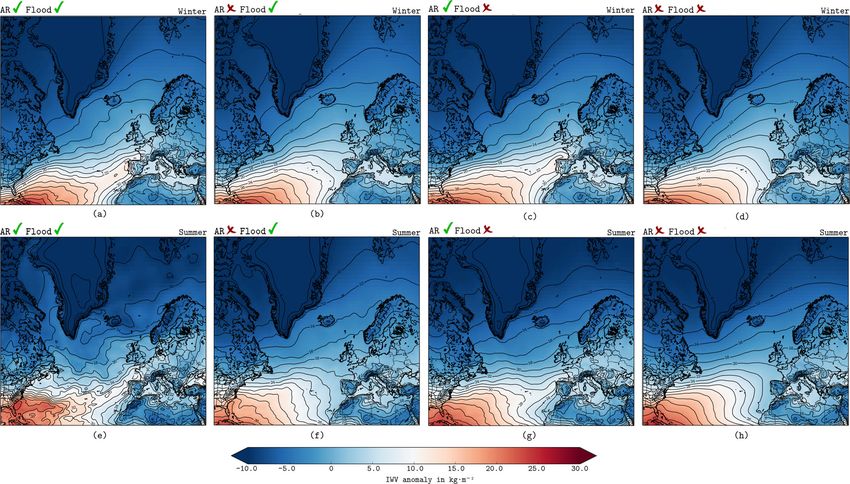
1634 J. Eiras-Barca et al.: Atmospheric rivers and documented floods in Galicia
Figure 1. An AR as it makes landfall in Galicia (NW Spain)
on 5 January 2001. The field represents the IWV (kg m−2 ),
while the arrows symbolize the integrated water vapor flux or
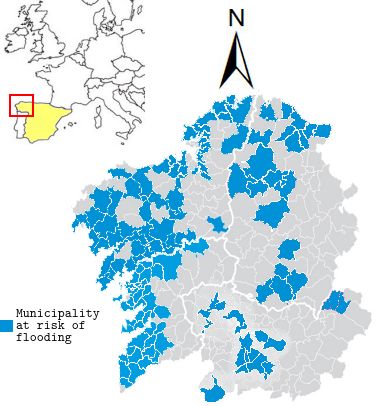
Figure 2. Municipalities of Galicia that are at regular risk of
IVT (kg m−1 s−1 ). Panel (a) displays extreme precipitation (more
flooding. Sources: the regional government (Xunta de Galicia) and
than 90 mm in 24 h) accumulated throughout the Iberian Peninsula.
Miño–Sil river authority Confederación Hidrográfica Miño–Sil.
ARs is reflected in people’s daily lives. In this regard, the
connection between ARs and floods has been extensively es- Extreme precipitation and anomalous winds are the most
tablished for the west coast of the USA (e.g., Ralph et al., frequent climate risks in Galicia. In coastal towns, floods are
2006; Dettinger, 2011), as well as for some European regions more common (Fig. 2) and the corresponding socioeconomic
(e.g., Lavers et al., 2011). impacts are the most severe (Martínez and Ezpeleta, 2000).
The region of Galicia is located in the northwestern part of Fatalities and serious damage to transportation and commu-
Spain. The Galician climate is highly influenced by its loca- nication systems are common when FEs occur. Due to this,
tion within the North Atlantic storm track, where a continu- a better understanding of the meteorological conditions that
ous passage of baroclinic structures increases the possibility produce FEs is crucial for the people and economy of this
of heavy rainfall episodes (Nieto et al., 2011). This is espe- Atlantic region (Cabalar-Fuentes, 2005).
cially true in winter and autumn, whereas in spring and sum- One way to integrate different meteorological parameters,
mer, as the storm track moves poleward, intense precipitation such as rainfall, direction and wind intensity, or temperature,
associated with convective episodes plays a more prominent into a single index is via the classification of synoptic sit-
role (Eiras-Barca et al., 2016). uations (i.e., weather types, WTs). Using data such as sea-
The interannual variability of rainfall in Galicia is mostly level pressure (SLP) or geopotential height for classification,
linked to certain modes of the atmosphere (e.g., Lorenzo and each observed time period is assigned a WT, allowing the as-
Taboada, 2005; Lorenzo et al., 2006, 2008, 2011), particu- sociated meteorological variability and its consequences to
larly the North Atlantic Oscillation (NAO), which modulates be studied in different fields in a simple and decipherable
the position of the storm track and its impact in this region. way (e.g., Trigo and DaCamara, 2000; Lorenzo et al., 2008;
Therefore, higher correlations that explain the variability in Cortesi et al., 2014; Gilabert and Llasat, 2018). In this arti-
precipitation, especially in southern Galicia, correspond to cle, we look at the occurrence of FEs and their related WTs
this index (Trigo et al., 2008). Notwithstanding, other tele- in Galicia.
connection patterns such as the eastern Atlantic (EA) or the With the following research, we analyze the connection
Scandinavian pattern (SCAND) should also be taken into ac- between ARs and FEs under different WT synoptic situa-
count when explaining the interannual variability of precipi- tions. The scope of this paper is twofold. We first identify
tation and AR activity in Galicia (e.g., Lorenzo et al., 2006; the relationship between ARs and FEs under different syn-
Bueh and Nakamura, 2007; Ramos et al., 2015). optic conditions in the studied region. We then demonstrate
how this study may be of use in properly understanding and
predicting FEs. The structure of the paper is as follows: in
Nat. Hazards Earth Syst. Sci., 18, 1633–1645, 2018 www.nat-hazards-earth-syst-sci.net/18/1633/2018/
J. Eiras-Barca et al.: Atmospheric rivers and documented floods in Galicia                                                       1635

Sect. 2 we present our analysis methods, while in Sect. 3 we       Table 1. Total number of days included in any of the flood events in
outline our obtained results and give a brief analysis. Finally,   Galicia throughout the period 1979–2010.
our conclusions are presented in Sect. 4.
                                                                                 Season    SIL region    COSTA region
                                                                                 DJF              206          190
2   Data and methods
                                                                                 MAM               45          102
                                                                                 JJA                9          102
This research aims to analyze the connection between ARs
                                                                                 SON               97          154
and flood events. Therefore, rather than extrapolate ordinary
precipitation databases, we have employed a flooding events
database published by the Spanish Emergency System (Pro-
tección Civil de España), in which only occurrences with se-       was done by adopting the procedure developed by Trigo
rious implications in terms of damage are considered.              and DaCamara (2000), which was adapted from Jenkinson
   FEs were gathered from official reports published by the        and Collison (1977) and Jones et al. (1993). The southerly
Spanish Emergency Service. This database registers FEs over        flow (SF), westerly flow (WF), total flow (TF), southerly
an extended period, i.e., from 1979 to 2010 (Interior, 2014).      shear vorticity (ZS), westerly shear vorticity (ZW) and to-
Two different areas were individually analyzed: the Gali-          tal shear vorticity (Z) were computed using SLP values col-
cian coast (COSTA) and the Miño–Sil (SIL) hydrological             lected for the 16 grid points shown in Fig. A1 (Lorenzo et al.,
units (river basins). Whereas the former unit encompasses all      2008). For the index calculations, we applied the equations
smaller Atlantic basins and is representative of coastal towns,    outlined by Lorenzo et al. (2008) to an NCAR reanalysis of
the latter corresponds to the Miño–Sil river basin and depicts     size 2.5◦ × 2.5◦ . We used the conditions established by Trigo
conditions inland of Galicia. The rainfall database has been       and DaCamara (2000) to define the different WTs. For the
used to quantify the exact amount of precipitation only on         sake of simplicity, only WTs that appeared with a frequency
flooding days.                                                     of over 3 % are considered in this study. Under this condition,
   The total number of days on which an AR has been de-            the total number of WTs is 9 throughout the extended winter
tected on the Galician coast during years 1979–2010 is 754.        months (ONDJFM) and 12 throughout the extended summer
We note that the same AR event can extend for more than            months (AMJJAS). SLP composites for each of the consid-
one day. In the same period, 15 and 24 flood events were reg-      ered WTs are shown in Fig. 3. A brief description of each
istered for the SIL and COSTA regions respectively. Since          WT can be found in Table 2.The hybrid WTs are a combina-
each FE can also last for several days (see Table 1), the total    tion of both WTs. Finally, ECMWF ERA-Interim reanalysis
number of days encompassed by all considered FEs is 357 for        data (Dee et al., 2011) were used to make composites of the
the SIL and 548 for the COSTA regions.                             SLP, IVT and IWV variables on days with or without the oc-
   The database published by Guan and Waliser (2015) was           currence of ARs and FEs.
used in the detection of ARs. This is an advanced AR
database, with the ability to identify ARs using complex con-
siderations regarding the characteristics of IWV and IVT           3     Results and discussion
fields in terms of coherence and continuity (Waliser and
Guan, 2017). Equations (1) and (2) represent the methodolo-        The connection between WTs and FEs has been studied us-
gies for the integration of the IWV and IVT fields, respec-        ing two distinct procedures. First, in Sect. 3.1 we refer to
tively, where q is the specific humidity, g is the gravitational   the aforementioned connection in terms of the correspond-
force, u is the horizontal wind field and the integration cov-     ing WTs that they are associated with. Then, in Sect. 3.2, we
ers the whole troposphere from the first pressure level (P0 )      demonstrate that the anomaly composites for different vari-
to the top (Pf ).                                                  ables show whether or not an AR is detected simultaneously
                                                                   with an FE. Finally, the set of meteorological stations stated
              Pf                                                   in Table A1 is used to quantify the amount of precipitation
              Z
      1                                                            that occurred throughout the FEs.
IWV =              q · dp                                   (1)
      g
              P0                                                   3.1    Weather types
              Pf
              Z
          1                                                        Figure 4 shows the frequency of occurrence for each of the
IVT = |            q · u · dp|                              (2)
          g                                                        winter and summer WTs during the FEs, for both (COSTA
              P0                                                   and SIL) regions. For these two regions, ARs are primar-
                                                                   ily correlated with FEs in winter months. FEs during sum-
   Only days on which ARs made landfall onto the Gali-             mer months are mostly associated with anticyclonic situa-
cian coast have been taken into consideration throughout this      tions (NE, A, AE) that block the arrival of fronts and ARs.
analysis (AR days). The classification of synoptic situations      This is in line with the convective character of extreme pre-

www.nat-hazards-earth-syst-sci.net/18/1633/2018/                           Nat. Hazards Earth Syst. Sci., 18, 1633–1645, 2018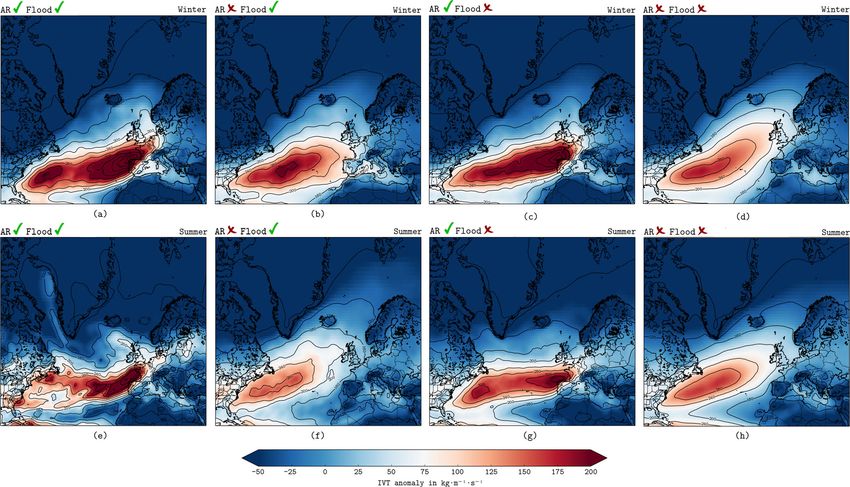
1636                                               J. Eiras-Barca et al.: Atmospheric rivers and documented floods in Galicia

Table 2. A brief description of the pure predominant WTs used in the analysis. The bulk of this information was obtained by Ramos (2012).

 WT     Season             Brief description

 NE     Summer             Extended high pressure settled over the west of Ireland and low pressure in the Mediterranean Sea.
 E      Summer             Synoptic situations characterized by high pressure over the British Isles and low pressure dominating over northern Africa.
 SE     Winter             Low pressure extending towards Madeira and high pressure over northern Europe.
 S      Summer, Winter     High pressure over the British Isles and low pressure established in the North Atlantic (Azores region).
 SW     Winter             Low-pressure system to the west of Ireland with a large anticyclone over the Mediterranean region.
 W      Summer, Winter     Low-pressure system over the North Atlantic with a high-pressure system over the Azores.
 NW     Summer, Winter     Low-pressure system over the British Isles and a anticyclone system located over the Azores.
 N      Summer             Azores high pressure near the islands and a low pressure over southern Europe and the Mediterranean basin.
 C      Summer, Winter     Low-pressure center over the NW Iberian Peninsula
 A      Summer, Winter     Extended high-pressure center between the Iberian Peninsula and the Azores Islands.

Figure 3. SLP composites for all the WTs considered in this analysis.

cipitation in the extended summer months for these regions.              clonic synoptic situations or situations with humid west flux.
In winter months, however, FEs are mostly associated with                Under these conditions, the arrival of fronts to the Galician
W, SW, C and NW WTs, all of which are connected with cy-                 coast is very likely. The case of the SW weather type is par-

Nat. Hazards Earth Syst. Sci., 18, 1633–1645, 2018                               www.nat-hazards-earth-syst-sci.net/18/1633/2018/
J. Eiras-Barca et al.: Atmospheric rivers and documented floods in Galicia                                                       1637

Figure 4. Frequency of occurrence for each WT with FE for the SIL region in the extended winter (ONDJFM) (a) and extended sum-
mer (AMJJAS) (b) months, as well as for the COSTA region in the extended winter (c) and extended summer (d) months. Red bars represent
WTs associated with FEs when an AR has been simultaneously detected, while black lined bars refer to FEs that do not have an associated
AR event.

ticularly remarkable, as it registers as many floods associated       the COSTA basin, 16 out of the 23 days with the highest
with AR events as floods not associated with AR events. As            rainfall in the FEs (70 %) took place with the presence of an
Fig. 3 indicates, this WT is characterized by the presence of         AR over Galicia. In the SIL region (Table A3), 7 out of 17
a cyclone near the British Isles, which enhances the arrival          (41 %) coexisted simultaneously with an AR. However, if
of fronts to the Iberian coast. The same applies, though to a         only the extended winter is analyzed in the same database,
lesser extent, to the W, C and NW types.                              ratios of 15 out of 19 (79 %) and 7 out of 13 (54 %) appear
   However, it is necessary to consider that periods of flood-        for the COSTA and SIL basins, respectively. Once again,
ing do not always coincide with periods of extreme rainfall           our results point to the key role that ARs play in FEs in the
due to the fact that 1 or 2 days of heavy rainfall can produce        COSTA region. This role is diminished farther inland due to
floods that can be maintained over time simply with rain-             the more likely convective character of extreme precipitation
fall quantities that are close to normal amounts. Therefore,          over these areas.
to study the relationship between FEs and the presence of                Figure 5 shows, for each WT and each region, the precip-
ARs in more detail, we have chosen the day with the high-             itation ratio occurring when an AR is (or is not) detected in
est rainfall in each flood period and looked for the presence         the context of all the precipitation that occurred in the corre-
of ARs on that specific date. Most FEs did not simultane-             sponding WT when there was flooding.
ously occur with an AR when all days of an FE were consid-               First, the mean precipitation was calculated for each WT,
ered. However, Table A2, exhibiting days where maximum                then we computed the accumulated precipitation during the
precipitation overlaps with AR detection, indicates that for          flooding days simultaneously with the WT under considera-

www.nat-hazards-earth-syst-sci.net/18/1633/2018/                             Nat. Hazards Earth Syst. Sci., 18, 1633–1645, 2018
1638                                                J. Eiras-Barca et al.: Atmospheric rivers and documented floods in Galicia

Figure 5. Same as Fig. 4 but with precipitation ratio.

tion. Subsequently, the mean precipitation in FEs was calcu-         months, the occurrence of the WT in this season represents
lated and separately considered according to the AR detec-           the few fronts with ARs arriving on the Galician coast. It is
tion. The cited ratio is the result of the division of the latter    uncommon to observe AR precipitation from WTs other than
by the former. Thus, this ratio quantifies how much precipi-         W or SW in summer months.
tation should be expected when an FE coincides with an AR,              Previous works that analyzed precipitation using the
with respect to an FE that is not accompanied by an AR for           methodology of WTs concluded that most of the yearly
one of the WTs considered. In general, the expected rainfall         and winter precipitation is associated with WTs C, SW and
on a day with an AR within a flood period is more than dou-          W (e.g., Trigo and DaCamara, 2000; Lorenzo et al., 2008;
ble than that which is expected on the same day without an           Cortesi et al., 2014). Our results corroborated with those ob-
AR. Especially noteworthy are the ANW type for the SIL               tained by the cited studies, contributing to the idea that ARs
and COSTA regions and the NW for the SIL region, where               are responsible for most of this precipitation.
the expected amount of winter rainfall was 5 times larger than
if the FE coincided with an AR (relative to when no AR was           3.2   Anomaly maps
detected).
   The same occurs, although to a lesser extent, for types SW,       Figure 6 shows anomaly composites with regard to the mean
W and C for winter precipitation in SIL and with types SW,           sea level pressure for each point in the Atlantic Ocean, which
W, NW and C for winter precipitation in COSTA. In the sum-           delineates when an AR is and is not detected in Galicia, as
mer months, the same occurs for the W types for the inte-            well as when an FE is and is not detected over the same re-
rior region (SIL) and the AN type for coastal regions. Even          gion for both the extended winter and summer months. With
when SW is not the predominant weather type in the summer            regards to the winter maps and always speaking in terms of
                                                                     the most probable situation, for an AR to be detected on the

Nat. Hazards Earth Syst. Sci., 18, 1633–1645, 2018                          www.nat-hazards-earth-syst-sci.net/18/1633/2018/
J. Eiras-Barca et al.: Atmospheric rivers and documented floods in Galicia 1639
Figure 6. SLP composites for all events in the extended winter months depending on whether both an AR and an FE (a), only FEs (b), only
ARs (c) or neither (d) have been detected. (e–h) The same are represented except for the extended summer months. The background field
depicts anomalies, and the isolines show mean values. The composites correspond to the period 1979–2010.
coast of Galicia, there would have to be a convergence of For cases in which no AR is detected, no intense IVT fields
a high-pressure center to the south of it and a low-pressure are observed over the studied region, especially when an FE
center to the north. For an AR to be detected with an FE, is also not detected. With respect to the summer months, no
the previously described situation would have to occur, and significant qualitative differences are detected in relation to
the low-pressure center would have to occupy a very large the winter months.
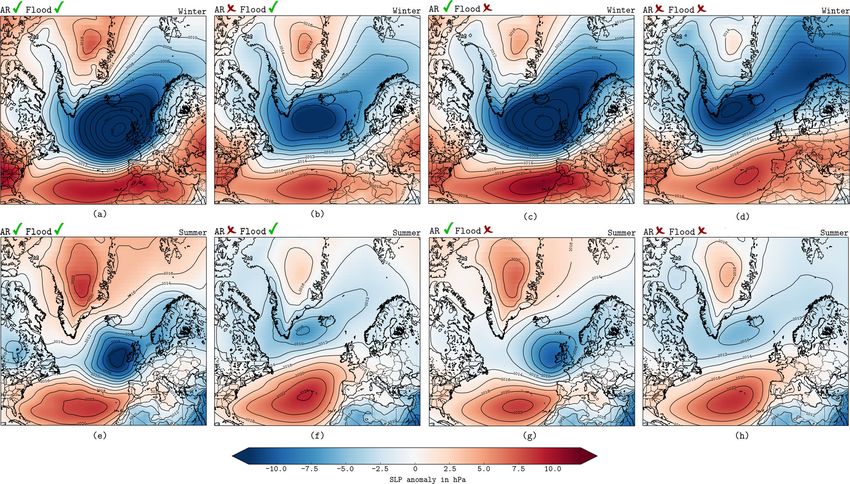
space over the North Atlantic. Flooding alone, with no AR Figure A2 is comparable to Figs. 6 and 7, but herein the
presence, would occur with any similar situation to that de- IWV field is represented. As revealed by this figure, both
scribed above, but both pressure centers would be weakened. for the summer and winter months, more pronounced IWV
For the days on which neither ARs nor floods were detected, anomalies were observed for Galicia when an AR was de-
a well-developed anticyclone over the Azores was identified tected. It is also of note that flooding was associated with
as being influential in blocking the passage of baroclinic sys- disturbances in the IWV fields. These conclusions are simi-
tems. lar to those drawn from Fig. 6. The results are much less pro-
In the case of the summer months, the situation is similar nounced, due to the fact that the IWV fields are much more
to that of the winter months as far as AR detection is con- stable than the IVT fields. Additionally, the presence of an
cerned, except for FEs, which occurred concurrently with a AR suggests a disturbance in the IWV fields that is much
well-developed anticyclone over the Azores islands. This pe- more spatially localized than in the case of IVT, and there-
culiarity shows that floods in the summer months are not as fore the imprint it leaves on the climatic composite is much
closely related to the arrival of baroclinic structures as they lower.
are to convective precipitation, which is compatible with the
idea that the Azores anticyclone forms a blocking event.
Figure 7 is analogous to Fig. 6 but shows anomalies in 4 Conclusions
the IVT fields instead of the SLP. The results indicate that
the detection of an AR in the winter months is contingent The flooding episodes in the months between October and
upon the presence of an intense IVT field over Galicia. These March in the coastal areas of Galicia (NW Spain) are asso-
results are intensified when the AR is accompanied by an FE. ciated with WTs of W, NW and C. These WTs are related
to inbound baroclinic structures, Atlantic storms and ARs on
www.nat-hazards-earth-syst-sci.net/18/1633/2018/ Nat. Hazards Earth Syst. Sci., 18, 1633–1645, 20181640 J. Eiras-Barca et al.: Atmospheric rivers and documented floods in Galicia Figure 7. Same as Fig. 6 but with IVT values. the Galicia coast. Our results support the critical role that The ideas stated in this paper may only be useful to pre- ARs play in the intensification of flood episodes, which are dict FEs along with an operative AR detection algorithm for present in 70 % of the most important FEs in coastal areas, the Iberian Atlantic Margin. With this aim, we have devel- and provide enough moisture to increase the total accumu- oped the first operative AR detection system for Europe, lated rainfall. which can be accessed at http://meteo.usc.es/ARs (last ac- The link between ARs and FEs is not so evident in coastal cess: June 2018). Regarding future work, flood catalogues areas throughout the summer months, nor is it evident year will allow researchers to perform higher-resolution analyses, round in the inland basin. It is likely that this is due to the in order to improve the identification of risk areas, as well as more convective nature of precipitation in extreme events far to better determine any correlations between floods, ARs and from the coast and in the extended summer months. It should WTs. be noted that most of the FEs in Galicia do not coincide with an AR in both coastal and inland areas and during both sum- mer and winter months. However, the expected precipitation Data availability. No public data are derived from this research. of an FE is more than doubled if an AR is detected under any For further information, please contact the corresponding author. synoptic condition. Nat. Hazards Earth Syst. Sci., 18, 1633–1645, 2018 www.nat-hazards-earth-syst-sci.net/18/1633/2018/
J. Eiras-Barca et al.: Atmospheric rivers and documented floods in Galicia                                                   1641

Appendix A: Supplementary material

Table A1. Information regarding the meteorological stations.

             Station     Province         Latitude          Longitude       Agency         Type                   Region
             Coruña      Coruña          43◦ 220 100 N    8◦ 250 9.900 W    AEMET          Manual                 COSTA
             Lourizán    Pontevedra    42◦ 240 37.800 N   8◦ 390 46.100 W   MeteoGalicia   Automatic and manual   COSTA
             Lugo        Lugo           43◦ 00 40.000 N   7◦ 330 17.000 W   AEMET          Manual                 SIL
             Orense      Orense        42◦ 190 40.000 N   7◦ 510 37.000 W   AEMET          Manual                 SIL
             Santiago    Coruña        42◦ 520 12.000 N   8◦ 330 2.600 W    AEMET          Manual                 COSTA

Figure A1. Pressure grid points used in the characterization of
the WTs.

www.nat-hazards-earth-syst-sci.net/18/1633/2018/                                Nat. Hazards Earth Syst. Sci., 18, 1633–1645, 2018
1642 J. Eiras-Barca et al.: Atmospheric rivers and documented floods in Galicia Figure A2. Same as Figs. 6 and 7 but with IWV values. Nat. Hazards Earth Syst. Sci., 18, 1633–1645, 2018 www.nat-hazards-earth-syst-sci.net/18/1633/2018/
J. Eiras-Barca et al.: Atmospheric rivers and documented floods in Galicia                                                    1643

Table A2. FEs included in the analysis, listed in descending order of precipitation amount for the COSTA region.

                   Event                        Region      Day of                       Amount of         AR       WT
                                                            max. precipitation   precipitation (mm)     detection
                   13–16 Oct 1987               COSTA       14 Oct 1987                         286.8       1       W
                   19–21 1989                   COSTA       19 Dec 1989                         253.7       1       SW
                   7–9 1999                     COSTA       8 Mar 1999                          253.6       1       C
                   20 Oct 2000–10 Jan 2001      COSTA       6 Dec 2000                          202.8       1       SW
                   2–25 Oct 2006                COSTA       21 Oct 2006                         189.1       1       SW
                   11 Nov–31 Dec 2002           COSTA       12 Nov 2002                         185.0       0       W
                   13 Nov–29 Dec 2009           COSTA       5 Dec 2009                          182.1       1       SW
                   21 Feb–1 Mar 2010            COSTA       21 Feb 2010                         181.2       1       C
                   19–23 Oct 2001               COSTA       21 Oct 2001                         179.9       1       SW
                   3–9 Oct 2010                 COSTA       8 Oct 2010                          160.0       0       S
                   21 Dec 1995–23 Jan 1996      COSTA       23 Dec 1995                         156.9       1       W
                   5–5 Jan 1988                 COSTA       5 Jan 1988                          145.9       1       CW
                   18 Nov–7 Dec 2006            COSTA       27 Nov 2006                         139.2       1       SW
                   19–24 Mar 2001               COSTA       20 Mar 2001                         105.2       1       CW
                   24 Apr–25 May 2000           COSTA       24 Apr 2000                         103.9       1       CW
                   28 Oct–2 Nov 2005            COSTA       29 Oct 2005                         103.0       1       SW
                   12–23 Jan 2010               COSTA       22 Jan 2010                          88.2       0       W
                   10–13 Nov 1997               COSTA       10 Nov 1997                          83.0       1       W
                   30 Apr–1 May 1998            COSTA       30 Apr 1998                          66.0       0       N
                   9–11 Jun 2010                COSTA       10 Jun 2010                          63.6       0       C
                   4 Apr–8 Sep 2004             COSTA       4 Sep 2004                           62.6       0       ANE
                   6–6 Nov 1994                 COSTA       6 Nov 1994                           41.7       0       CW
                   23–25 Jan 2009               COSTA       24 Jan 2009                          40.8       1       W
                   15–21 Jun 1988               COSTA       15 Jun 1988                          27.9       0       NE

Table A3. FEs included in the analysis, listed in descending order of precipitation amount for the SIL region.

                   Event                         Region     Day of                    Amount of            AR       WT
                                                            max. precipitation    precipitation (mm)    detection
                   14–16 Oct 1987                  SIL      15 Oct 1987                  95.4               1       C
                   31 Dec 1994–1 Jan 1995          SIL      31 Dec 1994                  88.7               1       NW
                   12–24 Dec 1989                  SIL      16 Dec 1989                  69.2               1       CW
                   1–17 Jan 1994                   SIL      5 Jan 1994                   68.1               1       W
                   24 Dec 1995–2 Jan 1996          SIL      30 Dec 1995                  66.6               0       CW
                   1–30 Nov 1996                   SIL      22 Nov 1996                  60.2               0       W
                   10–12 Jan 1991                  SIL      10 Jan 1991                  58.4               1       W
                   14–16 Dec 1999                  SIL      14 Dec 1999                  56.8               1       NW
                   6–13 Jan 1996                   SIL      6 Jan 1996                   50.2               0       CW
                   15–21 Jun 1988                  SIL      15 Jun 1988                  46.4               0       NE
                   30 Oct 2000–31 Mar 2001         SIL      21 Nov 2000                  36.5               1       W
                   5–13 Dec 2000                   SIL      7 Dec 2000                   29.9               0       CW
                   30 Apr–4 May 1998               SIL      30 Apr 1998                  26.6               0       N
                   1 Nov–31 Dec 2002               SIL      20 Nov 2002                  24.7               0       SW
                   1–31 Dec 2003                   SIL      9 Dec 2003                   12.6               0       C
                   27–27 Dec 2003                  SIL      27 Dec 2003                  12.6               1       C

www.nat-hazards-earth-syst-sci.net/18/1633/2018/                                 Nat. Hazards Earth Syst. Sci., 18, 1633–1645, 2018
1644 J. Eiras-Barca et al.: Atmospheric rivers and documented floods in Galicia
Competing interests. The authors declare that they have no conflict Gimeno, L., Drumond, A., Nieto, R., Trigo, R. M., and Stohl, A.:
of interest. On the origin of continental precipitation, Geophys. Res. Lett.,
37, L13804, https://doi.org/10.1029/2010GL043712, 2010.
Gimeno, L., Nieto, R., Vázquez, M., and Lavers, D. A.: At-
Acknowledgements. The authors acknowledge fruitful discus- mospheric rivers: a mini-review, Front. Earth Sci., 2, 2,
sions with Swen Brands and MeteoGalicia. Jorge Eiras-Barca https://doi.org/10.3389/feart.2014.00002, 2014.
is funded by the “Ministerio Español de Economía y Com- Gimeno, L., Dominguez, F., Nieto, R., Trigo, R., Drumond, A.,
petitividad” and FEDER (EDRF) (CGL2013-45932-R). This Reason, C. J., Taschetto, A. S., Ramos, A. M., Kumar, R., and
work was partially supported by Xunta de Galicia under project Marengo, J.: Major mechanisms of atmospheric moisture trans-
“gts0005 ED431C 2017/64-GRC” Programa de Consolidación e port and their role in extreme precipitation events, Annu. Rev.
Estruturación de Unidades de Investigación Competitivas (Grupos Environ. Resour., 41, 117–141, 2016.
de Referencia Competitiva). Guan, B. and Waliser, D. E.: Detection of atmospheric rivers: Eval-
uation and application of an algorithm for global studies, J. Geo-
Edited by: Maria-Carmen Llasat phys. Res.-Atmos., 120, 12514–12535, 2015.
Reviewed by: two anonymous referees Interior: Catálogo Nacional de Inundaciones Históricas, Dirección
General de Protección Civil y Emergencias, Ministerio del In-
terior español, http://www.proteccioncivil.es/catalogo/naturales/
cnih/cnih2014/Presentacion.html (last access: June 2018), 2014.
Jenkinson, A. and Collison, F.: An initial climatology of gales
References over the North Sea, Synoptic Climatology Branch Memorandum,
No. 62, Meteorological Office, Bracknell, available at the Na-
Brands, S., Gutiérrez, J., and San-Martín, D.: Twentieth-century tional Meteorological Library, Meteorological Office, Bracknell,
atmospheric river activity along the west coasts of Europe and UK, 1977.
North America: algorithm formulation, reanalysis uncertainty Jones, P., Hulme, M., and Briffa, K.: A comparison of Lamb circu-
and links to atmospheric circulation patterns, Clim. Dynam., 48, lation types with an objective classification scheme, Int. J. Cli-
2771, https://doi.org/10.1007/s00382-016-3095-6, 2016. matol., 13, 655–663, 1993.
Bueh, C. and Nakamura, H.: Scandinavian pattern and its climatic Lavers, D. A. and Villarini, G.: The nexus between atmospheric
impact, Q. J. Roy. Meteorol. Soc., 133, 2117–2131, 2007. rivers and extreme precipitation across Europe, Geophys. Res.
Cabalar-Fuentes, M.: Los tetemporales de lluvia y viento en Galicia. Lett., 40, 3259–3264, https://doi.org/10.1002/grl.50636, 2013.
Propuestas de clasificación y análisis de tendencias (1961–2001), Lavers, D. A., Allan, R. P., Wood, E. F., Villarini, G., Brayshaw,
Investigaciones Geográficas, 36, 103–118, 2005. D. J., and Wade, A. J.: Winter floods in Britain are con-
Cortesi, N., Gonzalez-Hidalgo, J. C., Trigo, R. M., and Ramos, A. nected to atmospheric rivers, Geophys. Res. Lett., 38, L23803,
M.: Weather types and spatial variability of precipitation in the https://doi.org/10.1029/2011GL049783, 2011.
Iberian Peninsula, Int. J. Climatol., 34, 2661–2677, 2014. Lavers, D. A., Villarini, G., Allan, R. P., Wood, E. F., and Wade,
Dee, D. P., Uppala, S. M., Simmons, A. J., Berrisford, P., Poli, A. J.: The detection of atmospheric rivers in atmospheric reanal-
P., Kobayashi, S., Andrae, U., Balmaseda, M. A., Balsamo, G., yses and their links to British winter floods and the large-scale
Bauer, P., Bechtold, P., Beljaars, A. C. M., van de Berg, L., Bid- climatic circulation, J. Geophys. Res.-Atmos., 117, D20106,
lot, J., Bormann, N., Delsol, C., Dragani, R., Fuentes, M., Geer, https://doi.org/10.1029/2012JD018027, 2012.
A. J., Haimberger, L., Healy, S. B., Hersbach, H., Hólm, E. V., Lorenzo, M. N. and Taboada, J.: Influences of atmospheric vari-
Isaksen, L., Kållberg, P., Köhler, M., Matricardi, M., McNally, ability on freshwater input in Galician Rias in winter, J. Atmos.
A. P., Monge-Sanz, B. M., Morcrette, J.-J., Park, B.-K., Peubey, Ocean Sci., 10, 377–387, 2005.
C., de Rosnay, P., Tavolato, C., Thépaut, J.-N., and Vitart, F.: The Lorenzo, M. N., Taboada, J. J., Sarmiento, M., Alvarez, I., Gomez-
ERA-Interim reanalysis: configuration and performance of the Gesteira, M., DeCastro, M., Lorenzo, N., Taboada, J., Sarmiento,
data assimilation system, Q. J. Roy. Meteorol. Soc., 137, 553– M., Alvarez, I., and Gomez-Gesteira, M.: Influence of telecon-
597, https://doi.org/10.1002/qj.828, 2011. nection patterns on precipitation variability and on river flow
Dettinger, M.: Climate Change, Atmospheric Rivers, and Floods regimes in the Miño River basin (NW Iberian Peninsula), Clim.
in California – A Multimodel Analysis of Storm Frequency and Res., 32, 63–73, 2006.
Magnitude Changes, J. Am. Water Resour. Assoc., 47, 514–523, Lorenzo, M. N., Taboada, J., and Gimeno, L.: Links between cir-
https://doi.org/10.1111/j.1752-1688.2011.00546.x, 2011. culation weather types and teleconnection patterns and their in-
Eiras-Barca, J., Brands, S., and Miguez-Macho, G.: Seasonal fluence on precipitation patterns in Galicia (NW Spain), Int. J.
variations in north atlantic atmospheric river activity and Climatol., 28, 1493–1505, 2008.
associations with anomalous precipitation over the iberian Lorenzo, M. N., Ramos, A. M., Taboada, J. J., and Gimeno,
atlantic margin, J. Geophys. Res.-Atmos., 121, 931–948, L.: Changes in present and future circulation types fre-
https://doi.org/10.1002/2015JD023379, 2016. quency in northwest Iberian Peninsula, PloS One, 6, e16201,
Garaboa-Paz, D., Eiras-Barca, J., Huhn, F., and Pérez-Muñuzuri, V.: https://doi.org/10.1371/journal.pone.0016201, 2011.
Lagrangian coherent structures along atmospheric rivers, Chaos, Martínez, E. G. and Ezpeleta, A. M.: Riesgos climáticos en Gali-
25, 063105, https://doi.org/10.1063/1.4919768, 2015. cia: una aproximación a través de la prensa (1983-1997), Ería,
Gilabert, J. and Llasat, M. C.: Circulation weather types associated Revista Cuatrimestral de Geografía, Universidad de Oviedo,
with extreme flood events in Northwestern Mediterranean, Int. J. Oviedo, Spain, 259–269, 2000.
Climatol., 38, 1864–1876, 2018.
Nat. Hazards Earth Syst. Sci., 18, 1633–1645, 2018 www.nat-hazards-earth-syst-sci.net/18/1633/2018/J. Eiras-Barca et al.: Atmospheric rivers and documented floods in Galicia 1645 Matrosov, S. Y.: Characteristics of landfalling atmospheric rivers Ramos, A. M., Trigo, R. M., Liberato, M. L. R., and Tomé, R.: inferred from satellite observations over the eastern North Pacific Daily precipitation extreme events in the Iberian Peninsula and Ocean, Mon. Weather Rev., 141, 3757–3768, 2013. its association with Atmospheric Rivers, J. Hydrometeorol., 16, Neiman, P. J., Hughes, M., Moore, B. J., Ralph, F. M., and 579–597, https://doi.org/10.1175/JHM-D-14-0103.1, 2015. Sukovich, E. M.: Sierra barrier jets, atmospheric rivers, and pre- Rutz, J. J., Steenburgh, W. J., and Ralph, F. M.: Climatological char- cipitation characteristics in northern California: A composite per- acteristics of atmospheric rivers and their inland penetration over spective based on a network of wind profilers, Mon. Weather the western United States, Mon. Weather Rev., 142, 905–921, Rev., 141, 4211–4233, 2013. 2014. Newell, R. E., Newell, N. E., Zhu, Y., and Scott, C.: Tropospheric Trigo, R. M. and DaCamara, C. C.: Circulation weather types rivers? – A pilot study, Geophys. Res. Lett., 19, 2401–2404, and their influence on the precipitation regime in Portugal, https://doi.org/10.1029/92GL02916, 1992. Int. J. Climatol., 20, 1559–1581, https://doi.org/10.1002/1097- Nieto, R., Taboada, J., Crespo, A., Ramos, A., Iglesias, I., Gómez- 0088(20001115)20:133.0.CO;2-5, 2000. Gesteira, J., Santo, F., Barriopedro, D., and Trigo, I.: The state of Trigo, R. M., Valente, M. A., Trigo, I. F., Miranda, P., Ramos, A. climate in NW Iberia, Clim. Res., 48, 109–144, 2011. M., Paredes, D., and García-Herrera, R.: The impact of North Ralph, F. M. and Dettinger, M. D.: Storms, floods, and the science of Atlantic wind and cyclone trends on European precipitation and atmospheric rivers, Eos Trans. Am. Geophys. Un., 92, 265–266, significant wave height in the Atlantic, A. New York Acad. Sci., https://doi.org/10.1029/2011EO320001, 2011. 1146, 212–234, 2008. Ralph, F. M., Neiman, P. J., Wick, G. A., Gutman, S. I., Dettinger, Waliser, D. and Guan, B.: Extreme winds and precipitation during M. D., Cayan, D. R., and White, A. B.: Flooding on California’s landfall of atmospheric rivers, Nat. Geosci., 10, 179–183, 2017. Russian River: Role of atmospheric rivers, Geophys. Res. Lett., Zhu, Y. and Newell, R. E.: A Proposed Algorithm 33, L13801, https://doi.org/10.1029/2006GL026689, 2006. for Moisture Fluxes from Atmospheric Rivers, Mon. Ramos, A. M.: Improving circulation weather type classification us- Weather Rev., 126, 725–735, https://doi.org/10.1175/1520- ing a 3D framework: relationship with climate variability and 0493(1998)1262.0.CO;2, 1998. projections for future climates, PhD thesis, University Vigo, Vigo, 2012. www.nat-hazards-earth-syst-sci.net/18/1633/2018/ Nat. Hazards Earth Syst. Sci., 18, 1633–1645, 2018
You can also read