Ubiquitous atmospheric production of organic acids mediated by cloud droplets - Nature
←
→
Page content transcription
If your browser does not render page correctly, please read the page content below
Article

Ubiquitous atmospheric production of
organic acids mediated by cloud droplets

https://doi.org/10.1038/s41586-021-03462-x                       B. Franco1,2,13 ✉, T. Blumenstock3, C. Cho1, L. Clarisse2, C. Clerbaux2,4, P.-F. Coheur2,
                                                                 M. De Mazière5, I. De Smedt5, H.-P. Dorn1, T. Emmerichs1, H. Fuchs1, G. Gkatzelis1,
Received: 21 September 2020
                                                                 D. W. T. Griffith6, S. Gromov7,8, J. W. Hannigan9, F. Hase3, T. Hohaus1, N. Jones6, A. Kerkweg1,
Accepted: 17 March 2021                                          A. Kiendler-Scharr1, E. Lutsch10, E. Mahieu11, A. Novelli1, I. Ortega9, C. Paton-Walsh6,
                                                                 M. Pommier4,12, A. Pozzer7, D. Reimer1, S. Rosanka1, R. Sander7, M. Schneider3, K. Strong10,
Published online: 12 May 2021
                                                                 R. Tillmann1, M. Van Roozendael5, L. Vereecken1, C. Vigouroux5, A. Wahner1 &
Open access                                                      D. Taraborrelli1,13 ✉

    Check for updates

                                                                 Atmospheric acidity is increasingly determined by carbon dioxide and organic
                                                                 acids1–3. Among the latter, formic acid facilitates the nucleation of cloud droplets4 and
                                                                 contributes to the acidity of clouds and rainwater1,5. At present, chemistry–climate
                                                                 models greatly underestimate the atmospheric burden of formic acid, because key
                                                                 processes related to its sources and sinks remain poorly understood2,6–9. Here we
                                                                 present atmospheric chamber experiments that show that formaldehyde is efficiently
                                                                 converted to gaseous formic acid via a multiphase pathway that involves its hydrated
                                                                 form, methanediol. In warm cloud droplets, methanediol undergoes fast outgassing
                                                                 but slow dehydration. Using a chemistry–climate model, we estimate that the
                                                                 gas-phase oxidation of methanediol produces up to four times more formic acid than
                                                                 all other known chemical sources combined. Our findings reconcile model
                                                                 predictions and measurements of formic acid abundance. The additional formic acid
                                                                 burden increases atmospheric acidity by reducing the pH of clouds and rainwater by
                                                                 up to 0.3. The diol mechanism presented here probably applies to other aldehydes
                                                                 and may help to explain the high atmospheric levels of other organic acids that affect
                                                                 aerosol growth and cloud evolution.

Chemical production is estimated to be the dominant atmospheric                                     Recent studies have proposed several missing sources to explain
source of formic acid (HCOOH), with a substantial contribution                                    the model underprediction. These include locally enhanced emis-
ascribed to sunlight-induced degradation of volatile organic com-                                 sions of HCOOH and its precursors, and updated or tentative chemi-
pounds (VOCs) emitted by plants6,8,9. Direct HCOOH emissions are                                  cal pathways that involve a broad range of precursors, primarily of
thought to account for less than 15% of the total production6,8,9. The                            biogenic origin6,9,12,14. To match the observed concentrations, the
overall atmospheric lifetime of HCOOH is 2–4 days, owing to efficient                             required increase in emissions of the known HCOOH precursors and/or
wet and dry deposition in the atmospheric boundary layer6,7,10, but                               HCOOH yields from hydrocarbon oxidation is inconsistent with our
increases to about 25 days in cloud-free tropospheric conditions.                                 understanding of the reactive carbon budget7,8,15. Furthermore, such
   Here we use the global chemistry–climate model ECHAM5/MESSy11                                  attempts do not account for the elevated HCOOH concentrations
(EMAC) to simulate atmospheric HCOOH abundance. The reference                                     observed in free-tropospheric, low-VOC air masses13,16,17. Owing to a
simulation (EMAC(base)) implements the chemical formation pathways                                lack of supporting laboratory measurements, the proposed chemical
that are usually accounted for8,9,12 (Methods). Using Infrared Atmos-                             pathways are often affected by large uncertainties or are speculative.
pheric Sounding Interferometer (IASI)/Metop-A satellite column meas-                              Currently, no atmospheric model offers a consistent picture of tropo-
urements13 to determine the HCOOH burden (Methods), EMAC(base)                                    spheric organic acids.
illustrates the issue (Fig. 1a, b): the model globally underpredicts the sat-                       Here we present a large, ubiquitous chemical source of HCOOH from
ellite columns by a factor of 2–5. Similar biases relative to ground-based                        a multiphase pathway (Fig. 2). In cloud water, formaldehyde (HCHO)—
Fourier transform infrared (FTIR) columns are observed at several                                 the most abundant aldehyde in the atmosphere—is a known source of
latitudes (Extended Data Fig. 1). These persistent discrepancies point                            HCOOH in remote regions5,10,18, via rapid oxidation of its monohydrated
to substantial unidentified sources of atmospheric HCOOH.                                         form, methanediol (HOCH2OH). Nevertheless, most of the HCOOH

1
 Institute of Energy and Climate Research, IEK-8: Troposphere, Forschungszentrum Jülich, Jülich, Germany. 2Université libre de Bruxelles (ULB), Spectroscopy, Quantum Chemistry and
Atmospheric Remote Sensing, Brussels, Belgium. 3Institute of Meteorology and Climate Research, Karlsruhe Institute of Technology, Karlsruhe, Germany. 4LATMOS/IPSL, Sorbonne Université,
UVSQ, CNRS, Paris, France. 5Royal Belgian Institute for Space Aeronomy, Brussels, Belgium. 6Centre for Atmospheric Chemistry, School of Earth Atmospheric and Life Sciences, University of
Wollongong, Wollongong, New South Wales, Australia. 7Max Planck Institute for Chemistry, Mainz, Germany. 8Institute of Global Climate and Ecology (Roshydromet and RAS), Moscow, Russia.
9
 National Center for Atmospheric Research, Boulder, CO, USA. 10Department of Physics, University of Toronto, Toronto, Ontario, Canada. 11Institute of Astrophysics and Geophysics, University of
Liège, Liège, Belgium. 12Ricardo Energy and Environment, Harwell, UK. 13These authors contributed equally: B. Franco, D. Taraborrelli. ✉e-mail: bfranco@ulb.ac.be; d.taraborrelli@fz-juelich.de

                                                                                                                                             Nature | Vol 593 | 13 May 2021 | 233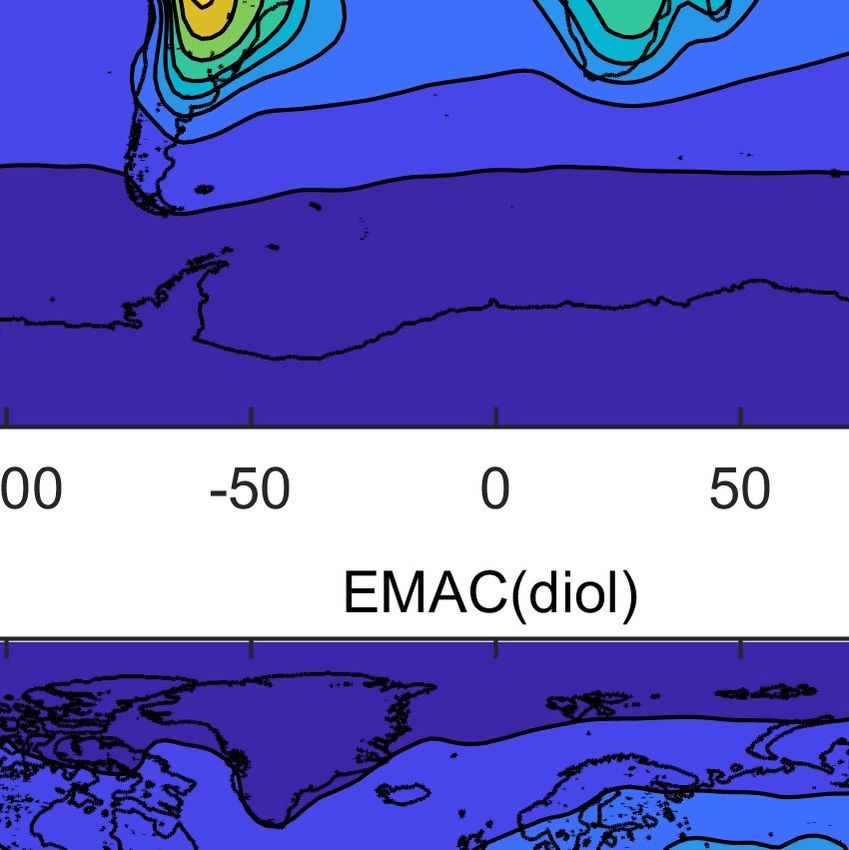
Article
a IASI b EMAC(base)
60° 60°
15
30° 30°
12
0° 0°
10
Total HCOOH column (1015 molecules cm–2)
–30° –30°
8
–60° –60°
7
–150° –100° –50° 0° 50° 100° 150° –150° –100° –50° 0° 50° 100° 150° 6
c EMAC(dioh) d EMAC(diol)
5
60° 60° 4
30° 30° 3
0° 0° 2
–30° –30° 1
–60° –60° 0
–150° –100° –50° 0° 50° 100° 150° –150° –100° –50° 0° 50° 100° 150°
e f
0.12 EMAC(base) versus IASI 0.12 EMAC(base) versus IASI
EMAC(dioh) versus IASI EMAC(diol) versus IASI
Probability of HCOOH column bias
0.10 0.10
0.08 0.08
0.06 0.06
0.04 0.04
0.02 0.02
0 0
–6 –4 –2 0 2 4 –6 –4 –2 0 2 4
HCOOH column bias (1015 molecules cm–2) HCOOH column bias (1015 molecules cm–2)
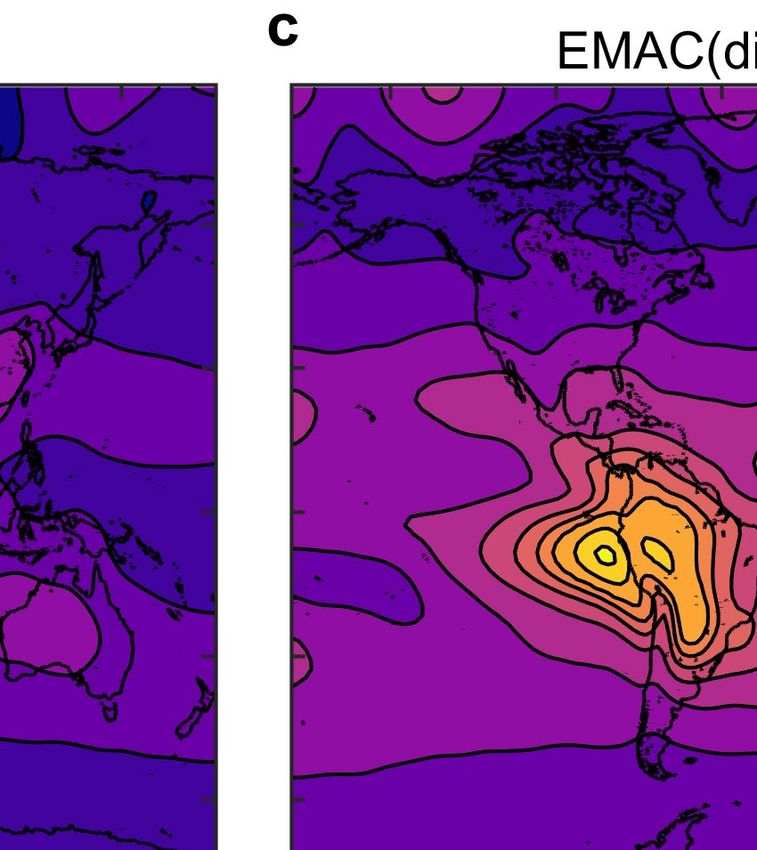
Fig. 1 | Formic acid abundance from satellite and model. a–d, Total formic the 1σ standard deviation is 1.64 × 10¹⁵ molecules cm−2. For EMAC(dioh) versus IASI
acid (HCOOH) column (colour scale) derived from IASI satellite observations (blue; e), the mean is −0.88 × 10¹⁵ molecules cm−2, the median is −0.66 × 10¹⁵
(a), or simulated by the base version of the model (EMAC(base); b) or by the model molecules cm−2 and the 1σ standard deviation is 1.62 × 10¹⁵ molecules cm−2. For
that implements the multiphase production of HCOOH (c, EMAC(dioh); EMAC(diol) versus IASI (green; f), the mean is 0.99 × 10¹⁵ molecules cm−2, the
d, EMAC(diol)). The HCOOH columns are means over 2010–2012. e, f, Probability median is 0.97 × 10¹⁵ molecules cm−2 and the 1σ standard deviation is
histograms of the HCOOH column bias between EMAC simulations and satellite 2.16 × 10¹⁵ molecules cm−2. A seasonal comparison is provided in Extended Data
data. For EMAC(base) versus IASI (purple; e, f), the mean column bias over 2010– Figs. 3, 4.
2012 is −1.97 × 10¹⁵ molecules cm−2, the median is −1.59 × 10¹⁵ molecules cm−2 and
produced in this manner is efficiently oxidized by OH in the aqueous place on timescales of 100–900 s. This is longer than the timescales
phase before outgassing. As a result, the net contribution of in-cloud of cloud-droplet evaporation and aqueous-phase diffusion, which are
HCOOH formation is small18. Because most methanediol is assumed to shorter than 100 s and 0.1–0.01 s, respectively22,23. Moreover, methan-
instantaneously dehydrate to formaldehyde before it volatilizes, global ediol transfer at the gas–liquid interface proceeds rapidly22. Therefore,
models do not explicitly represent methanediol and instead account the net flux is driven by the difference in chemical potential between
for direct aqueous-phase formation of HCOOH from formaldehyde19,20 the two phases. We provide evidence that methanediol reaction with
(Fig. 2). Using experimental kinetic data21, we calculate that under typi- OH in the gas phase quantitatively yields HCOOH under atmospheric
cal warm cloud conditions (260–300 K) methanediol dehydration takes conditions (Fig. 2). By conducting experiments with the atmospheric
234 | Nature | Vol 593 | 13 May 2021
The additional HCOOH production allows the model predictions to
                                                                                       reach the measured HCOOH levels derived from IASI and to reduce
                                                                                       the mean (±1σ) model-to-satellite biases from −1.97(±1.64) × 1015 mol-
                            HCHO                        HCHO                           ecules cm−2 for EMAC(base) to −0.88(±1.62) × 1015 molecules cm−2 for
                              OH
                                                    Slow                               EMAC(dioh) and 0.99(±2.16) × 1015 molecules cm−2 for EMAC(diol) (Fig. 1).
                                                 dehydration
                                   CO                                                  Similar improvements are observed with respect to the FTIR data
                                                                           Original    (Extended Data Fig. 1).
                         HOCH2OH                      HOCH2OH               model
                                                                           shortcut       Although the multiphase mechanism fills the gap between model
                                 OH                      OH                            and measurements globally, the EMAC(dioh) and EMAC(diol) simulations
                                                                                       overpredict the HCOOH columns over tropical forests and underpre-
                          HCOOH                        HCOOH                           dict the columns over boreal forests. We ascribe these remaining dis-
                                                                                       crepancies primarily to inaccuracies in the predicted formaldehyde
                           OH                                  OH
                                                                                       distributions as compared to Ozone Monitoring Instrument (OMI)/
        VOCs
                         Slow oxidation                         Rapid in-cloud loss    Aura measurements (Extended Data Fig. 5). Regional underestimation
                                                                                       (overestimation) of modelled formaldehyde translates through the
                                                 Wet and dry deposition                multiphase conversion to underprediction (overprediction) of HCOOH
                                                                                       (Extended Data Fig. 6). For instance, underestimated biomass-burning
                                                                                       emissions of VOCs lead to an underpredicted abundance of formalde-
                                                                                       hyde, and hence of HCOOH, such as during the 2010 Russian wildfires
                                                                                       (Extended Data Fig. 6a–d). Conversely, the too-high model tempera-
                                                                                       tures over Amazonia during the dry season induce an excess in isoprene
                                                                                       emissions, which results in too-high formaldehyde and HCOOH levels
Fig. 2 | Schematic of the multiphase production of formic acid. The common             (Extended Data Fig. 6i–l). More realistic VOC emissions, and enhanced
assumption in global atmospheric chemistry models is illustrated in black:             modelling of formaldehyde and its dependence on NOx, will eventu-
aqueous-phase methanediol (HOCH2OH) is neglected and aqueous-phase
                                                                                       ally lead to further improvements in predicted HCOOH. Fast reaction
formic acid (HCOOH) is assumed to form directly from formaldehyde (HCHO)
                                                                                       of HCOOH with stabilized Criegee intermediates have recently been
on reaction with OH. The implementation of HOCH2OH multiphase equilibria is
                                                                                       emphasized24,25. The overprediction of HCOOH over the tropical forests
illustrated in red: the explicit representation of the slow dehydration of
                                                                                       might be reduced if this additional sink were considered. Implementa-
aqueous-phase HOCH2OH, of its fast outgassing from cloud droplets and of its
OH-initiated oxidation in the gas phase leads to a pervasive production of             tion of α-hydroperoxycarbonyls photolysis9,26 and photo-oxidation of
gaseous HCOOH. Under typical daytime conditions with average                           aromatics27, and of a temperature-dependent solubility for methan-
[OH](g) = 1 × 10⁶ molecules cm−3 and [OH](aq) = 1 × 10 −13 mol l−1, the lifetimes of   ediol, would further improve the representation of HCOOH.
HOCH2OH against OH are about 1 × 10⁵ s and 3 × 10⁴ s, respectively. Under                 We present in Table 1 a revised atmospheric budget for HCOOH,
typical midday conditions with [OH](g) = 5 × 10⁶ molecules cm−3, the gas-phase         which we compare to estimates from recent studies6–9 (the contribu-
sink is five times stronger. Thus, gas-phase oxidation sustains the chemical           tion of single chemical terms is provided in Extended Data Table 1).
gradient that drives HOCH2OH from the aqueous to the gas phase.                        EMAC(dioh) and EMAC(diol) provide, respectively, lower and higher esti-
                                                                                       mates of the extra HCOOH produced via the multiphase processing of
                                                                                       formaldehyde. EMAC(diol) yields an increase by a factor of five of the total
simulation chamber SAPHIR (Supplementary Information, section 1),                      photochemical source predicted by EMAC(base) (190.9 Tg yr−1 compared
we show that formaldehyde in aqueous solution is efficiently converted                 to 37.7 Tg yr−1), and gas-phase oxidation of methanediol becomes the
to gaseous methanediol immediately after injection, which quantita-                    dominant contributor to atmospheric HCOOH (150.6 Tg yr−1). Although
tively yields HCOOH on photo-oxidation (Fig. 3). This is supported                     EMAC(dioh) assumes that methanediol is 100 times more soluble (com-
by theoretical calculations (Supplementary Information, section 2).                    pared to EMAC(diol)), it still yields an increase by a factor of two in photo-
Hence, the competition between the gas- and aqueous-phase oxidation                    chemical production (83.5 Tg yr−1). This is in line with previous estimates
of methanediol determines the phase in which HCOOH is predomi-                         of the missing HCOOH sources, which include, from source inversions,
nantly produced.                                                                       direct HCOOH emissions from vegetation or the OH-initiated oxida-
   We implemented in EMAC the explicit kinetic model for the                           tion of a short-lived, unidentified biogenic precursor7. The second
aqueous-phase transformations and bidirectional phase transfer of                      largest source is VOC ozonolysis (about 31 Tg yr−1); other sources are
methanediol (Supplementary Information, section 3). The solubility of                  below 4 Tg yr−1.
methanediol is not known at any temperature and estimates of it span                      The extra HCOOH production leads to a more realistic prediction of
two orders of magnitude at 298 K. We gauge the effect of this uncertainty              atmospheric organic acids and substantially increases atmospheric
on the results by performing the simulations EMAC(diol) and EMAC(dioh),                acidity globally (Extended Data Fig. 7). Compared to EMAC(base),
which implement the multiphase chemistry of methanediol with Hen-                      EMAC(dioh) and EMAC(diol) predict a decrease in the pH of clouds and
ry’s law constants (solubilities) for methanediol of around 104 M atm−1                rainwater in the tropics by as much as 0.2 and 0.3, respectively. The
and 106 M atm−1, respectively (Methods). At the temperatures prevailing                high moisture content, extended cloud cover and high temperatures
inside the clouds, the kinetic barrier strongly limits the dehydration                 that prevail in tropical and similar environments facilitate the produc-
of methanediol, allowing large amounts to be produced and then out-                    tion of HCOOH via formation and outgassing of the relevant gem-diol.
gassed. Over regions with high levels of gas-phase formaldehyde and in                 Higher acidity is also predicted at North Hemisphere mid-latitudes in
the presence of clouds, large methanediol fluxes to the gas phase are                  summertime, notably over boreal forests, consistent with previous
predicted (Extended Data Fig. 2). Eventually, rapid gas-phase oxida-                   predictions7.
tion of methanediol by OH forms HCOOH, resulting in a substantial                         The multiphase production of HCOOH affects predictions for for-
increase in the predicted HCOOH columns, by a factor of 2–4 compared                   maldehyde and carbon monoxide (CO). Both gases are important for
to EMAC(base) (Fig. 1, Extended Data Figs. 3, 4). Because cloud droplets               tropospheric ozone and radical cycles, and are usually the target of
may potentially form everywhere and formaldehyde is ubiquitous in the                  satellite-driven inversion modelling. EMAC(dioh) and EMAC(diol) predict
troposphere (Extended Data Fig. 5), the HCOOH enhancement occurs                       decreases of up to 10% and 20%, respectively, in formaldehyde columns
both in high-VOC concentration regions and in remote environments.                     over tropical source regions during specific months (Extended Data

                                                                                                                          Nature | Vol 593 | 13 May 2021 | 235
Article
Stage I Stage II Stage III
Dark conditions Photo-oxidation Suppressed photo-oxidation
+2&+2+ J + OH(g) +&22+ J
HOCH2OH(aq) +2&+2+ J
Key HOCH2OH(wall) +&+2 J
+&+2 J + OH(g) CO(g)
reactions HOCH2OH(wall) +&+2 J
HOCH2OH(wall) +&+2 J
20 Formaldehyde
Methanediol
Formic acid
16
Gas-phase mixing ratio (ppbv)
12
Formalin injection
8
CO addition
4
[OH]g = 0 molecules cm–3 [OH]g = 7 × 10⁶ molecules cm–3 [OH]g = 0 molecules cm–3
0
09:30 10:00 10:30 11:00 11:30 12:00 12:30 13:00 13:30 14:00
Time (UTC)
Fig. 3 | Multiphase production of formic acid in the SAPHIR chamber. The of the formalin (stabilized formaldehyde) solution into the Teflon chamber,
formaldehyde (HCHO) mixing ratio was measured (in parts per billion by HOCH2OH immediately outgasses from the droplets. The chamber roof is
volume, ppbv) by differential optical absorption spectroscopy (black), initially closed (stage I). The gas-phase HCHO mixing ratio is initially very low,
whereas the sum of HCHO and methanediol (HOCH2OH) was measured using but increases to be as abundant as HOCH2OH just before the start of the
the Hantzsch method. The difference between the Hantzsch and differential photo-oxidation when the roof is opened (stage II). The decay of the HCHO and
optical absorption spectroscopy signals enables visualization of HOCH2OH HOCH2OH signals is concurrent with an additional production of HCOOH.
(blue). Formic acid (HCOOH) was monitored by using proton-transfer reaction Finally, addition of carbon monoxide (CO) as an OH scavenger enabled
time-of-flight mass spectrometry (red). The instrument uncertainties quantification of the wall effects (stage III). Experimental details are provided
(shading) are 5% for HCHO, 12% for HOCH2OH and 20% for HCOOH. On injection in Supplementary Information, sections 1 and 4.
Table 1 | Atmospheric budget for formic acid
Budget terms GEOS-Chem6,8 IMAGES v27 MAGRITTE v1.19 EMAC(base) EMAC(dioh)–EMAC(diol)
Sources (Tg yr ) −1
Anthropogenic 2.3–6.3 4.0 2.2 2.9 2.9
Biomass burning 1.5 4.0 3.0 2.5 2.5
Terrestrial biogenic 2.7–4.4 5.6 5.6 0a
0a
Photochemical 48.6–51.0 88.6 32.9 37.7 83.5–190.9
Total 56.7–61.5 102.0b 43.7 43.1 88.9–196.3
Sinks (Tg yr−1)
Dry deposition 48.8–50.6 33.6 - 10.6 15.7–25.5
Scavenging 40 18.6c 48.6–126.4c
Photochemical 9.5–10.6 28.4 - 13.2 23.6–42.7
Total 56.8–62.3 104 - 42.4 87.8–194.6
Burden (Tg) - - - 0.55 1.0–1.8
Lifetime (days) 3.2 4.3 - 4.7 3.4–4.1
The table shows modelled global budget terms for formic acid (HCOOH), calculated by GEOS-Chem v8.36 (2004–2008 average), GEOS-Chem8 (unknown version; 2013), IMAGES v27 (2009),
MAGRITTE v1.19 (2013), EMAC v2.53.0 (EMAC(base); standard version; 2010) and EMAC v2.53.0 with the multiphase chemistry of methanediol (EMAC(dioh)–EMAC(diol); 2010). The contribution of
single chemical terms is provided in Extended Data Table 1.
a
The biogenic bidirectional fluxes from the MEGAN v2.04 model were not considered.
b
Obtained by inverse modelling with the first IASI distribution of HCOOH7.
c
Net of in-cloud production and destruction and of rainout (Extended Data Table 1).
236 | Nature | Vol 593 | 13 May 2021
Fig. 8). We anticipate that the estimates of regional hydrocarbon emis-                               11.   Jöckel, P. et al. Development cycle 2 of the modular earth submodel system (MESSy2).
                                                                                                            Geosci. Model Dev. 3, 717–752 (2010).
sions based on formaldehyde source inversions will be improved once
                                                                                                      12.   Shaw, M. F. et al. Photo-tautomerization of acetaldehyde as a photochemical source of
the multiphase mechanism is accounted for. The reduced formalde-                                            formic acid in the troposphere. Nat. Commun. 9, 2584 (2018).
hyde concentrations result in lower modelled CO yield from methane                                    13.   Franco, B. et al. A general framework for global retrievals of trace gases from IASI:
                                                                                                            application to methanol, formic acid, and PAN. J. Geophys. Res. Atmospheres 123,
oxidation, notably over remote areas, where methane oxidation is
                                                                                                            13963–13984 (2018).
the main source of atmospheric CO (Extended Data Fig. 9). Globally,                                   14.   Chaliyakunnel, S., Millet, D. B., Wells, K. C., Cady-Pereira, K. E. & Shephard, M. W. A large
the average tropospheric CO yield from methane oxidation changes                                            underestimate of formic acid from tropical fires: constraints from space-borne
                                                                                                            measurements. Environ. Sci. Technol. 50, 5631–5640 (2016).
from 0.91 for EMAC(base) to 0.88 for EMAC(diol) and 0.90 for EMAC(dioh), in
                                                                                                      15.   Alwe, H. D. et al. Oxidation of volatile organic compounds as the major source of formic
agreement with isotope-enabled inversion estimates28.                                                       acid in a mixed forest canopy. Geophys. Res. Lett. 46, 2940–2948 (2019).
   We have shown that a multiphase pathway involving aldehyde                                         16.   Chen, X. et al. On the sources and sinks of atmospheric VOCs: an integrated analysis of
                                                                                                            recent aircraft campaigns over North America. Atmos. Chem. Phys. 19, 9097–9123 (2019).
hydrates is decisive in predicting organic acid formation and atmos-
                                                                                                      17.   Mungall, E. L. et al. High gas-phase mixing ratios of formic and acetic acid in the High
pheric acidity. It could also be important in the presence of deliquescent                                  Arctic. Atmos. Chem. Phys. 18, 10237–10254 (2018).
aerosols and would explain the elevated HCOOH levels in cloud-free                                    18.   Jacob, D. J. Chemistry of OH in remote clouds and its role in the production of formic acid
                                                                                                            and peroxymonosulfate. J. Geophys. Res. 91, 9807–9826 (1986).
conditions29. Given the favourable hydration equilibrium constants                                    19.   Tost, H., Jöckel, P., Kerkweg, A., Sander, R. & Lelieveld, J. Technical note: a new
for major C2–C3 carbonyls30, this pathway opens up avenues for more                                         comprehensive SCAVenging submodel for global atmospheric chemistry modelling.
realistic representation of other abundant organic acids, and hence                                         Atmos. Chem. Phys. 6, 565–574 (2006).
                                                                                                      20.   Sander, R. et al. The community atmospheric chemistry box model CAABA/MECCA-4.0.
of cloud-droplet nucleation and cloud evolution. We expect the mul-                                         Geosci. Model Dev. 12, 1365–1385 (2019).
tiphase processing for glyoxal and methylglyoxal to be important for                                  21.   Winkelman, J. G. M., Voorwinde, O. K., Ottens, M., Beenackers, A. A. C. M. & Janssen, L. P.
explaining the observed concentrations of oxalic and pyruvic acids4.                                        B. M. Kinetics and chemical equilibrium of the hydration of formaldehyde. Chem. Eng.
                                                                                                            Sci. 57, 4067–4076 (2002).
Understanding these multiphase processes advances our knowledge                                       22.   Sander, R. Modeling atmospheric chemistry: interactions between gas-phase species
of atmospheric reactive carbon oxidation chains and of chemistry–                                           and liquid cloud/aerosol particles. Surv. Geophys. 20, 1–31 (1999).
climate interactions.                                                                                 23.   Jarecka, D., Grabowski, W. W., Morrison, H. & Pawlowska, H. Homogeneity of the
                                                                                                            subgrid-scale turbulent mixing in large-eddy simulation of shallow convection. J. Atmos.
                                                                                                            Sci. 70, 2751–2767 (2013).
                                                                                                      24.   Vereecken, L., Novelli, A. & Taraborrelli, D. Unimolecular decay strongly limits the
Online content                                                                                              atmospheric impact of Criegee intermediates. Phys. Chem. Chem. Phys. 19, 31599–31612
                                                                                                            (2017).
Any methods, additional references, Nature Research reporting sum-                                    25.   Caravan, R. L. et al. Direct kinetic measurements and theoretical predictions of an
maries, source data, extended data, supplementary information,                                              isoprene-derived Criegee intermediate. Proc. Natl Acad. Sci. USA 117, 9733–9740 (2020).
acknowledgements, peer review information; details of author contri-                                  26.   Liu, Z., Nguyen, V. S., Harvey, J., Müller, J.-F. & Peeters, J. The photolysis of
                                                                                                            α-hydroperoxycarbonyls. Phys. Chem. Chem. Phys. 20, 6970–6979 (2018).
butions and competing interests; and statements of data and code avail-                               27.   Wang, S. et al. Aromatic photo-oxidation, a new source of atmospheric acidity. Environ.
ability are available at https://doi.org/10.1038/s41586-021-03462-x.                                        Sci. Technol. 54, 7798–7806 (2020).
                                                                                                      28.   Bergamaschi, P., Hein, R., Brenninkmeijer, C. A. M. & Crutzen, P. J. Inverse modeling of the
                                                                                                            global CO cycle: 2. Inversion of 13C/12C and 18O/16O isotope ratios. J. Geophys. Res.
1.    Galloway, J. N., Likens, G. E., Keene, W. C. & Miller, J. M. The composition of precipitation         Atmospheres 105, 1929–1945 (2000).
      in remote areas of the world. J. Geophys. Res. 87, 8771–8786 (1982).                            29.   Yuan, B. et al. Investigation of secondary formation of formic acid: urban environment vs.
2.    Keene, W. C. et al. Atmospheric wet deposition in remote regions: benchmarks for                      oil and gas producing region. Atmos. Chem. Phys. 15, 1975–1993 (2015).
      environmental change. J. Atmos. Sci. 72, 2947–2978 (2015).                                      30.   Doussin, J.-F. & Monod, A. Structure–activity relationship for the estimation of
3.    Kjær, H. A. et al. An optical dye method for continuous determination of acidity in ice               OH-oxidation rate constants of carbonyl compounds in the aqueous phase. Atmos.
      cores. Environ. Sci. Technol. 50, 10485–10493 (2016).                                                 Chem. Phys. 13, 11625–11641 (2013).
4.    Yu, S. Role of organic acids (formic, acetic, pyruvic and oxalic) in the formation of cloud
      condensation nuclei (CCN): a review. Atmos. Res. 53, 185–217 (2000).                            Publisher’s note Springer Nature remains neutral with regard to jurisdictional claims in
5.    Chameides, W. L. & Davis, D. D. Aqueous-phase source of formic acid in clouds. Nature           published maps and institutional affiliations.
      304, 427–429 (1983).
6.    Paulot, F. et al. Importance of secondary sources in the atmospheric budgets of formic                             Open Access This article is licensed under a Creative Commons Attribution
      and acetic acids. Atmos. Chem. Phys. 11, 1989–2013 (2011).                                                         4.0 International License, which permits use, sharing, adaptation, distribution
7.    Stavrakou, T. et al. Satellite evidence for a large source of formic acid from boreal and                          and reproduction in any medium or format, as long as you give appropriate
      tropical forests. Nat. Geosci. 5, 26–30 (2012).                                                 credit to the original author(s) and the source, provide a link to the Creative Commons license,
8.    Millet, D. B. et al. A large and ubiquitous source of atmospheric formic acid. Atmos.           and indicate if changes were made. The images or other third party material in this article are
      Chem. Phys. 15, 6283–6304 (2015).                                                               included in the article’s Creative Commons license, unless indicated otherwise in a credit line
9.    Müller, J.-F., Stavrakou, T. & Peeters, J. Chemistry and deposition in the model of             to the material. If material is not included in the article’s Creative Commons license and your
      atmospheric composition at global and regional scales using inversion techniques for            intended use is not permitted by statutory regulation or exceeds the permitted use, you will
      trace gas emissions (MAGRITTE v1.1). Part 1: chemical mechanism. Geosci. Model Dev. 12,         need to obtain permission directly from the copyright holder. To view a copy of this license,
      2307–2356 (2019).                                                                               visit http://creativecommons.org/licenses/by/4.0/.
10.   Chebbi, A. & Carlier, P. Carboxylic acids in the troposphere, occurrence, sources, and
      sinks: a review. Atmos. Environ. 30, 4233–4249 (1996).                                          © The Author(s) 2021

                                                                                                                                                   Nature | Vol 593 | 13 May 2021 | 237
Article
Methods                                                                         2010–2012) are used per 1.8° × 1.8° model grid box at the Equator. This
                                                                                number increases with latitude and with the higher spatial sampling
Model setup and simulations                                                     of IASI, owing to the satellite polar orbits.
Simulations were performed with the ECHAM5/MESSy v2.53.0 model11                   Version 3 of the artificial neural network for IASI (ANNI) was applied to
(EMAC) on the JURECA supercomputer31. A horizontal resolution of T63            retrieve HCOOH abundances from the IASI measurements (see refs. 13,45
(about 1.8° × 1.8°), with 31 vertical layers from the surface up to the lower   for a comprehensive description of the retrieval algorithm and the
stratosphere at 10 hPa, was applied. Chemical feedbacks are deactivated         HCOOH product). The ANNI framework was specifically designed to
by using the quasi chemical transport mode32. Biomass-burning emis-             provide a robust and unbiased retrieval of weakly absorbing trace gases
sions are calculated with the Global Fire Assimilation System (GFAS)            such as HCOOH. The retrieval relies on a neural network to convert
inventory33. The emission factors for organic compounds were taken              weak spectral signatures to a total column, accounting for the state
from ref. 34, except the ones for aromatics, which were taken from refs.        of the surface and atmosphere at the time and place of the overpass of
35,36
     . Anthropogenic emissions of NOx and organic compounds were                IASI. The vertical sensitivity of IASI to HCOOH peaks between 1 km and
taken from ACCMIP37. The chosen gas-phase chemical mechanism                    6 km, gradually decreasing outside that range46. However, by assuming
includes a state-of-the-art representation of terpene and aromatics             that HCOOH is distributed vertically according to a certain profile, the
oxidation chemistry20. The EMAC cloud and precipitation parameteri-             neural network is able to provide an estimate of the total column of
zation follows ref. 38.                                                         HCOOH. Because the ANNI retrievals do not rely on a priori informa-
    In the reference model simulation (EMAC(base)), HCOOH production            tion, no averaging kernels are produced and the retrieved columns are
proceeds through the ozonolysis of alkenes with terminal double bonds           meant to be used at face value for carrying out unbiased comparisons
(simple alkenes and degradation products of isoprene and monoterpe-             with model data (see ref. 13 and references therein for the rationale).
nes), alkyne oxidation, reaction of formaldehyde with the peroxy radi-          Data filtering prevents retrieval over cloudy scenes and post-filtering
cal, oxidation of enols, and formation from vinyl alcohol39. Nonetheless,       discards scenes for which the sensitivity to HCOOH is too low for a
we exclude the OH-initiated oxidation of isoprene and monoterpenes,             meaningful retrieval.
the corresponding mechanisms of which are still speculative6,8,40,41, as           The HCOOH product comes with its own pixel-dependent esti-
well as the reaction of methyl peroxy radical with OH, which was shown          mate of random uncertainties, calculated by propagating the uncer-
not to yield HCOOH42. A detailed description of the relevant chemical           tainties of each input variable of the neural network13. For a typical
kinetics, budget terms and deposition parameters for each model                 non-background HCOOH abundance ((0.3–2.0) × 1015 molecules cm−2),
simulation is provided in Supplementary Information, section 3a.                the relative uncertainty on an individual retrieved column ranges from
    Two simulations with the explicit multiphase model for methan-              10% to 50%, with the highest uncertainties found for the low columns.
ediol, EMAC(dioh) and EMAC(diol), are described in detail in Supplementary      This uncertainty increases for lower-background columns as the weaker
Information, section 3b. The simulations differ only by the value of the        HCOOH concentrations approach the IASI detection threshold. How-
Henry’s law constant (solubility) of methanediol, for which no experi-          ever, these random uncertainties become negligible for the column
mental measurements are available. Values of about 104 M atm−1 and              averages presented here, because of the total number of measurements
106 M atm−1 are used for EMAC(diol) and EMAC(dioh), respectively. These         per grid cell. With respect to systematic uncertainties, the main term
are possible values of the Henry’s law constant for methanediol, given          is related to the assumption of a fixed HCOOH vertical profile. It is not
the spread of estimates at 298 K by semi-empirical methods and the              possible to quantify this uncertainty on an individual-pixel basis, but
expected temperature dependence. However, higher values (around                 it was estimated to not exceed 20% on average13. A comparison with
107 M atm−1) cannot be excluded at typical temperatures of warm clouds          independent HCOOH columns from ground-based FTIR measurements
(Supplementary Information, section 3b.iii).                                    at various latitudes and environments confirmed the absence of any
    For the comparison with IASI and OMI observations (Fig. 1, Extended         large systematic biases of the IASI data45. Although biases of around 20%
Data Figs. 3–6), the HCOOH and formaldehyde volume mixing ratio                 cannot be excluded, in the context of this work, the accuracy of the IASI
profiles simulated by EMAC are sampled along the Sun-synchronous                product is sufficient to demonstrate the initial model underprediction
satellite Metop-A and Aura orbits, respectively, at the time and location       (EMAC(base)) of the HCOOH columns and the large improvements from
of the IASI and OMI measurements, using the SORBIT submodel11. The              the multiphase mechanism.
sampled volume mixing ratios are then daily averaged and computed
in HCOOH and formaldehyde columns.                                              Theoretical predictions
    Model sources of uncertainties, including the formation of a                Quantum chemical calculations were performed at various levels
HCOOH·H2O complex with water vapour43, are discussed in Supple-                 of theory, up to CCSD(T)/CBS(DTQ)//IRCMax(CCSD(T)//M06-2X/
mentary Information, section 5.                                                 aug-cc-pVQZ), and combined with E,J-μVTST multi-conformer micro-
                                                                                variational transition-state calculations to obtain rate coefficients for
IASI column observations                                                        the gas-phase high-pressure-limit rate coefficients (Supplementary
IASI44 is a nadir-viewing Fourier transform spectrometer launched on            Information, section 2).
board the Metop-A, -B and -C platforms in October 2006, September
2012 and November 2018, respectively. IASI measures in the thermal
infrared, between 645 cm−1 and 2,760 cm−1. It records radiance from the         Data availability
Earth’s surface and the atmosphere, with an apodized spectral resolu-           The EMAC model data are publicly accessible at https://doi.org/10.5281/
tion of 0.5 cm−1, spectrally sampled at 0.25 cm−1. In the spectral range        zenodo.4315292, https://doi.org/10.5281/zenodo.4315276 and https://
in which the HCOOH ν6 Q branch absorbs (about 1,105 cm−1), IASI has a           doi.org/10.5281/zenodo.4314730. The IASI measurements may be found
radiometric noise of around 0.15 K for a reference blackbody at 280 K.          at https://doi.org/10.5281/zenodo.4314367. The OMI measurements are
IASI provides near global coverage twice per day, with observations at          openly distributed via the Quality Assurance for Essential Climate Vari-
around 09:30 am and 09:30 pm, local time. Here, the HCOOH columns               ables repository (https://doi.org/10.18758/71021031). The FTIR observa-
are derived from IASI/Metop-A (covering 2010–2012). Only the morning            tions are publicly accessible at https://doi.org/10.5281/zenodo.4321348
satellite overpasses are used, because such observations have a higher          and https://doi.org/10.5445/IR/1000127831. Data from the experiments
measurement sensitivity13. For comparison with EMAC simulations,                are available on the Eurochamp database (https://doi.org/10.25326/
the 2010–2012 IASI data are daily averaged on the model spatial grid.           Q00C-MY65, https://doi.org/10.25326/KHYY-FP10, https://doi.
On average, 17 satellite measurements per day (more than 18,000 over            org/10.25326/BC4N-TY93 and https://doi.org/10.25326/DAS4-7Q54).
The raw quantum chemical data are provided in Supplementary Infor-                                    600405). L.C. and E.M. are research associates with the F.R.S.–FNRS (Brussels). The IASI
                                                                                                      mission is a joint mission of EUMETSAT and the Centre National d’Etudes Spatiales (CNES,
mation, section 10. Source data are provided with this paper.                                         France). This work received funding from the Initiative and Networking Fund of the Helmholtz
                                                                                                      Association through the projects ‘Advanced Earth System Modelling Capacity (ESM)’ and ‘Pilot
                                                                                                      Lab Exascale Earth System Modelling (PL-ExaESM)’. The content of this paper is the sole
Code availability                                                                                     responsibility of the author(s) and it does not represent the opinion of the Helmholtz
                                                                                                      Association, and the Helmholtz Association is not responsible for any use that might be made
The Modular Earth Submodel System (MESSy) is continuously being                                       of the information contained. Most IASI activities were supported by the Belgian State Federal
developed and applied by a consortium of institutions. The usage of                                   Office for Scientific, Technical and Cultural Affairs (Prodex arrangement IASI.FLOW). OMI
                                                                                                      HCHO developments at BIRA were supported by the EU FP7 QA4ECV project, in close
MESSy and access to the source code is licensed to all affiliates of insti-                           cooperation with KNMI, University of Bremen, MPIC-Mainz and WUR (http://www.qa4ecv.eu/
tutions that are members of the MESSy Consortium. Institutions can                                    ecv/hcho-p). The FTIR monitoring program of ULiège at Jungfraujoch benefited from the
become a member of the MESSy Consortium by signing the MESSy                                          involvement of C. Servais and O. Flock. It was primarily funded by the F.R.S.–FNRS (grant
                                                                                                      no. J.0147.18), the Fédération Wallonie-Bruxelles and the GAW-CH program of MeteoSwiss. We
Memorandum of Understanding (more information at http://www.                                          acknowledge the International Foundation High Altitude Research Stations Jungfraujoch and
messy-interface.org). The modifications presented here were imple-                                    Gornergrat (HFSJG, Bern) for supporting the facilities needed to perform the FTIR observations
mented on MESSy v2.53.0. The source code used to produce the results                                  at Jungfraujoch. Eureka FTIR measurements were made at the Polar Environment Atmospheric
                                                                                                      Research Laboratory (PEARL) by the Canadian Network for the Detection of Atmospheric
is archived at the Jülich Supercomputing Centre and can be made avail-                                Change (CANDAC), led by J. R. Drummond, and in part by the Canadian Arctic ACE/OSIRIS
able to members of the MESSy community on request.                                                    Validation Campaigns, led by K. A. Walker; support was provided by AIF/NSRIT, CFI, CFCAS,
                                                                                                      CSA, ECCC, GOC-IPY, NSERC, NSTP, OIT, PCSP and ORF. Toronto FTIR measurements were
31.   Krause, D. & Thörnig, P. JURECA: modular supercomputer at Jülich Supercomputing                 made at the University of Toronto Atmospheric Observatory, supported by CSA, NSERC, ECCC
      Centre. J. Large-scale Res. Facil. 4, A132 (2018).                                              and UofT. The National Center for Atmospheric Research is sponsored by the National Science
32.   Deckert, R., Jöckel, P., Grewe, V., Gottschaldt, K.-D. & Hoor, P. A quasi chemistry-transport   Foundation. The NCAR FTS observation programmes at Thule (GR) and Boulder (CO) are
      model mode for EMAC. Geosci. Model Dev. 4, 195–206 (2011).                                      supported under contract by NASA. The Thule work is also supported by the NSF Office of
33.   Kaiser, J. W. et al. Biomass burning emissions estimated with a global fire assimilation        Polar Programs (OPP). We thank the Danish Meteorological Institute for support at the Thule
      system based on observed fire radiative power. Biogeosciences 9, 527–554 (2012).                site. The Wollongong solar remote sensing program has been supported through a series of
34.   Akagi, S. K. et al. Emission factors for open and domestic biomass burning for use in           Australian Research Council grants, most recently DP160101598. Funding via Helmholtz ATMO
      atmospheric models. Atmos. Chem. Phys. 11, 4039–4072 (2011).                                    programme has enabled sustained NDACC FTIR activities at Kiruna and Izana since the late
35.   Andreae, M. O. & Merlet, P. Emission of trace gases and aerosols from biomass burning.          1990s. The Izana NDACC FTIR observations strongly rely on the support (facilities and
      Glob. Biogeochem. Cycles 15, 955–966 (2001).                                                    operational activities) of the Izana Atmospheric Research Centre of the Spanish Weather
36.   Cabrera-Perez, D., Taraborrelli, D., Sander, R. & Pozzer, A. Global atmospheric budget of       Service (AEMET), with lead contributions of O. E. García. Researchers from KIT thank
      simple monocyclic aromatic compounds. Atmos. Chem. Phys. 16, 6931–6947 (2016).                  U. Raffalski and P. Voelger (Swedish Institute of Space Physics; IRF) for continuing support of
37.   Lamarque, J.-F. et al. Historical (1850–2000) gridded anthropogenic and biomass burning         the NDACC FTIR site Kiruna. We thank Université de La Réunion and CNRS (LACy-UMR8105 and
      emissions of reactive gases and aerosols: methodology and application. Atmos. Chem.             UMS3365) for financial support of the FTIR instrumentation at St-Denis, and C. Hermans,
      Phys. 10, 7017–7039 (2010).                                                                     F. Scolas (BIRA-IASB) and J.-M. Metzger (Université de La Réunion) for FTIR maintenance.
38.   Tost, H., Jöckel, P. & Lelieveld, J. Influence of different convection parameterisations in a   The IASI HCOOH data and FTIR HCOOH data at St-Denis are currently obtained through the
      GCM. Atmos. Chem. Phys. 6, 5475–5493 (2006).                                                    BRAIN-be project OCTAVE, financed by the Belgian Science Policy Office (BELSPO).
39.   So, S., Wille, U. & da Silva, G. Atmospheric chemistry of enols: a theoretical study of the
      vinyl alcohol + OH + O2 reaction mechanism. Environ. Sci. Technol. 48, 6694–6701 (2014).        Author contributions B.F. and D.T. initiated and coordinated the study, designed and
40.   Butkovskaya, N. I., Pouvesle, N., Kukui, A., Mu, Y. & Bras, G. L. Mechanism of the              performed the EMAC simulations, performed the data analyses, prepared the figures and
      OH-initiated oxidation of hydroxyacetone over the temperature range 236–298 K. J. Phys.         wrote the manuscript. D.T., R.S. and S.R. developed and implemented the multiphase
      Chem. A 110, 6833–6843 (2006).                                                                  mechanism for formaldehyde. S.G. prepared the initial setup of the model, provided the tools
41.   Butkovskaya, N. I., Pouvesle, N., Kukui, A. & Bras, G. L. Mechanism of the OH-initiated         to obtain the formic acid budget and CO yield from methane oxidation. T.E. and A.K.
      oxidation of glycolaldehyde over the temperature range 233–296 K. J. Phys. Chem. A 110,         implemented the revised dry deposition scheme. C. Cho, H.-P.D., H.F., G.G., T.H., A.N., D.R., R.T.,
      13492–13499 (2006).                                                                             D.T. and L.V. conducted, analysed and described the SAPHIR experiments; L.V. performed and
42.   Assaf, E. et al. The reaction between CH3O2 and OH radicals: product yields and                 described the theoretical calculations for the gas-phase methanediol oxidation. B.F., L.C., M.P.,
      atmospheric implications. Environ. Sci. Technol. 51, 2170–2177 (2017).                          C. Clerbaux and P.-F.C. performed the IASI retrievals and provided the IASI dataset. I.D.S. and
43.   Iuga, C., Alvarez-Idaboy, J. R. & Vivier-Bunge, A. Mechanism and kinetics of the                M.V.R. provided the OMI dataset and expertise on OMI data usage. E.M., T.B., M.D.M., D.W.T.G.,
      water-assisted formic acid + OH reaction under tropospheric conditions. J. Phys. Chem. A        J.W.H., F.H., N.J., E.L., I.O., C.P.-W., M.S., K.S. and C.V. contributed to instrument operation,
      115, 5138–5146 (2011).                                                                          performed the retrievals and/or provided the FTIR datasets. A.K.-S., A.W., A.P., L.C., P.-F.C. and
44.   Clerbaux, C. et al. Monitoring of atmospheric composition using the thermal infrared            E.M. contributed to discussions of the results and preparation of the manuscript.
      IASI/MetOp sounder. Atmos. Chem. Phys. 9, 6041–6054 (2009).
45.   Franco, B. et al. Spaceborne measurements of formic and acetic acids: a global view of          Funding Open access funding provided by Forschungszentrum Jülich GmbH.
      the regional sources. Geophys. Res. Lett. 47, e2019GL086239 (2020).
46.   Pommier, M. et al. HCOOH distributions from IASI for 2008–2014: comparison with                 Competing interests The authors declare no competing interests.
      ground-based FTIR measurements and a global chemistry-transport model. Atmos.
      Chem. Phys. 16, 8963–8981 (2016).                                                               Additional information
                                                                                                      Supplementary information The online version contains supplementary material available at
                                                                                                      https://doi.org/10.1038/s41586-021-03462-x.
Acknowledgements We acknowledge the computing time granted by the JARA-HPC                            Correspondence and requests for materials should be addressed to B.F. or D.T.
Vergabegremium and VSR commission on the supercomputer JURECA at Forschungszentrum                    Peer review information Nature thanks the anonymous reviewer(s) for their contribution to the
Jülich. B.F. was partly supported by a Marie Curie COFUND postdoctoral fellow grant                   peer review of this work. Peer reviewer reports are available.
co-funded by the University of Liège and the European Union (FP7-PEOPLE, project ID                   Reprints and permissions information is available at http://www.nature.com/reprints.
Article
a 10 15
b 10 15
10 Bias = -8.6e+14 molec cm -2 10 Bias = -2.2e+15 molec cm -2
Eureka RMSE = 1.4e+15 molec cm -2 Thule RMSE = 2.9e+15 molec cm -2
(80.1° N, 86.4° W, 610 m a.s.l.) (76.5° N,68.8° W, 220 m a.s.l.)
Column (molecules cm-2)
Column (molecules cm-2)
8 Bias = 1.5e+14 molec cm-2 8 Bias = -1.3e+15 molec cm -2
RMSE = 9.8e+14 molec cm -2 RMSE = 2.2e+15 molec cm -2
6 6
Bias = 1.5e+15 molec cm-2 Bias = -1.0e+14 molec cm -2
RMSE = 1.9e+15 molec cm -2 RMSE = 1.8e+15 molec cm -2
4 4
2 2
0 0
J F M A M J J A S O N D J F M A M J J A S O N D
c 10 15 d 10 15
10 Bias = -1.9e+15 molec cm -2 5 Bias = 9.3e+13 molec cm-2
Kiruna RMSE = 2.2e+15 molec cm -2 Jungfraujoch RMSE = 5.4e+14 molec cm -2
(67.8° N, 20.4° E, 419 m a.s.l.) (46.6° N, 8.0° E, 3,580 m a.s.l.)
Column (molecules cm-2)
Column (molecules cm-2)
8 Bias = -1.0e+15 molec cm -2 4 Bias = 9.6e+14 molec cm-2
RMSE = 1.4e+15 molec cm -2 RMSE = 1.1e+15 molec cm -2
6 3
Bias = 1.9e+14 molec cm-2 Bias = 2.2e+15 molec cm-2
RMSE = 1.0e+15 molec cm -2 RMSE = 2.3e+15 molec cm -2
4 2
2 1
0 0
J F M A M J J A S O N D J F M A M J J A S O N D
e 10 16
f 10 15
3.0 Bias = -6.9e+15 moleccm -2 10 Bias = -2.0e+15 molec cm -2
Toronto RMSE = 1.0e+16 molec cm -2 Boulder RMSE = 2.6e+15 molec cm -2
(43.7° N, 79.4° W, 174 m a.s.l.) (40.0° N, 102.5° W, 1,634 m a.s.l.)
Column (molecules cm-2)
Column (molecules cm-2)
2.5
Bias = -5.3e+15 molec cm -2 8 Bias = -9.6e+14 molec cm -2
2.0 RMSE = 9.2e+15 molec cm -2 RMSE = 1.8e+15 molec cm -2
6
Bias = -3.1e+15 molec cm -2 Bias = 5.7e+14 molec cm-2
1.5
RMSE = 7.9e+15 molec cm -2 RMSE = 1.6e+15 molec cm -2
4
1.0
2
0.5
0.0 0
J F M A M J J A S O N D J F M A M J J A S O N D
g 10 15
h 10 15
5 Bias = -5.1e+14 molec cm -2 15 Bias = -1.1e+15 molec cm -2
Izana RMSE = 6.3e+14 molec cm -2 Reunion Island, St Denis RMSE = 2.1e+15 molec cm -2
(28.3° N, 16.5° W, 2,367 m a.s.l.) (20.9° S, 55.5° E, 80 m a.s.l.)
Column (molecules cm-2)
Column (molecules cm-2)
4 Bias = -4.5e+13 molec cm -2 Bias = 2.3e+14 molec cm-2
RMSE = 3.7e+14 molec cm -2 10 RMSE = 1.6e+15 molec cm -2
3
Bias = 7.7e+14 molec cm-2 Bias = 2.7e+15 molec cm-2
RMSE = 8.8e+14 molec cm -2 RMSE = 3.2e+15 molec cm -2
2
5
1
0 0
J F M A M J J A S O N D J F M A M J J A S O N D
i 10 16 -2
2.5 Bias = -3.5e+15 molec cm
Wollongong RMSE = 5.1e+15 molec cm -2
(34.5° S, 150.9° E, 30 m a.s.l.)
Column (molecules cm-2)
2.0 Bias = -2.4e+15 molec cm -2
RMSE = 4.2e+15 molec cm -2
1.5 FTIR ( 1 )
Bias = -4.9e+14 molec cm -2 EMAC(base)
RMSE = 3.4e+15 molec cm -2 EMAC(dioh)
1.0 EMAC(diol)
0.5
0.0
J F M A M J J A S O N D
Extended Data Fig. 1 | Seasonal cycle of formic acid from FTIR and model. were calculated between the daily mean FTIR and EMAC data, over the days
a–i, Formic acid (HCOOH) monthly average columns at nine different FTIR with FTIR measurements available. The vertical sensitivity of the FTIR
stations, displayed on a 1-year time base, from the 2010–2012 ground-based retrievals was accounted for by applying averaging kernels (except at
FTIR observations and EMAC simulations. The grey shaded areas correspond Wollongong, where no averaging kernels were produced). Details on the
to the 1σ standard deviation of the individual FTIR measurements around the ground-based FTIR retrievals are provided in Supplementary Information,
monthly average. The mean column bias and root-mean-squared error (RMSE) section 6. m a.s.l., metres above sea level.
Extended Data Fig. 2 | Global methanediol distribution simulated by EMAC.           EMAC(dioh) and EMAC(diol) simulations implement the multiphase chemistry of
a–d, Zonal mean (a, c) and surface (b, d) methanediol (HOCH2OH) mole                methanediol. On reaction with OH in the gas phase, methanediol yields formic
fraction simulated by EMAC(dioh) (a, b) and EMAC(diol) (c, d) over 2010–2012. The   acid (HCOOH).
Article

Extended Data Fig. 3 | Global formic acid abundance from satellite and                  and location of the satellite measurements. The total columns are seasonal
model. a–l, Formic acid (HCOOH) column derived from IASI satellite                      averages over December–February (a–c), March–May (d–f), June–August (g–i)
observations (a, d, g, j), and simulated by the EMAC model that implements the          and September–November ( j–l) 2010–2012. Statistics on the EMAC-to-IASI
additional production of HCOOH via the multiphase chemistry of methanediol              HCOOH column biases are presented in Extended Data Fig. 4.
(b, e, h, k, EMAC(dioh); c, f, i, l, EMAC(diol)). Model data were sampled at the time
Extended Data Fig. 4 | Formic acid column biases between model and            November (g, h) 2010–2012. The statistics correspond to the mean, median
satellite. a–h, Probability histograms of the seasonal formic acid (HCOOH)    and 1σ standard deviation of the column biases calculated between the EMAC
column bias between EMAC simulations and IASI satellite data over December–   and IASI columns for each season. The associated global HCOOH column
February (a, b), March–May (c, d), June–August (e, f) and September–          distributions are displayed in Extended Data Fig. 3.
Article

Extended Data Fig. 5 | Global formaldehyde abundance from satellite and               over 2010–2012. e, f, Probability histograms of the HCHO column bias between
model. a–d, Formaldehyde (HCHO) column derived from OMI/Aura satellite                EMAC simulations and satellite data. The statistics correspond to the mean,
observations (a), or simulated by EMAC(base) (b), EMAC(dioh) (c) or EMAC(diol) (d).   median and 1σ standard deviation of the column biases calculated over 2010–
Model data were sampled at the time and location of the satellite measurements,       2012. Details on the OMI HCHO retrievals and the comparison with model data
and the OMI averaging kernels were applied to the model profiles to account           are provided in Supplementary Information, section 7.
for the vertical sensitivity and resolution of OMI. The HCHO columns are means
Extended Data Fig. 6 | Effect of modelled formaldehyde biases on formic              sampled at the time and location of the OMI and IASI satellite measurements,
acid prediction. a–l, Monthly average formaldehyde (HCHO; a, b, e, f, i, j) and      respectively. The OMI averaging kernels were applied to the model profiles to
formic acid (HCOOH; c, d, g, h, k, l) columns from IASI and OMI satellite            account for the vertical sensitivity and resolution of OMI (IASI averaging
measurements (a, c, e, g, i, k), respectively, and from the EMAC(diol) simulation    kernels are not available). The same comparison, but for EMAC(dioh), is provided
(b, d, f, h, j, l), over Russia in August 2010 (a–d), North America in August 2012   in Supplementary Fig. 7 (Supplementary Information, section 8).
(e–h) and Amazonia in October 2010 (i–l). HCHO and HCOOH model data were
Article

Extended Data Fig. 7 | Effect of cloud processing on cloud and rainwater              decrease is due to the additional production of formic acid (HCOOH) via the
acidity. a–h, pH difference of the large-scale clouds (a, e) and associated rain      multiphase chemistry of methanediol implemented in EMAC(diol). The effect on
(b, f), and of the convective clouds (c, g) and associated rain (d, h), between the   cloud and rain pH of the EMAC(dioh) simulation is displayed in Supplementary
EMAC(diol) and EMAC(base) simulations. The pH differences are seasonal averages       Fig. 8 (Supplementary Information, section 8).
over June–August (a–d) and September–November (e–h) 2010–2012. The pH
Extended Data Fig. 8 | Effect of cloud processing on formaldehyde             central Africa in December 2010 (c, d) and southeast Asia in April 2010 (e, f).
modelling. Monthly average formaldehyde (HCHO) total column simulated by      The effect on HCHO modelling of the EMAC(dioh) simulation is presented in
EMAC(diol) (a, c, e), and relative difference in HCHO total column between    Supplementary Fig. 9 (Supplementary Information, section 8).
EMAC(diol) and EMAC(base) (b, d, f), over Amazonia in November 2012 (a, b),
Article

Extended Data Fig. 9 | Effect of cloud processing on modelled carbon             oxidation between EMAC(dioh) (b) or EMAC(diol) (d) and EMAC(base). The data
monoxide. a–d, Yield of CO originating from methane (CH4) oxidation              presented are annual averages over 2010–2012.
modelled by EMAC(dioh) (a) and EMAC(diol) (c), and change in CO yield from CH4
Extended Data Table 1 | Atmospheric chemical budget of formic acid calculated by EMAC

Modelled global terms of formic acid (HCOOH) calculated by EMAC(base), EMAC(dioh) and EMAC(diol) for the year 2010. EMAC(dioh) and EMAC(diol) account for a higher and a lower solubility of
methanediol, respectively (Supplementary Information, section 3).
*Net loss of HCOOH for the reactions list including a small contribution by rainout.
You can also read