Modelling COVID 19 severity in the Republic of Ireland using patient co morbidities, socioeconomic profile and geographic location, February to ...
←
→
Page content transcription
If your browser does not render page correctly, please read the page content below
www.nature.com/scientificreports
OPEN Modelling COVID‑19 severity
in the Republic of Ireland
using patient co‑morbidities,
socioeconomic profile
and geographic location, February
to November 2020
M. Boudou1, C. ÓhAiseadha1,2, P. Garvey1,3, J. O’Dwyer1,4,5 & P. Hynds1,5*
Understanding patient progression from symptomatic COVID-19 infection to a severe outcome
represents an important tool for improved diagnoses, surveillance, and triage. A series of models
have been developed and validated to elucidate hospitalization, admission to an intensive care
unit (ICU) and mortality in patients from the Republic of Ireland. This retrospective cohort study of
patients with laboratory-confirmed symptomatic COVID-19 infection included data extracted from
national COVID-19 surveillance forms (i.e., age, gender, underlying health conditions, occupation) and
geographically-referenced potential predictors (i.e., urban/rural classification, socio-economic profile).
Generalised linear models and recursive partitioning and regression trees were used to elucidate
COVID-19 progression. The incidence of symptomatic infection over the study-period was 0.96%
(n = 47,265), of whom 3781 (8%) required hospitalisation, 615 (1.3%) were admitted to ICU and 1326
(2.8%) died. Models demonstrated an increasingly efficacious fit for predicting hospitalization [AUC
0.816 (95% CI 0.809, 0.822)], admission to ICU [AUC 0.885 (95% CI 0.88 0.89)] and death [AUC of 0.955
(95% CI 0.951 0.959)]. Severe obesity (BMI ≥ 40) was identified as a risk factor across all prognostic
models; severely obese patients were substantially more likely to receive ICU treatment [OR 19.630]
or die [OR 10.802]. Rural living was associated with an increased risk of hospitalization (OR 1.200 (95%
CI 1.143–1.261)]. Urban living was associated with ICU admission [OR 1.533 (95% CI 1.606–1.682)].
Models provide approaches for predicting COVID-19 prognoses, allowing for evidence-based decision-
making pertaining to targeted non-pharmaceutical interventions, risk-based vaccination priorities and
improved patient triage.
Since the first reported national case on February 29th 2020, the Republic of Ireland, alongside much of the
world, has endured three waves of COVID-19 infection, and numerous phases of non-pharmaceutical interven-
tions including business, hospitality and school closures, stay at home orders, domestic travel restrictions, and
nationwide lockdowns1,2. As of early April 2021, approximately 238,000 confirmed infections and 4718 deaths,
respectively, have been reported, thus placing unprecedented pressure on critical care s ervices1. The clinical
manifestations of COVID-19 infection range from asymptomatic infection to pneumonia, which can progress
eath3,4. Globally, approximately 80%
to acute respiratory distress syndrome, multi-organ failure and, ultimately, d
of reported cases are characterised by absent or mild symptoms, while 15–20% progress to severe pneumonia
causing death in 1–5% of patients5,6.
1
Spatiotemporal Environmental Epidemiology Research (STEER) Group, Environmental Sustainability and Health
Institute, Technological University Dublin, Dublin, Ireland. 2Department of Public Health, Health Service Executive,
(HSE), Dublin, Ireland. 3Health Protection Surveillance Centre (HPSC), Dublin, Ireland. 4Environmental Research
Institute, University College Cork, Cork, Ireland. 5Irish Centre for Research in Applied Geoscience, University
College Dublin, Dublin, Ireland. *email: paul.hynds@TUDublin.ie
Scientific Reports | (2021) 11:18474 | https://doi.org/10.1038/s41598-021-98008-6 1
Vol.:(0123456789)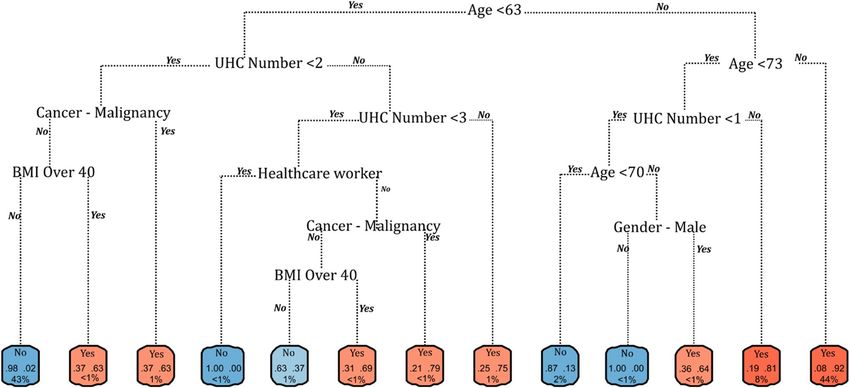
www.nature.com/scientificreports/
Monitoring the clinical outcomes of patients diagnosed with COVID-19 is vital to understand the epide-
miological and healthcare burden of SARSCoV-2, prioritise high-risk cases in the short term, and perhaps
more importantly, provide a robust evidence-base for future public health emergency planning. Several risk
factors have been statistically correlated with COVID-19 outcomes within the scientific literature, including
age7, gender8, underlying chronic c onditions9, race/ethnicity10, and occupation11. For example, a study cohort of
10,454 COVID-19 patients from Galicia (Spain) reports the presence of seven comorbidities (heart failure, hyper-
tension, rheumatoid arthritis, COPD, asthma, obesity and diabetes) were associated with hospitalisation, three
(liver disease, obesity and diabetes) with intensive care unit (ICU) admission, and six (lymphoma/leukaemia,
heart disease, dementia, COPD, diabetes and chronic kidney disease) with d eath4. Likewise, a meta-analysis of
over 3.1 million reported global cases indicates that male patients exhibit almost three times the odds of requir-
ing ICU admission (OR = 2.84; 95% CI = 2.06, 3.92) and higher odds of death (OR = 1.39; 95% CI = 1.31, 1.47)
compared to female p atients8.
While the abovementioned studies leave little doubt as to the veracity of and necessity for prognostic model-
ling of COVID-19 outcomes, it is also important to consider the marked variation between regions and their
background population health profile (i.e., comorbidity), socioeconomic profile, demographic distribution, and
the complex interactions between these potential drivers of severe COVID-19. Accordingly, the current study
sought to develop a series of prognostic models to elucidate progression from symptomatic COVID-19 to hospi-
talization, intensive care and death in the Republic of Ireland. Several case-specific and geographically referenced
predictors were employed for model training and testing, including age, gender, comorbidity profile, area-specific
socioeconomic components, urban/rural classification and case classification (i.e., sporadic or cluster-associated).
Methods
Infection data. Confirmed and anonymised case data were obtained from the Computerised Infectious
Disease Reporting (CIDR) database (http://www.hpsc.ie/CIDR/), an information system used for the collation
of notifiable (communicable) infection data in Ireland12. For the purposes of clarity and comparability, only
laboratory-confirmed, symptomatic cases have been included for analyses, that is cases associated with detection
of SARS-CoV-2 nucleic acid or antigen in a clinical specimen (laboratory criteria), and exhibiting at least one of
the following: sudden onset of cough or fever or shortness of breath or anosmia, ageusia or dysgeusia (clinical
criteria) were included for analyses. Primary and secondary case classifications were included as potential pre-
dictors, with sporadic (i.e., not recorded as associated with a confirmed outbreak or cluster) and outbreak index
cases (the first case identified as part of a recognised outbreak/cluster) were defined as primary cases, while all
other known outbreak cases were defined as secondary cases.
All symptomatic COVID-19 cases with an “epi-date” occurring between 29th February and 30th November
2020 were included for analyses. Address level data had already been geocoded to Small Areas by the Health
Service Executive (HSE)-Health Intelligence Unit. Research ethical approval for use of the COVID-19 dataset
and associated analyses were granted by the National Research Ethics Committee for COVID-19-Related Health
Research (NREC COVID-19) (Application number: 20-NREC-COV-061). All research methods including data
processing and analyses were performed in accordance with relevant guidelines and regulations. As per condi-
tions of the National Research Ethics Committee for COVID-19-Related Health Research, informed consent
from all participants and legal guardians was waived, with data processing and analyses undertaken using irre-
versibly anonymised data.
Predictors. Comorbidity, underlying health and occupation. All comorbidities included in the “Underly-
ing Clinical Conditions” section of the Health Service Executive (HSE) Health Protection Surveillance Centre
(HPSC) COVID-19 Case Form13 were extracted for analyses, as follows:
– Chronic heart disease
– Hypertension
– Chronic neurological disease
– Chronic respiratory disease
– Chronic kidney disease
– Chronic liver disease
– Asthma requiring medication
– Immunodeficiency, including HIV
– Diabetes
– Severe obesity (BMI ≥ 40)
– Cancer/Malignancy
The total case-specific comorbidity number was calculated and assigned on a case-wise basis. Data pertain-
ing to an ongoing pregnancy and ≤ 6 weeks post-partum were extracted for all cases. While > 20 occupational
classifications were used for reporting, a binary (YN) predictor was created, based on a recent Irish study11, to
delineate those cases attributed to occupations in healthcare, as this represents a subset associated with particu-
larly high exposure to infection and subsequent serial testing.
Urban/rural classification. A categorical Small Area (SA)-specific settlement type variable with three levels of
measurement was developed using data obtained from the Irish Central Statistics Office (CSO). The CSO settle-
ment type dataset14 comprises six categories classified along an urban/peri-urban/rural scale ranging from ‘city’
Scientific Reports | (2021) 11:18474 | https://doi.org/10.1038/s41598-021-98008-6 2
Vol:.(1234567890)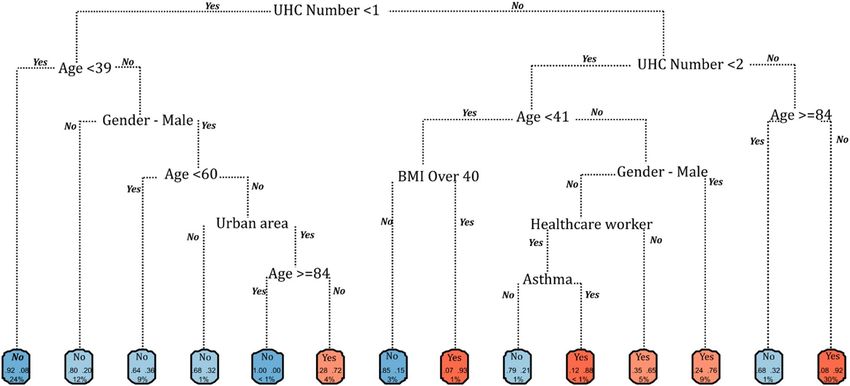
www.nature.com/scientificreports/
Component Name (Label) Component Description
Composite measure of deprivation calculated for each SA, measured on a single
Absolute HP Index Score (HPabs)
scale across all census periods
A measure of the level of deprivation in each SA relative to all other small areas
Relative HP Index Score (HPrel)
surveyed
Total population (TOTPOP) Total population in each SA during each census period
Population Change (POPCHG) Percentage increase in population over the previous 5 years
Age dependency rate (AGEDEP) Percentage of population aged < 15 or > 64 years of age
Lone parent ratio (LONEPA) Percentage of households with children < 15 years and headed by a single parent
Percentage of people in each SA with primary education as their highest level of
Primary education (EDLOW)
education attainment
Percentage of people in each SA with third level education as their highest level
Third level education (EDHIGH)
of education attainment
Percentage of households headed by professionals or managerial and technical
Higher and lower professionals (HLPROF)
employees, including farmers with ≥ 100 acres
Percentage of households in each SA headed by semi‐skilled or unskilled
Proportion of semi-skilled/ unskilled workers (LSKILL)
manual workers, including farmers with < 30 acres
Male unemployment (UNEMPM) Rate of male unemployment in each SA
Female unemployment (UNEMPF) Rate of female unemployment in each SA
Persons per room (PEROOM) Mean number of persons per household room in each small area
Local authority housing (LARENT) Percentage of local authority housing in each SA
Privately rented housing (PRRENT) Percentage of privately rented housing in each SA
Own home (OHOUSE) Percentage of privately owned housing in each SA
Table 1. Pobal HP deprivation index components and descriptions.
(1) to ‘highly rural/remote areas’ (6). The classification variable was coded such that any classification which
included a built-up area (classification 1–4) was recoded as ‘urban’, classification 5 (rural areas with high urban
influence) was recoded as commuter/peri-urban, with all other areas (classification 6) coded as ‘rural’.
Deprivation index and components. The Pobal Haase-Pratschke (HP) Deprivation Index is a composite meas-
ure of deprivation/affluence derived from national population census data and comprising 16 individual compo-
nents, representing three dimensions of deprivation: demographic profile, social class composition, and labour
market situation (Table 1)15. The absolute deprivation score reflects any changes to the national economy at SA
level between census periods while the relative deprivation index score is a comparative measure of depriva-
tion between SAs during a census p eriod15. Deprivation indices (absolute and relative) and component scores
were obtained for the most recent (2016) national census of Ireland and attributed to all laboratory-confirmed
COVID-19 cases.
Statistical analysis. To counteract the high proportion of “non-severe” outcomes within the case dataset, a
balanced dataset was created via up-sampling. Cases were randomly partitioned into model training (80%) and
validation (20%) subsets based on the dependent variable of interest (i.e., Hospital Inpatient, ICU Admission,
Mortality), to derive generalised linear models using a binomial link function (i.e., dispersion = 1, parameter
number = number of coefficients). Models were trained using all available predictors, with variables individu-
ally removed from the model based on the lowest Akaike Information Criterion (AIC) and the least significant
variable p value (i.e., stepwise approach). Each significant variable was subsequently removed from the model
to assess its effect on model accuracy based on developed confusion matrices. Only variables contributing sig-
nificantly to model accuracy were retained. Receiver operating characteristic (ROC) curves and the area under
the curve (AUC) were employed to assess the diagnostic ability of developed models; internal validation was
undertaken on calculated AUROCs using 500 bootstrapped samples for model training and validation. The
Nagelkerke R2 was used to calculate the proportion of explained variance explained by the selected predictors,
with the Brier score used to assess model performance (calibration).
The “best predictors” identified via validated GLMs were used to develop “rpart” (Recursive Partitioning and
Regression Trees) models to identify individual variable thresholds and the causative pathways from sympto-
matic infection to each of the three modelled outcomes (i.e., attribute cut-offs (“splitters”) and causative order/
importance). As for GLMs, a balanced dataset and partitioning approach (80/20) for training and testing sets
were employed. A 10 × cross-validation tree development method was used, with tune length (number of default
parameters) varying from 2 to 10 for training. Final models were selected to maximise the complexity/accuracy
of the decision trees (based on Cp (complexity parameter)). Accordingly, presented models are those with
the maximum number of predictors in concurrence with the highest level of accuracy based on true positives
(i.e., sensitivity). Final decision trees are presented to highlight successive thresholds (cut-off values (splitters)
for continuous predictors, significant category for categorical predictors, predictor order) and pathways (i.e.,
predictor order) identified for progression from symptomatic confirmed COVID-19 infection to each of the
modelled outcomes.
Scientific Reports | (2021) 11:18474 | https://doi.org/10.1038/s41598-021-98008-6 3
Vol.:(0123456789)www.nature.com/scientificreports/
Parameter Total Hospitalised ICU admission Mortality
N (%) 47,265 3781 (8) 615 (1.3) 1326 (2.8)
Mean age (years) 41.2 62.2 59.8 80.3
Female (%) 53.4 43.5 31.1 45.7
Chronic heart disease (%) 6.6 29.5 46.5 46.8
Hypertension (%) 6.0 18.2 35.8 19.7
Chronic neurological disease (%) 2.7 10.6 5.0 33.6
Chronic respiratory disease (%) 8.1 19.8 26.5 21.6
Chronic kidney disease (%) 1.5 8.7 9.8 13.7
Chronic liver disease (%) 0.5 2.3 3.4 2.2
Asthma (req medication) (%) 1.1 4.7 12.2 2.9
Immunodeficiency (%) 1.2 3.9 6.8 3.0
Diabetes (%) 3.7 16.0 27.3 17.2
Severe obesity (BMI ≥ 40) (%) 0.6 4.2 18.4 2.8
Cancer/malignancy (%) 2.1 10.8 13.0 17.9
Pregnant (%) 0.8 0.6 0.2 0
≤ 6 weeks post-partum (%) 0.0002 0.1 0.3 0
Healthcare worker (%) 19.6 9.1 9.0 0.5
Urban/commuter/rural (%) 71.8/12.6/15.5 69.9/12.1/18.0 76.6/9.8/13.7 72.9/14.6/12.5
HP deprivation (mean score) 0.24 − 1.82 − 0.28 − 1.7
POPCHG (mean %) 0.07 0.05 0.06 0.08
AGEDEP (mean %) 34.2 35.7 34.4 40.0
LONEPA (mean %) 21.4 22.9 22.0 21.1
EDLOW (mean %) 13.7 15.8 14.0 17.4
EDHIGH (mean %) 36.0 33.0 35.2 33.2
HLPROF (mean %) 34.9 33.2 34.4 34.1
LSKILL (mean %) 18.2 19.5 19.2 18.0
UNEMPM (mean %) 14.6 16.0 15.0 14.2
UNEMPF (mean %) 13.0 13.7 13.5 12.3
PEROOM (mean %) 0.57 0.56 0.56 0.62
LARENT (mean %) 9.5 10.6 11.0 9.3
PRRENT (mean %) 21.9 19.3 21.3 20.0
OHOUSE (mean %) 67.1 68.4 66.4 68.8
Table 2. Clinical characteristics of symptomatic COVID-19 cases—demographics, comorbidities, mean
deprivation scores, and outcomes, February to November 2020.
All statistical analyses were carried out in R version 4.0.3 using the Caret, pROC, deskTOOLS, fmsb, glmnet
and randomforest packages. All packages are freely available at http://cran.r-project.org.
Results
Descriptive statistics. Overall, 47,265 laboratory-confirmed cases of symptomatic COVID-19 infection
(53.4% female; mean age 41.2 years; 0.96% of national population) were included for analyses (Table 2), all of
which occurred between February 29th and November 30th 2020. Of these, 3781 (7.99%) were reported as hav-
ing been hospital inpatients, 615 (1.3%) were admitted to an intensive care unit (ICU) and 1326 (2.8%) died, of
whom 599 (45.2%) had not been classified as a hospital inpatient. The odds of progression to severe outcomes
typically increased with age, frequency/number of comorbidities, and deprivation elements, for example, across
the entire study cohort, 21% of cases (n = 37,341) presented with ≥ 1 underlying clinical condition, compared
with 60.4%, 78.9% and 84.2% among hospitalised cases, ICU admissions and deaths, respectively (Table 2). Like-
wise, mean HP deprivation scores were markedly lower among cases associated with hospitalisation (− 1.82),
ICU (− 0.28) and death (− 1.7) than the mean score across all symptomatic cases (0.24). Patients that died in hos-
pital were typically younger (mean 77.3 years vs 84 years), associated with a higher comorbidity score (mean 1.96
vs 1.51) and markedly lower deprivation score (mean − 2.41 vs − 0.84), than those that died outside of hospital.
Hospitalisation. All validated generalised linear models for severe COVID-19 outcomes are presented in
Table 3. Almost 8% (n = 3781) of symptomatic COVID-19 infections during the study period resulted in hos-
pitalisation; the validated GLM comprised 11 predictors, including age, gender, five individual comorbidities,
calculated comorbidity number, primary case classification, and two geographically-specific variables (rurality,
percentage of local authority housing) (Fig. 1; Table 3). The validated (tested) model (classification threshold 0.5)
returned a bootstrapped (i.e., corrected) AUC of 0.816 (95% CI 0.809, 0.822), model predictive sensitivity (i.e.,
Scientific Reports | (2021) 11:18474 | https://doi.org/10.1038/s41598-021-98008-6 4
Vol:.(1234567890)www.nature.com/scientificreports/
Hospitalization ICU Deaths
Coefficient (SE) aOR (95% CI) Coefficient (SE) aOR (95% CI) Coefficient (SE) aOR (95% CI)
1.043 (1.042– 1.037 (1.036– 1.126 (1.124–
Age 0.042 (0.0005) 0.036 (0.001) 0.119 (0.001)
1.044) 1.038) 1.129)
4.504 (3.906– 7.467 (6.592– 1.676 (1.362–
Asthma 1.505 (0.073) 2.011 (0.064) 0.516 (0.107)
5.210) 8.841) 2.071)
Severe obesity 4.663 (3.808– 19.630 (16.566– 10.802 (8.672–
1.540 (0.105) 2.977 (0.088) 2.380 (0.113)
(BMI ≥ 40) 5.760) 23.43) 13.514)
Cancer/malig- 1.922 (1.727– 3.044 (2.710–
0.654 (0.055) – – 1.113 (0.060)
nancy 2.144) 3.424)
Chronic neuro- 0.223 (0.200–
– − 1.501 (0.055) – –
logical disease 0.249)
1.231 (1.125– 1.191 (1.192–
Diabetes 0.208 (0.046) 0.256 (0.041) – –
1.347) 1.399)
1.487 2.759 (2.647 ( 1.425 (1.345–
Gender–Male 0.397 (0.019) 1.015 (0.021) 0.354 (0.030)
(1.434 − 1.542) 2.877) 1.510)
0.786 (0.742– 0.149 (0.124–
Healthcare worker – – − 0.241 (0.029) − 1.901 (0.093)
0.832) 0.510)
2.178 (1.903– 4.919 (4.372– 2.171 (1.803–
Immunodeficiency 0.778 (0.069) 1.593 (0.061) 0.775 (0.095)
2.497) 5.546) 2.621)
Local Authority 1.006 (1.005–
0.006 (0.001) – – – –
housing (%) 1.007)
1.429 (1.376–
Primary case 0.357 (0.019) – – – –
1.485)
1.200 (1.143–
Rural Resident 0.183 (0.025) – – – –
1.261)
1.761 (1.712– 2.469 (2.401– 2.162 (2.098–
UHC1 Number 0.566 (0.015) 0.904 (0.014) 0.771 (0.015)
1.813) 2.540) 2.228)
1.533 (1.606–
Urban resident – – 0.474 (0.024) – -
1.682)
Table 3. Generalised linear models predicting hospitalization, intensive care unit admission and mortality
among symptomatic COVID-19 patients in the Republic of Ireland, February 29th to November 30th 2020
(N = 47,265). 1 Underlying health condition.
Figure 1. Forest plot of adjusted odds ratios for hospitalization from validated generalised linear models.
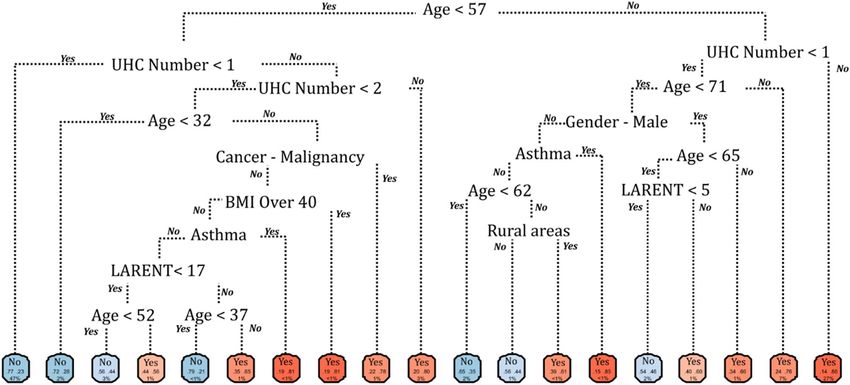
2 of 0.411, and a Brier score of 0.166. The validated “rtree” model for hospi-
true positive) of 79.5%, Nagelkerke R
talisation among symptomatic COVID-19 cases is presented in Fig. 2; the model returned a predictive accuracy
of 75.1% on the outcome (hospitalised) class.
Admission to ICU. Approximately 1.3% (n = 615) of symptomatic COVID-19 infections from February 29th
to November 30th resulted in admission to an ICU; the training GLM comprised 10 predictors, two of which
were “protective” (healthcare worker, presence of a chronic neurological condition), including age, gender, five
individual comorbidities, calculated comorbidity number, occupational classification, and one geographically-
specific variable (urban resident) (Fig. 3; Table 3). The validated model returned a bootstrapped AUC of 0.885
Scientific Reports | (2021) 11:18474 | https://doi.org/10.1038/s41598-021-98008-6 5
Vol.:(0123456789)www.nature.com/scientificreports/
Figure 2. Recursive partitioning and regression tree (rtree) model for hospitalisation among symptomatic
COVID-19 cases in the Republic of Ireland, February to November 2020.
Figure 3. Forest plot of adjusted odds ratios for ICU admission from validated generalised linear models.
2 of 0.575, and a Brier
(95% CI 0.88 0.89), model predictive sensitivity (i.e., true positive) of 85.2%, a Nagelkerke R
score of 0.128. The validated “rtree” model for hospitalisation among symptomatic COVID-19 cases is presented
in Fig. 3; the model achieved a predictive accuracy of 83.1% on the outcome (ICU admission) class (Fig. 4).
Mortality. Just under 3% (n = 1326) of symptomatic COVID-19 infections occurring between February 29th
and November 30th resulted in death; the validated GLM comprised 8 predictors, one of which was “protec-
tive” (healthcare worker), including age, gender, four individual comorbidities, calculated comorbidity number,
occupational classification, and one geographically-specific variable (urban resident) (Fig. 5; Table 3). The vali-
dated model returned a bootstrapped AUC of 0.955 (95% CI 0.951 0.959), model predictive sensitivity (i.e., true
positive) of 90.4%, a Nagelkerke R2 of 0.816, and a Brier score of 0.06. The validated “rtree” model for mortality
among symptomatic COVID-19 cases is presented in Fig. 6; the model achieved a predictive accuracy of 96.7%
on the outcome (mortality) class.
Discussion
The complete Irish dataset of notified cases of COVID-19 throughout the first two waves of the pandemic was
analysed to identify case- and geographically-specific attributes that may serve as predictors for hospitaliza-
tion, ICU admission and mortality in patients with laboratory-confirmed, symptomatic COVID-19 infection.
Results mirror findings from previous studies, with older age, male gender and increased comorbidity number
Scientific Reports | (2021) 11:18474 | https://doi.org/10.1038/s41598-021-98008-6 6
Vol:.(1234567890)www.nature.com/scientificreports/
Figure 4. Recursive partitioning and regression tree (rtree) model for ICU admission among symptomatic
COVID-19 cases in the Republic of Ireland, February to November 2020.
Figure 5. Forest plot of adjusted odds ratios for mortality from validated generalised linear models.
consistently significant factors within all validated models for COVID-19 severity. Studies have shown that
increasing type-2 cytokine production with age likely reduce control of viral replication, leading to prolonged
incubation and inflammatory response, thus facilitating the progression of infection16,17. Likewise, while symp-
tomatic COVID-19 prevalence was higher among females (53.4%), the burden of severe infection was mark-
edly higher among male cases for all three modelled outcomes; men were approximately 1.5 (OR 1.487, 95% CI
1.434‒1.542)), 2.8 (OR 2.759, 95% CI 2.647‒2.877) and 1.4 (OR 1.425, 95% CI 1.345‒1.510) times more likely to
be hospitalised, admitted to ICU, or die, than women within the study sample (OR 2.759, 95% CI 2.647‒2.877).
A recent review of the sex- and gender-related differences associated with COVID-19 outcomes in Europe pro-
poses numerous potential reasons for this relationship, including gender-specific lifestyle, health behaviours,
psychological stress, and socioeconomic conditions, in addition to several sex-specific biological mechanisms
modulating the course of disease, including hormone-regulated gene expression, innate and adaptive immune
responses, and immune-aging18. For example, numerous studies have shown that females are generally less
susceptible to viral infections and mount higher innate immune responses (more rapid viral recognition and
type I interferon production) than their male counterparts, leading to faster viral clearance19,20. Accordingly,
there is a strong evidence base to suggest that upon infection with SARS-CoV-2, females may be better equipped
to initially respond, and attenuate viral invasion and pathogenicity compared to males. Additionally, a recent
study in the UK has noted significantly higher rates of “behavioural resistance” to protection actions (i.e., non-
pharmaceutical interventions) among men, noting that 80% of those fined for breaking lockdown measures
Scientific Reports | (2021) 11:18474 | https://doi.org/10.1038/s41598-021-98008-6 7
Vol.:(0123456789)www.nature.com/scientificreports/
Figure 6. Recursive partitioning and regression tree (rtree) model for mortality among symptomatic COVID-
19 cases in the Republic of Ireland, February to November 2020.
were male21, potentially resulting in higher levels of viral exposure, transmission and loading among males, in
concurrence with the aforementioned biological disparities. Accordingly, gendered or sex-specific therapies and/
or non-pharmaceutical interventions may be an important area for future research.
COVID-19-related hospitalisation presented as the most analytically complex severe outcome, with numerous
comorbidities and socioeconomic factors associated with admission as a hospital inpatient. While the models
for predicting hospitalisation demonstrated a good fit (AUROC 0.816, 95% CI 0.809‒0.822), the authors suggest
that the lower predictive capacity of the presented hospitalisation model is reflective of the complexity of disease
manifestation, particularly within the community, which is mediated by several socio-behavioural, clinical and
biological factors. This may be particularly pronounced with respect to non-clinical and non-biological factors
such as individual behaviours, self-efficacy and knowledge, which may lead to increased exposures and are
particularly difficult to accurately quantify via routine epidemiological surveillance.
Asthma was associated with an increased likelihood of hospitalization. Recent research has been divided
regarding the influence of asthma on COVID-19 hospitalisation, with some authors suggesting that those with
asthma are over-represented among adult hospital admissions as SARS-CoV-2 may initiate an exacerbation in
asthma symptoms, which has been reported among other respiratory v iruses20,21. Likewise, the most common
presenting symptoms of COVID-19 — dry cough and shortness of breath — are also common in acute exacerba-
tion of asthma20. Conversely, several international studies have reported that asthma is not a significant risk factor
for hospitalisation with COVID-1922,23, with some suggesting that it may be a protective factor, via increased
numbers of eosinophils in the airways of asthmatic patients, or through potential antiviral and immunomodu-
latory activities of inhaled asthma medications, and particularly s teroids24. Results from the current study may
reflect the high prevalence of asthma in the ROI, which has the fourth highest global prevalence of the disease
and was consistently among the top 20 diagnoses for admission to hospital prior to the pandemic25.
From a socio-geographic/economic perspective, patients living in categorically rural areas and in regions
characterised by higher (> 17%, Fig. 2) rates of local authority (i.e., publicly-supported) housing were also at
increased risk of hospitalisation, potentially reflecting a geographical and/or geo-social gradient associated with
disease severity in Ireland. A recent investigation of the socioeconomic association of COVID-19 hospitalisation
among 418,794 participants of the UK Biobank reports a striking gradient in COVID − 19 hospitalization rates
according to the Townsend Deprivation Index − a composite measure of socioeconomic deprivation − and house-
hold income26. Likewise, individual socioeconomic status has been associated with the severity of COVID-19
among hospitalised patients under the age of 70 years in Greater Paris, with housing conditions as they relate to
the capacity to socially distance and increased co-resident infections, specifically mentioned as probable drivers27.
Within the current study sample, local-authority housing (%) and the prevalence of both primary ( Rsp = 0.375,
p < 0.001) and college/university education (Rsp = − 0.449, p < 0.001) were significantly correlated, with lower
levels of education a globally recognised source of health i nequalities28.
Predictive capacity increased for both ICU admissions and mortality, with models for ICU admission
(AUROC 0.885, 95% CI 0.88–0.89) and mortality (AUC 0.955, 95% CI 0.95–0.96) assessed as being very good
and excellent, respectively. Commonalities were observed across risk factors identified for both outcomes. Specifi-
cally, severe obesity, indicated by a body mass index (BMI) ≥ 40, was a significant marker for both ICU admission
(OR 19.6) and death (OR 10.8). The identified risks associated with severe obesity align with pathophysiological
mechanisms contributing to respiratory distress; in particular, a BMI ≥ 40 (associated with increased respira-
tory rate) is recognized as a contributor to multiple respiratory infections including p neumonia29 and has been
Scientific Reports | (2021) 11:18474 | https://doi.org/10.1038/s41598-021-98008-6 8
Vol:.(1234567890)www.nature.com/scientificreports/
identified as a primary risk factor for poor COVID-19 p rognoses30,31. Severe obesity was a particularly significant
predictor among COVID-19 patients aged < 41 years (Fig. 4) and < 63 years (Fig. 6) for ICU admission and death,
respectively (i.e., significantly below median ages for both outcomes). Similarly, the presence of malignant can-
cer and immunodeficiency resulting from cancer treatment impair the ability to mount an effective response to
clear viral infection and are associated with increased susceptibility to acute clinical deterioration and increased
mortality due to increased viral p athogenicity32,33, with < 63 years again identified as a significant “splitter” for
COVID-related mortality (Fig. 6) demonstrating a lack of interaction between this health condition and older age.
While residence in categorically rural areas was associated with a higher likelihood of hospitalisation, the
opposite was true for admission to ICU, whereby urban dwellers were approximately 1.5 times more likely to
require critical care (OR 1.533, 95% CI 1.606‒1.682), and particularly among those aged > 60 years (Fig. 4). Urban
living may be indicative of multiple individual or interacting factors including higher levels of d eprivation34,
higher viral exposures (i.e., close contacts) due to increased household and/or local population density26 or
compounded respiratory illnesses due to lower air quality in urban areas35. For example, within the current
study sample, while a slightly higher proportion of symptomatic cases with asthma were reported in rural areas
(~ 1.5% versus ~ 1% of all symptomatic cases), the likelihood of ICU admission among urban asthma sufferers
was significantly higher (OR 15.55; CI 11.28–21.14) than their counterparts in rural (OR 13.22; CI 6.49‒25.10)
or commuter areas (OR 11.01; CI 3.73‒26.99), potentially highlighting a significant interaction between urban
pollutant exposures (e.g., particulate matter (PM) 2.5/10) and COVID-19 s everity36.
The apparent “protective” effect of occupational status as a healthcare worker and both ICU admission and
death may indicate clinical heterogeneity between these and other cases, arising from diagnostic bias, as health-
care workers are likely to be associated with a high index of suspicion for the disease, and as such, have and con-
tinue to undergo serial testing in Ireland. The threshold of clinical criteria for COVID-19 diagnosis in healthcare
workers, and the temporal lag between viral exposure, positive diagnosis and subsequent treatment, is likely
significantly lower than among the general population, due to these testing protocols37, resulting in improved
outcomes and the apparent “protective” effect i dentified38. Likewise, the protective effect of chronic neurological
disease with respect to ICU admission is thought to reflect clinical processes, specifically the clinical judgement
that, regarding persons with advanced dementia, mechanical ventilation may prolong patient suffering without a
clear survival b enefit39. Other comorbidities have been associated with poor prognosis from ICU admission, and
thus reduce odds of admission through clinical decision-making. Physical factors indicating a limited functional
capacity are predictive of high mortality in ICU, suggesting that frailty has a significant impact on intensive care
outcome; hence, the finding that age was associated with the lowest odds of ICU admission (compared with
hospitalisation and mortality) may be u nsurprising8. Similarly, the finding that 599 (45.2%) of those who died
had not been hospitalised is unsurprising in the context of the mean age of this subgroup (84 years), as patients
of such advanced age may have been considered too frail to benefit from hospital (and particularly critical) care.
While the presented study permits delineation of severe health outcomes based on clinical and socioeconomic
attributes, there are some limitations the authors feel should be highlighted. Based on presented findings, it is
likely that some case attributes may be indicative of differential healthcare access and thus not entirely elucidated
by the pathophysiological mechanisms driving progression of the disease to increasing clinical severity and death.
For example, rurality as a predictor of hospitalization, in conjunction with urban residence as a predictor for ICU
admission, may reflect a lower threshold for rural residents to present to healthcare locations, and subsequently to
be admitted for observation, to counter the risk of deterioration in the more remote home environment. Likewise,
the choice of hospitalisation as a marker for COVID-19 severity also comprises some spatio-temporal limitations;
hospitalisation itself may be affected by many factors including health-seeking behaviours, availability of care and
healthcare policies or thresholds (e.g., more or less severe cases may be admitted to hospital and/or admission
may be age-specific), which may be spatially unique and/or temporally fluid based on the capacity of a national
or regional healthcare system to absorb cases (e.g., localised outbreaks). As such, the authors advise caution be
exercised when comparing the current study findings with previous or future studies of a similar nature.
Conclusion
The identified nationally-specific risks associated with demographic, underlying health (comorbidities), geo-
graphic location and socioeconomic profile, and the specific importance, attribute “splitters” and variable interac-
tions represent a robust evidence base for development of increasingly targeted public-health recommendations,
interventions and therapeutic approaches for high-risk groups, e.g., minimization of social contact among those
with elevated BMI, urban asthma or immunodeficiency caused by cancer treatments, and thorough respiratory
etiquette and hand hygiene among household contacts in specific settings and/or geographic regions. Moreover,
communication of the scientific basis for ongoing and future interventions, and particularly geographically- or
socioeconomically bespoke interventions may be used to combat pandemic fatigue and increase overall transpar-
ency and awareness of ongoing public-health events. Furthermore, the presented models offer a metric by which
tailored vaccination schedules may be devised with prioritization by age, sex, co-morbidity status and region.
Lastly, results presented offer valuable information for effective patient triage; identifying those at increased risk
of disease progression and death based on a suite of factors and not solely on clinical presentations of the disease.
Received: 20 April 2021; Accepted: 1 September 2021
References
1. Department of Health (2021) Latest updates on COVID-19. Government of Ireland. Available at: https://www.gov.ie/en/news/
7e0924-latest-updates-on-covid-19-coronavirus/ [Accessed 28th March 2021]
Scientific Reports | (2021) 11:18474 | https://doi.org/10.1038/s41598-021-98008-6 9
Vol.:(0123456789)www.nature.com/scientificreports/
2. Kennelly, B. et al. The COVID-19 pandemic in Ireland: An overview of the health service and economic policy response. Health
Policy Technol. 9(4), 419–429 (2020).
3. Huang, C. et al. Clinical features of patients infected with 2019 novel coronavirus in Wuhan, China. Lancet 395, 497–506 (2020).
4. Gude-Sampedro, F. et al. Development and validation of a prognostic model based on comorbidities to predict COVID-19 severity:
a population-based study. Int. J. Epidemiol. 50(1), 64–74 (2021).
5. Burn, E., Tebe, C., Fernandez-Bertolin, S., Aragon, M., Recalde, M., Roel, E., Prieto-Alhambra, D & Duarte-Salles, T. (2020). The
natural history of symptomatic COVID-19 in Catalonia, Spain: a multi-state model including 109,367 outpatient diagnoses, 18,019
hospitalisations, and 5,585 COVID-19 deaths among 5,627,520 people. MedRxiv.
6. Grasselli, G. et al. Baseline characteristics and outcomes of 1591 patients infected with SARS-CoV-2 admitted to ICUs of the
Lombardy Region, Italy. JAMA 323, 1574–1581 (2020).
7. Liu, Y., Mao, B., Liang, S., Yang, J. W., Lu, H. W., Chai, Y. H., ... & Xu, J. F. (2020). Association between age and clinical characteristics
and outcomes of COVID-19. Eur. Respiratory J. 55(5).
8. Peckham, H. et al. Male sex identified by global COVID-19 meta-analysis as a risk factor for death and ITU admission. Nat. Com-
mun. 11(1), 1–10 (2020).
9. Wu, X., Nethery, R. C., Sabath, B. M., Braun, D., & Dominici, F. (2020). Exposure to air pollution and COVID-19 mortality in the
United States. MedRxiv.
10. Pan, D., Sze, S., Minhas, J. S., Bangash, M. N., Pareek, N., Divall, P. & Pareek, M. The impact of ethnicity on clinical outcomes in
COVID-19: a systematic review. EClinicalMedicine 23, 100404 (2020).
11. Walsh, B., Redmond, P., & Roantree, B. Differences in risk of severe outcomes from COVID-19 across occupations in Ireland. ESRI
Survey and Statistical Report Series (93) (2020)
12. Domegan, L., Garvey, P., McKeown, P., Johnson, H., Hynds, P., O’Dwyer, J. & ÓhAiseadha, C. Geocoding cryptosporidiosis cases in
Ireland (2008–2017)—development of a reliable, reproducible, multiphase geocoding methodology. Irish J. Med. Sci. 1–11 (2021).
13. Health Service Executive (HSE) Health Protection Surveillance Centre (HPSC) COVID-19 Case Form. Version 6.0, September
2020
14. Central Statistics Office. Urban and Rural life in Ireland (2019). Available at: https://www.cso.ie/en/releasesandpublications/ep/p-
urli/urbanandrurallifeinireland2019/introduction/ [Assessed on March 23rd 2021]
15. Haase, T. & Pratchhke, J. The 2011 Pobal HP Deprivation Index for Small Areas (SA): Introduction and Reference Tables (Pobal,
Dublin, 2012).
16. Opal, S. M., Girard, T. D. & Ely, E. W. The immunopathogenesis of sepsis in elderly patients. Clin. Infect. Dis. 41, S504–S512 (2005).
17. Ji, D. et al. Prediction for progression risk in patients with COVID-19 pneumonia: the CALL score. Clin. Infect. Dis. 71(6),
1393–1399 (2020).
18. Gebhard, C., Regitz-Zagrosek, V., Neuhauser, H. K., Morgan, R. & Klein, S. L. Impact of sex and gender on COVID-19 outcomes
in Europe. Biol. Sex Differ. 11, 1–13 (2020).
19. Klein, S. L. Sex influences immune responses to viruses, and efficacy of prophylaxis and treatments for viral diseases. BioEssays
34(12), 1050–1059 (2012).
20. Melgert, B. N. et al. Macrophages: regulators of sex differences in asthma?. Am J Respir Cell Mol Biol 42(5), 595–603 (2010).
21. Capraro, V. Barcelo, H. The effect of messaging and gender on intentions to wear a face covering to slow down COVID-19 trans-
mission (2020). arXiv:2005.05467.
22. Abrams, E. M. & Szefler, S. J. Managing asthma during coronavirus disease-2019: an example for other chronic conditions in
children and adolescents. J. Pediatr. 222, 221–226 (2020).
23. Choi, Y. J., Park, J. Y., Lee, H. S., Suh, J., Song, J. Y., Byun, M. K., Park, J. W. & Park, H. J. Effect of asthma and asthma medication
on the prognosis of patients with COVID-19. Eur. Respir. J. 57(3) (2021).
24. Chhiba, K. D. et al. Prevalence and characterization of asthma in hospitalized and nonhospitalized patients with COVID-19. J.
Allergy Clin. Immunol. 146(2), 307–314 (2020).
25. Broadhurst, R. et al. Asthma in COVID-19 Hospitalizations: An Overestimated Risk Factor?. Ann. Am. Thoracic Soc. 17(12),
1645–1648 (2020).
26. Carli, G., Cecchi, L., Stebbing, J., Parronchi, P. Farsi, A. Is asthma protective against COVID‐19? Allergy (2020).
27. Carthy, P. et al. Local NO2 concentrations and asthma among over-50s in Ireland: a microdata analysis. Int. J. Epidemiol. 49(6),
1899–1908 (2020).
28. Patel, A. P., Paranjpe, M. D., Kathiresan, N. P., Rivas, M. A. & Khera, A. V. Race, socioeconomic deprivation, and hospitalization
for COVID-19 in English participants of a national biobank. Int. J. Equity Health 19(1), 1–4 (2020).
29. Sesé, L., Nguyen, Y., Leprieur, E. G., Annesi-Maesano, I., Cavalin, C., de Bouillé, J. G. & Nunes, H. Impact of socioeconomic status
in patients hospitalised for COVID-19 in the Greater Paris area. Eur. Respir. J. 56(6) (2020).
30. von dem Knesebeck, O., Verde, P. E. & Dragano, N. Education and health in 22 European countries. Soc Sci Med 63, 1344–1351
(2006).
31. Phung, D. T., Wang, Z., Rutherford, S., Huang, C. & Chu, C. Body mass index and risk of pneumonia: a systematic review and
meta-analysis. Obes. Rev. 14(10), 839–857 (2013).
32. Kwok, S. et al. Obesity: a critical risk factor in the COVID-19 pandemic. Clin. Obes. 10(6), e12403 (2020).
33. Klang, E. et al. Severe obesity as an independent risk factor for COVID-19 mortality in hospitalized patients younger than 50.
Obesity 28(9), 1595–1599 (2020).
34. Mehta, V. et al. Case fatality rate of cancer patients with COVID-19 in a New York hospital system. Cancer Discov. 10(7), 935–941
(2020).
35. Indini, A., Rijavec, E., Ghidini, M., Bareggi, C., Cattaneo, M., Galassi, B., Gambini, D. & Grossi, F. "Coronavirus infection and
immune system: an insight of COVID-19 in cancer patients. Crit. Rev. Oncol./Hematol. 103059 (2020).
36. Nolan, B. & Whelan, C. T. Urban housing and the role of “underclass” processes: the case of Ireland. J. Eur. Soc. Policy 10(1), 5–21
(2000).
37. Conticini, E., Frediani, B. & Caro, D. Can atmospheric pollution be considered a co-factor in extremely high level of SARS-CoV-2
lethality in Northern Italy?. Environ. Pollut. 261, 114 (2020).
38. Coker, E. S. et al. The effects of air pollution on COVID-19 related mortality in northern Italy. Environ. Resource Econ. 76(4),
611–634 (2020).
39. National Public Health Emergency Team (NPHET) Minutes, May 28th 2020: https://www.gov.ie/en/collection/0f6a2-minutes-
from-meetings-of-the-covid-19-expert-advisory-group/ [Accessed April 9th 2021]
Author contributions
M.B. and P.H. undertook all analyses and wrote the main manuscript text (Draft 1). P.H. and J.O.D. acquired
project funding. C.O.H. undertook data curation and geo-validation. All authors (M.B., P.H., J.O.D., C.O.H.,
P.G.) assisted in finalising the submitted manuscript (writing, editing, tables and figures).
Scientific Reports | (2021) 11:18474 | https://doi.org/10.1038/s41598-021-98008-6 10
Vol:.(1234567890)www.nature.com/scientificreports/
Funding
Science Foundation Ireland (Grant No. COVID-19 Rapid Response).
Competing interests
The authors declare no competing interests.
Additional information
Correspondence and requests for materials should be addressed to P.H.
Reprints and permissions information is available at www.nature.com/reprints.
Publisher’s note Springer Nature remains neutral with regard to jurisdictional claims in published maps and
institutional affiliations.
Open Access This article is licensed under a Creative Commons Attribution 4.0 International
License, which permits use, sharing, adaptation, distribution and reproduction in any medium or
format, as long as you give appropriate credit to the original author(s) and the source, provide a link to the
Creative Commons licence, and indicate if changes were made. The images or other third party material in this
article are included in the article’s Creative Commons licence, unless indicated otherwise in a credit line to the
material. If material is not included in the article’s Creative Commons licence and your intended use is not
permitted by statutory regulation or exceeds the permitted use, you will need to obtain permission directly from
the copyright holder. To view a copy of this licence, visit http://creativecommons.org/licenses/by/4.0/.
© The Author(s) 2021
Scientific Reports | (2021) 11:18474 | https://doi.org/10.1038/s41598-021-98008-6 11
Vol.:(0123456789)You can also read