An integrated approach to understanding RF vacuum arcs - Nature
←
→
Page content transcription
If your browser does not render page correctly, please read the page content below
www.nature.com/scientificreports
OPEN An integrated approach
to understanding RF vacuum arcs
J. Norem1*, Z. Insepov2,3,4 & A. Hassanein4
Although used in the design and costing of large projects such as linear colliders and fusion tokamaks,
the theory of vacuum arcs and gradient limits is not well understood. Almost 120 years after the
isolation of vacuum arcs, the exact mechanisms of the arcs and the damage they produce are still
being debated. We describe our simple and general model of the vacuum arc that can incorporate
all active mechanisms and aims to explain all relevant data. Our four stage model, is based on
experiments done at 805 MHz with a variety of cavity geometries, magnetic fields, and experimental
techniques as well as data from Atom Probe Tomography and failure analysis of microelectronics.
The model considers the trigger, plasma formation, plasma evolution and surface damage phases of
the RF arc. This paper also examines how known mechanisms can explain the observed sharp field
dependence, fast breakdown times and observed surface damage. We update the model and discuss
new features while also pointing out where new data would be useful in extending the model to a
wider range of frequencies.
Arcing on surfaces occurs in many environments under many different initial conditions, such as DC, RF, vacuum
or gas, pre-existing plasma, wide or narrow gap, clean or dirty c onductors1–7, for normal and superconducting
systems8, with and without strong B fields9,10, and ignited by high electric fields, lasers11 or particle c ollisions12.
Although vacuum arcs have been studied for over 120 y ears13,14, the first credible model of single surface elec-
trical breakdown was Lord Kelvin’s argument in 1904 that local fields on the order of 10 GV/m would produce
mechanical failure15. This prediction assumed that local surface fields could be many times higher than the aver-
age surface field, now called the field enhancement factor, β , described by Alpert, who accurately estimated the
local field at breakdown for a range of data7. In the “Feynman Lectures” a simple derivation shows that, while
high β values can be created by “fencepost” geometries, surface fields may be primarily determined by the local
curvature of the surface rather than the larger features of a sperities16.
In 2001, Jüttner summarized the theoretical understanding of vacuum arcs in a review, where he argued that
the understanding of arcing had not converged on a single theory applicable to a wide variety of applications, and
much of the active effort in the field produced contradictory conclusions and d isagreement17. Our argument18,
is that a simple model can be the basis for a useful understanding of the process.
The most commonly used breakdown model is the Explosive Electron Emission (EEE) system based on
studies of field emission heating of a sperities1,3,19, nevertheless, this model does not always agree with data from
RF breakdown events. While the EEE model assumes that the surface is heated by field emission currents with
thresholds weakly dependent on applied fi eld3, RF experiments, however, show breakdown with much shorter
breakdown delay times and very sharp field thresholds, in spite of the RF duty cycle which reduces the deposited
heat by a factor of 139. The EEE model also assumes the existence of wire shaped asperities where heated material
has little thermal contact with the bulk material and these asperities are not seen10. Meanwhile, other mechanisms
that could trigger breakdown events are seen in a variety of environments. For example, the EEE model applies
only to cathodic arcs, however similar surface fields at positive potentials (with no field emission or heating) also
mechanically fracture surfaces at roughly the same local fi elds20–22 in Atom Probe systems.
Our primary interest has been the study of mechanisms limiting the accelerating gradients of modern accel-
erators, since the overall cost of linear accelerator facilities is related to the gradient that can be maintained in
these structures, primarily because lower gradients mean longer structures are required to produce the required
performance. In the design of tokamak power reactors, arcing can introduce impurities into the plasma to
compromise the operation of the systems, as well as limiting the power that is available to heat the plasma to the
temperature required for fusion23. The design of high voltage transmission lines is limited by the constraint that
high surface fields can produce corona discharges that limit the operational voltage and ultimately are directly
responsible for the loss of approximately 4% of the transmitted power, with the associated costs and pollution24–26.
Although less obvious, we find that the physics limiting integrated circuit design may also be related to surface
1
Nano Synergy Inc., Downers Grove, IL, USA. 2Nazarbayev University, Nur‑Sultan, Kazakhstan. 3National Research
Nuclear University, Moscow, Russia. 4Purdue University, West Lafayette, IN, USA. *email: norem.jim@gmail.com
Scientific Reports | (2021) 11:2361 | https://doi.org/10.1038/s41598-021-81947-5 1
Vol.:(0123456789)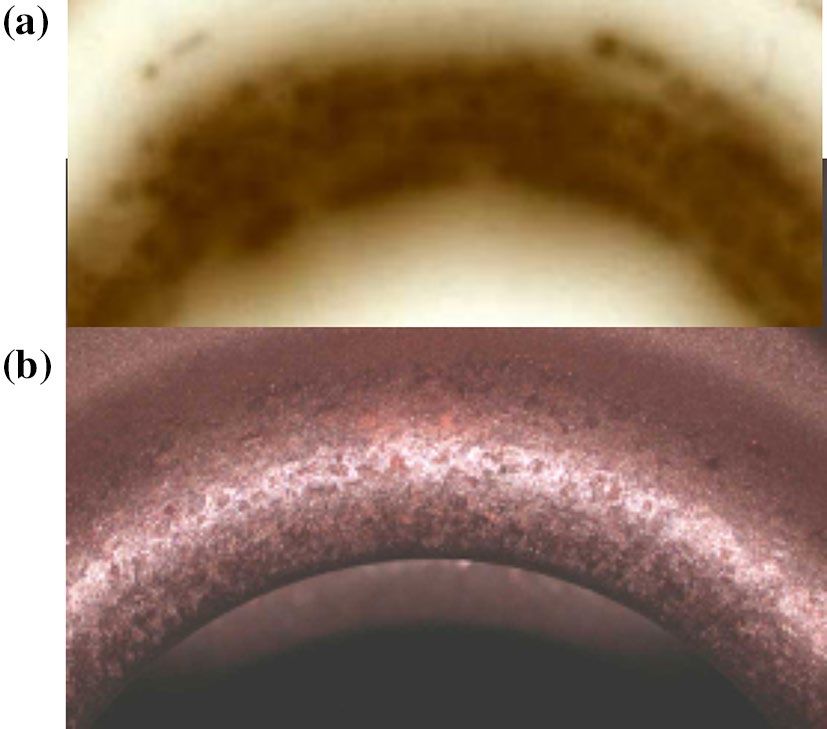
www.nature.com/scientificreports/
Figure 1. Vacuum arc development involves 4 stages. We consider processes that seem dominant at different
stages of the development of the arc, and find that under continued operation the arc follows a life-cycle, where
damage from one breakdown event is very likely to produce another. We also find that cracks due to differential
cooling and unipolar arc physics explain much of the experimental data we see.
arcing since high current densities seem to be the trigger both in electronic component f ailure27,28 and vacuum
arcs.
Surface arcs are difficult to study, and many efforts seemed to be interested in optimizing performance of sys-
tems rather than basic plasma physics. Arcing can operate extremely rapidly (ns scale), the dimensions involved
may be very small (a few microns or less), the dynamic range of many parameters may extend over many orders
of magnitude, and the scale of surface damage from arcs and surface asperities leading to arcing may be on the
order of a few nm. A further problem is the environment of experimental measurements, which must involve
factors such as gas, vacuum, high fields, and unpredictable arc positions. Further complicating understanding
this physics is the problem that the results of arcing experiments seem to be nonlinear due to thresholds in arc
duration, available energy and other variables, so that measurable parameters seen in one experiment may not
be detectable in experiments done with somewhat different parameters.
The conventional wisdom seems to be that “theoretical understanding of breakdown remains incomplete at
this time, particularly with regards to the micro- structural mechanisms of the field-induced ejection of matter from
the structure surface that initiates the evolution of breakdown plasma, and with regards to how the mechanisms
are affected by structure material conditions29”. This paper argues that a realistic model of breakdown with sharp
thresholds, and short breakdown delay times, without large asperities, can be simple, accessible and useful.
Breakdown without heating
Since “fencepost” (unicorn horn) shaped asperities are not seen experimentally, we argue that a more general
model of breakdown is needed using mechanisms where Ohmic heating is not required, as shown in Fig. 1.
We assume that breakdown occurs when Maxwell stresses are greater than the tensile strength of the material,
which occurs at surface cracks or small local radii18. These processes occur in a wide variety of well studied
environments22.
In this model the lifecycle of the arc as divided into four parts: trigger, plasma ionization, plasma evolution,
and surface damage. The process occurs in four stages: (1) local surface fields, measured from field emission,
are high enough so that Maxwell stresses can be comparable to tensile strength causing surface f ailure9,15,22, (2)
field emission ionizes the fragments of surface material, producing a positively charged ion cloud near a field
emitter that will increase the field on the emitter30–32, (3) an unstable. non-Debye plasma is maintained by field
emission and self-sputtering33–37, and, (4) surface damage is caused by Maxwell stresses, thermal gradients, and
surface tension on the liquid metal s urface18,38,39,41.
Our model is primarily based on data taken at 805 MHz with and without 3 T co-linear B fields, done as part
of the Fermilab contribution to the Muon Accelerator Project, during 2001–20129,18. All numerical results in
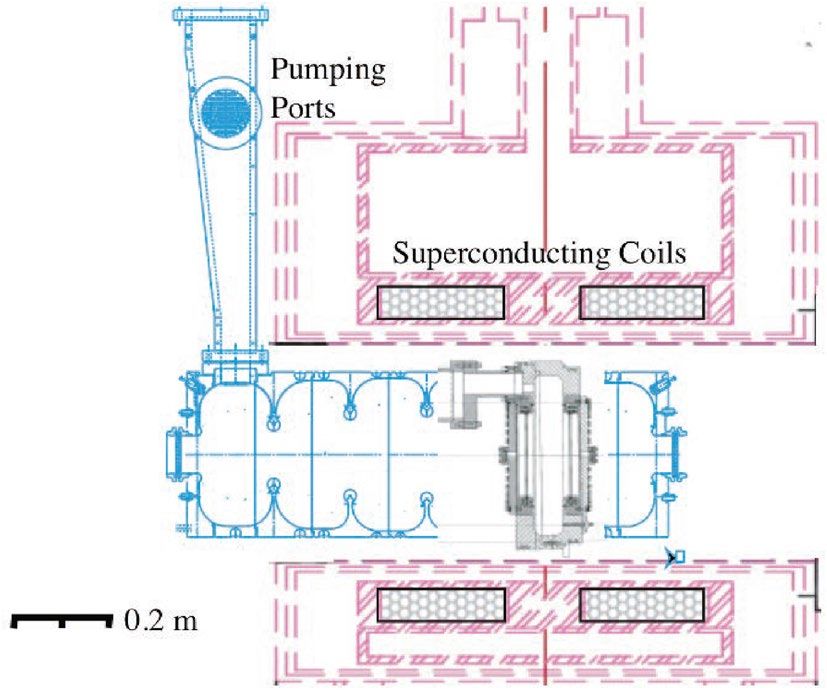
this paper assume a copper structure. The apparatus is shown in Fig. 29.
Triggers. We assume that high Maxwell tensile stresses mechanically break the surface, essentially an explo-
sion driven by electric fields, producing a local cloud of neutral atoms close to the asperity, which continues to
field emit. The parameters of breakdown events obtained in breakdown studies at 805 MHz, are shown in Fig. 39.
Following Lord Kelvin, this model assumes that triggers are due to mechanical failure of the surface due to
Maxwell stresses comparable to the tensile strength and the high fields required are produced the corners that
exist at crack junctions and other f eatures15,18,40. In practice, the arguments of Lord Kelvin are difficult to apply
at atomic dimensions, and it is necessary to use more sophisticated models and mechanisms. Failures of metal-
lic samples in Atom Probe Tomography Systems, where visible flashes are seen without the presence of field
emitted electrons imply that field emission is not necessary to produce surface failure, see Section 5.7 of Miller20
and Kaiser22. Thus triggers and particulate production with sharp field thresholds and ns timing can occur on
a positively charged surface.
Scientific Reports | (2021) 11:2361 | https://doi.org/10.1038/s41598-021-81947-5 2
Vol:.(1234567890)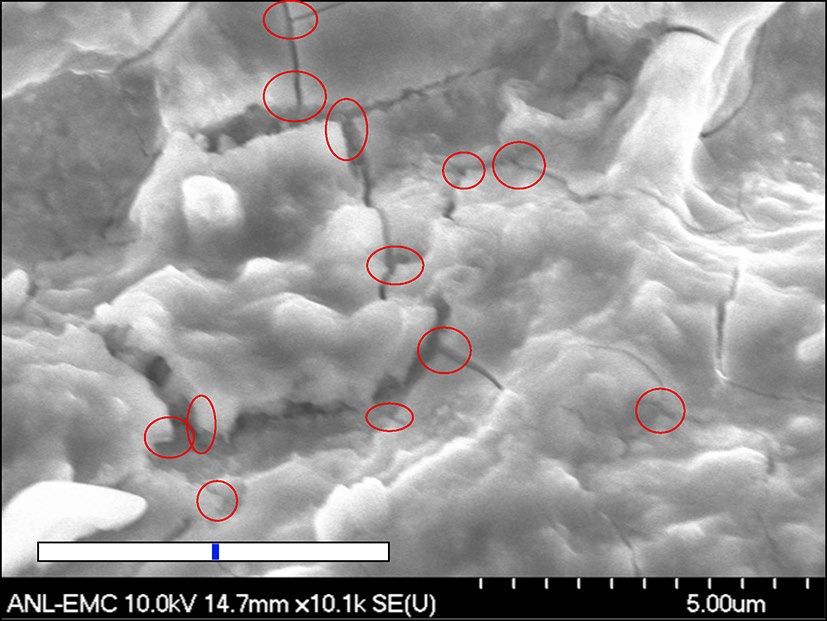
www.nature.com/scientificreports/
Figure 2. The six cell 805 MHz cavity (blue) in the superconducting magnet, showing the position of the single
cell pillbox cavity with removable surfaces (gray) that replaced it9.
Figure 3. Experimental data of field emission current in a c avity9 compared with fitted models, showing the
magnitude of current d ensity6 and electric field at the field emission sites, along with the limits that would be
imposed by the material tensile strength9, electromigration27, and field evaporation from smooth s urfaces20 and
the space charge limit18,19. The experimental data sums the contributions of roughly 1000 e mitters9. The precise
values of the various limits depend on the metallic properties and experimental conditions and the local space
charge limit is very difficult to measure.
In RF experiments, the average values of accelerating fields can be determined from the geometry and applied
power. The local field at the breakdown location is more difficult to determine but can be measured from the
dependence of field emitted current on electric field, which depends on the exponent n, IFE ∼ E n. The values
of electric field for cavities and local models are shown in Fig. 49. Local asperities enhance the local field on the
surface by a factor
β = Elocal /Esurf ∼ 50 − 1000,
Scientific Reports | (2021) 11:2361 | https://doi.org/10.1038/s41598-021-81947-5 3
Vol.:(0123456789)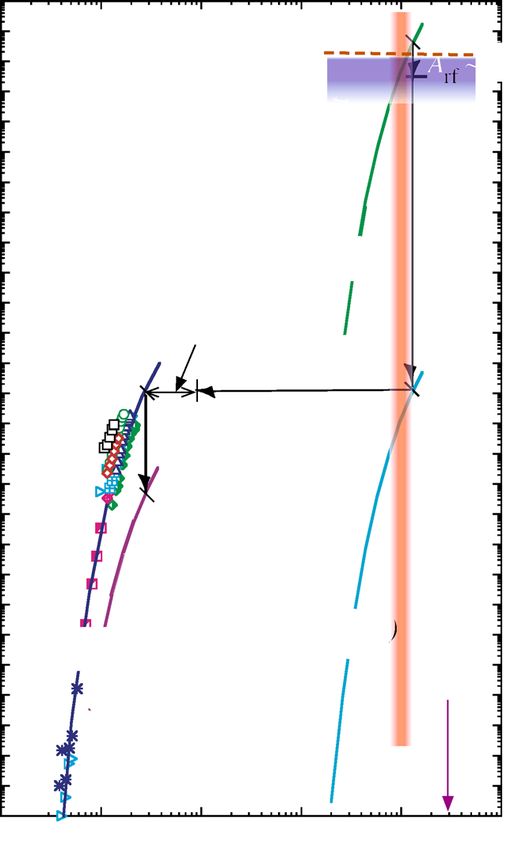
www.nature.com/scientificreports/
Figure 4. The local electric field, Elocal , can be obtained from the exponent n from field emission measurements
I ∼ E n and estimates of the work function φ,20. Experimental data shows that n ∼ 14 for radiation levels and
n ∼ 13 for field emission9.
where the enhanced field on the asperity Elocal , and the average surface field on the surrounding area is Esurf ,
following Alpert et al.7. We show below that the geometry of active asperities (right angle corners) produces
minimal heating and maximum heat loss relative to thin asperities assumed by the EEE model.
It is a useful oversimplification to say that a surface will break down at Elocal ≃ 10 GV/m. Because all real
surfaces we consider are rough, possibly under internal stress at some level, and are not clean, the work func-
tions φ are not precisely known and the spectrum of field enhancements due to multiple asperities are not well
understood. We determine the local field on the emitter using the field emission model of Brody and S pindt20,
used in vacuum microelectronics. We assume that the work function φ ≃ 5–6 eV, because the primary impurity
present would be oxygen, which is electronegative6. This is shown in Fig. 4. The experimental parameters of the
field emitting surface are limited because the only measurable quantity during high gradient operation is the
exponential dependence of the field emitted current on field, requiring an estimate of the surface work function
to determine the local field.
Plasma initiation. The material removed from the surface would continue to be exposed to field emission,
which would ionize it. This model assumes that plasma ions are produced with very low ion temperatures and
essentially confined inertially, producing a low temperature plasma near the field emitter, trapping some of the
electrons, but leaving the plasma with a net positive charge. The resulting sheath potential (and image charge)
increases the field on the field emitter and confines the plasma close to the surface. Field emission maintains the
plasma electrons32. Self-sputtering from plasma ions and sublimation maintains the ion density33, Image charges
provide the charge to stick the plasma to the surface. And the density rises until the plasma plasma becomes
non-linear (non-Debye)36.
Particle in cell, (PIC) codes show that the initial plasma temperature, both Te and TI is cool, only a few eV,
however the sheath potential between the plasma and the walls can be significantly higher than the plasma
temperature. This relationship persists as the density increases and the system eventually becomes non-Debye36.
Data on arc damage shows the arcs are roughly 500 µm in diameter9.
Plasma evolution. We assume that the plasma produced in arcs is a unipolar arc, first described by Robson
and Thoneman31. in 1959, and later by Schwirzke30, Anders1, Jüttner17 and Wang et al.37. The arcs are dense,
unstable and frequently in motion. There is an extensive literature on these arcs, the damage they produce and
their complex behavior. Although classical unipolar arcs have no external currents, field emission at the surface
could produce a net current, and could be a source of instabilities.
The properties of unipolar arcs depend primarily on the plasma density, which can be high enough to make
the plasma non-Debye, which occurs at around 6 × 1026 m−3, see Fig. 3.48 in Anders1 and Anders et al.35. The arc
properties are strongly dependent on the plasma sheath34,36,37, particularly ion self sputtering at high temperatures
and high tensile stresses. When combined with other existing data on arc behavior, modeling using PIC and
Molecular Dynamics (MD) codes, see Fig. 5, has shown that densities in this range can explain the gross features
of the Debye lengths, burn voltages (sheath potentials) and other plasma properties measured experimentally.
In Fig. 5, MD was used to evaluate the local equilibrium electron densities produced when electrons, which
move much faster than ions, leave the plasma boundary, producing the sheath that depends primarily on the elec-
tron temperature and ion density. Calculations of the sheath of non-Debye plasmas at high densities have shown
that electron temperatures, Te ∼ 3 eV and ion temperatures less than this would be consistent with experimental
data on plasma density and burn voltages of 23 V, seen e xperimentally18,36 and Table B8 of A nders1. The calcula-
tions predict that the surface electric field produced in the sheath would be on the order of E > 7 × 10⁹ V/m,
sufficient to produce significant field emission from flat surfaces without any field enhancement. These currents
would also be sufficient to short out the driving field and absorb all the electromagnetic energy in the system.
Scientific Reports | (2021) 11:2361 | https://doi.org/10.1038/s41598-021-81947-5 4
Vol:.(1234567890)www.nature.com/scientificreports/
Figure 5. The interaction between measured properties, (surface field and burn voltage) and electron
temperature Te and density, ne from sheath calculations, with density measurement by Anders et al.35,36.
We also argue that the combination of plasma pressure, Maxwell stresses and surface tension would produce a
turbulent liquid surface18. This turbulence could be a source of instability for the plasma, leading to oscillations,
local quenching and plasma motion, with the whole surface under the arc plasma would be emitting dense field
emission currents.
Surface damage. We assume that the dominant mechanisms in surface damage are surface tension, local
thermal gradients, differential cooling, solidification and contraction at locations of arc and particulate damage.
Unipolar arcs leave a variety of characteristic damage structures on materials30,31,37,41. The primary mecha-
nisms by which the plasma affects the (presumably molten) metallic surface are plasma pressure caused by ions
leaving the plasma and hitting the surface, electrostatic Maxwell stresses pulling on the surface, and surface
tension, which tends to locally flatten the s urface38,41. The interplay between these mechanisms is geometry
dependent. Plasma pressure tends to be locally constant, however Maxwell stresses are highly dependent on the
local radius of the surface, since the force is dependent on E 2, and E near an equipotential is dependent on the
local radius. Surface tension, dependent on the linear dimensions involved, becomes more dominant at small
dimensions, unlike pressures, which are dependent on the areas involved. In general, plasma pressure is similar to
hydrostatic pressure, which does not affect the liquid surface geometry, Maxwell stresses pull on convex shapes,
becoming stronger as the tips of the surface become sharper. Surface tension tries to smooth surfaces. These
effects produce a turbulent surface, perhaps with small areas pulled out from the primary surface.
When the plasma terminates, this turbulent surface relaxes due to surface tension and is governed by capillary
waves, locally smoothing the s urface38. At some point the liquid metal will freeze, and the surface will continue
to cool, generating stress due to local thermal gradients and differential contraction. This stress is relieved by
surface fractures, and many examples of cracks produced at the center of arc damage sites are s een18. The cracks
produced are seen in SEM images both with and without magnetic fields, and can have the field enhancements
required by breakdown calculations, as seen in Fig. 6. We argue asperities are produced during damage, and
there is no need to assume that they grow during subsequent operation of the system. Asperity growth, which
would be detectable in dark current intensities and radiation levels, is not s een9,18.
The production of high field enhancements is a requirement of damage models, in order to predict realis-
tic arcing behavior and conditioning. These cracks are not the only possible mechanism producing high field
enhancements, however. Systems at higher frequencies that do not see convoluted surfaces, craters or other
obvious asperities may not see these crack junctions, but they should be sensitive to particulates which could
be deposited and rapidly cooled, leaving small, sharp points (high β s on an otherwise flat surface) see Fig. 22 of
Scientific Reports | (2021) 11:2361 | https://doi.org/10.1038/s41598-021-81947-5 5
Vol.:(0123456789)www.nature.com/scientificreports/
Figure 6. Many cracks visible in SEM images of the center of an arc damage spot at a magnification of × 10,100.
Crack junctions where high field enhancements are expected, are noted. The widths of the cracks are caused by
the thermal contraction of the material, �× ∼ ×α�T ∼ 2% of the initial section, as it cools after solidifying,
where α is the coefficient of thermal expansion and T is the change in temperature. The overall diameter
of the damage is ∼ 500 µm, which explains the wider cracks. The blue spot is 2% of length the white line for
comparison. The sharp corners would have high local fields, likely sources of field e mission16,18.
Norem et al.9, and Fig. 14 of Wu et al.42, Feynman16 and Cahill et al.43. These particulates should be present in
vary large numbers, but might require very high magnifications to identify them.
Details
There are a number of extensions and issues that should be described by any useful model of breakdown. We
can outline a number of differences between this model and the Explosive Electron Emission model which show
how mechanisms can interact in ways that are experimentally observable.
Diffusion vs. electromigration. Unlike diffusion, which is extensively modeled, electromigration has
not been studied in detail in connection with breakdown, despite some similarities in the atomic motions
required. Electromigration is described by Black’s equation for the Mean Time To Failure in electronic systems,
(MTTF)27,28,44,45.
BDR ∼ MTTF −1 = Aj2 e−Q/kT ,
where A is a constant, j is the current density, Q is the activation energy for moving atoms from one place to
another, k is Boltzmann’s constant and T is the absolute temperature. Both electromigration and diffusion contain
the Arrhenius term, essentially describing activation energy of the same atomic motions, however with electro-
migration the motions are driven and not random. The activation energy for atomic motion on the surface is 0.8
iele28. Electromigration is
V for copper which is lower than other atomic motions, see Table 2.1 in Lienig and Th
the primary cause of failure in electronic components, where it easily dominates diffusion at current densities
greater than ∼ 1010 A/m2.
Many models assume that field enhanced diffusion explains how the field enhancement of asperities could
increase with time, however electromigration (described below), which dominates diffusion under low field
conditions, should maintain its relative dominance over diffusion under high stresses, as shown in experiments,
see Table 5.23 of O hring27 and Tables 2.1 and 4.5 of Leinig and Th
iele28.
The conditioned surface. The problem of conditioning illustrates some of the experimental difficulties
involved with understanding arcs, with many variables and limited experimental access. During conditioning,
the surface is covered with asperities, and the ones with higher local fields are expected to break down, leaving
the maximum local field somewhat lower, permitting an incremental increase in average field.
Although sufficient data is available to provide a general picture, it comes from many sources and cannot be
combined with precision without modeling. For example, the spectrum of enhancement factors has been meas-
ured below the breakdown threshold in a variety of environments8,39, field emission from conditioned cavities has
been imaged with good r esolution9, and the field dependence of breakdown rate, has been m easured43. However,
these measurements have been made on different structures, at different frequencies, in programs with different
goals. Detailed modeling or experimental study of mechanisms is has not been done.
If we assume that the breakdown rate is the convolution of the breakdown threshold t(Elocal ) and the density
distribution of the local field emitters n(Elocal ), where the product βE = Elocal is equal to the local field on the
field emitters, then the breakdown rate is equal to,
BDR ∼ n(Elocal )t(Elocal )dElocal .
Scientific Reports | (2021) 11:2361 | https://doi.org/10.1038/s41598-021-81947-5 6
Vol:.(1234567890)www.nature.com/scientificreports/
Figure 7. The spectrum, of asperities, n(β), with the threshold for breakdown t(βE) for a conditioned s ystem9.
The spectrum of asperities on the arcing surface evolves during conditioning due to creation of asperities with
higher βs, due to single arcs. These must eventually be burned off by arcing. This is done at lower voltages to
minimize generation of high β asperities. Not to scale.
Figure 8. The active surface in an RF cavity, showing: (a) an image of field emitted beamlets from an 8 cm
diameter iris in a fully conditioned cavity in a 3 T magnetic field, showing that the surface of the irises is covered
in high field enhancement asperities, and the active sites are at essentially equal local field enhancements, and
(b) an iris in the 6 cell cavity showing arc damage spots about 500 µm in in diameter. The apparatus is described
in Ref.9. The image in Fig. 5 is seen in the center of one of these spots. Experimental details are presented in
Refs.9,39.
Although we are unable to measure the function t(Elocal near the breakdown threshold, it is clear that both
n(Elocal ) and t(Elocal ) must be sharp to produce a dependence like BDR ∼ E 3043.
Figure 7 sketches the spectrum of enhancement factors n(β) below the breakdown threshold due to arc dam-
age from previous events which measure the spectrum asperity creation. The emitter density below the break-
down threshold has been measured in unconditioned systems in a number of experiments, giving n(β) ∼ e−β/40
,39 and Figs. 12–14 in Padamsee and Knobloch8. The dependence of the breakdown rate on field has also been
measured above the threshold, and BDR ∼ E 30, implies that n(E) ∼ E −m near the breakdown threshold, as shown
in the figure, and measure asperity destruction during conditioning. The exponent m must be constrained by
the relation m < n, otherwise the field emission of asperities far below threshold would overwhelm the asperi-
ties near threshold.
The colinear magnetic field available in our experiments confined the field emitted electrons near the magnetic
field lines, permitting images of the field emitting surface on glass plates and photographic film. Figure 8 shows
Scientific Reports | (2021) 11:2361 | https://doi.org/10.1038/s41598-021-81947-5 7
Vol.:(0123456789)www.nature.com/scientificreports/
(a) an image of field emission from the iris of a conditioned cavity showing single damage spots with resolution
of ∼ 1 mm with a uniform distribution of asperities and, (b) a photograph of a conditioned iris in this cavity.
In this large, well conditioned cavity with six irises, with a total field emitting area of approximately 0.054 m 2 ,
we estimate a total of about 4000 active damage spots near the breakdown limit and a density of these spots is
roughly 70,000 m−2, as seen in Fig. 8a. This image implies that in a conditioned system, all active emitters have
almost identical field enhancements, giving a sharp breakdown threshold, and field emitted currents from single
spots would be roughly 1/NBD ∼ 10−3, or less, of the total field emitted current.
Space charge and trigger polarity. The active areas of emitters should not be smooth, and fluctuations
in the local radius should have comparable effects in the local field across the emitter16. If the field varied by a
factor of three, Fig. 3 shows that current densities could vary by ∼ 106 − 108, complicating precise calculations.
The effects of space charge and the angular distribution of emitted electrons from uneven surfaces have been
described for many years19, and frequently modeled18. When field emitters produce high currents, the electron
density near the surface may rise high enough to locally load the electric field to the point where the surface field
is significantly reduced, This field reduction has the effect of limiting both the current density and the surface
field available with a negatively charged surface, producing both a space charge limit and a surface field limit, and
repressing field evaporation. The field above positively charged surfaces thus could be considerably higher than
negatively charged ones, particularly with rough or pointed emitters, see Fig. 13 of Dyke and Trolan19, with the
Maxwell tensile stresses being proportional to the field squared. This argument implies that the trigger of RF
breakdown events might most likely be from the RF phase where the surface is positive, rather than negative so
that the breakdown trigger is entirely electrostatic, rather than driven by heating of the surface as in DC systems.
This is consistent with the very fast fast breakdown seen in RF e xperiments42, and ns Atom Probe Tomography
pulses, see Fig 5.15 of Miller20.
Data from breakdown studies show that breakdown rates are not constant, but the events come in c lusters42,
where a single primary breakdown event can immediately trigger a cluster of secondary events on subsequent
pulses. This requires that the the breakdown rate rising as E 3042, is likely due to the product of primary and
secondary trigger rates. We assume that the field dependence of primary events should go like E s , with s > 16,
and should be measurable.
Emitter dimensions. The dimensions of structures emitting dark currents during normal operation can be
determined from measurements of surface d amage9. The damage spots seen in data were all roughly 500 µm in
diameter, where the total field emitting area of the spot is on the order of 2.5 × 10⁻¹³ m 2 , from Fig. 3. Assum-
ing 100–1000 rectangular corners functioning as emitters, this implies that the individual emitting corners have
effective areas of 2.5 − 25 × 10−16 m 2 , or diameters on the order of 16–50 nm. Since the overall dimensions of
these structures is on the order of 1 µm, comparable those seen in Refs.6,19, we expect that these dimensions may
be typical for other systems. Note that when the arc is present the surface fields are large enough to potentially
make the whole arc area a field emitter.
Conclusions
Field gradient limits are central to the design and costing of a number of ∼10 B$ projects and, 120 years after vac-
uum arcs were identified, these limits are still not well understood. This paper highlights the sharp field depend-
ence, fast breakdown times and inconspicuous surface damage as critical issues in RF breakdown. Although the
expected “unicorn horn” shaped field emitters have not been usually seen, our data shows surfaces exposed to
high electric fields are densely and uniformly covered with inconspicuous (µm scale) surface crack junctions
that function at field emitters. We show how further study of these issues can help to constrain and advance
modeling of RF vacuum arcs.
The model presented here differs from the conventional wisdom, however much of the data described here
has been produced in the same experimental system and should be verified at other frequencies, providing an
opportunity to reexamine the modeling and experimental details of vacuum arcs from a different and more
general perspective. The model implies that less conspicuous surface structures, a wider range of RF frequencies,
different materials and experimental conditions could all produce useful information. In addition, it should be
useful to look at the similarities between RF vacuum breakdown, Atom Probe Tomography surface failure and
high current density systems.
The data described in this paper has been obtained from a variety of environments, however more data could
be used to verify and improve the work presented here. Measurements and modeling of basic parameters such
as Te , Ti , ne , ni can constrain models of how plasma pressure, Maxwell stress and surface tension determine the
time evolution of the surface during and after arcing, and other mechanisms involved with the arcing process.
Received: 15 October 2020; Accepted: 12 January 2021
References
1. Anders, A. Cathodic Arcs, From Fractal Spots to Energetic Condensation (Springer, New York, 2008) (Ch. 3).
2. Lafferty, J. M. Vacuum Arcs. Theory and Applications (Wiley, New York, 1980).
3. Mesyats, G. A. & Podkurovsky, D. I. Pulsed Electrical Discharge in Vacuum (Spinger, Berlin, 1989).
4. Latham, R. (ed.) High Voltage Vacuum Insulation, Basic Concepts and Technological Practice (Academic Press, London, 1995).
5. Boxman, R. L., Martin, P. J. & Sanders, D. M. Handbook of Vacuum Arc Science and Technology (Noyes Publications, Park Ridge,
1995).
Scientific Reports | (2021) 11:2361 | https://doi.org/10.1038/s41598-021-81947-5 8
Vol:.(1234567890)www.nature.com/scientificreports/
6. Brodie, I., Spindt, C. A. In Advances in Electronics and Electron Physics, Microelectronics and Microscopy, Vol. 83 (ed. Hawkes, P.
W.) 1 (Academic Press, New York, 1992).
7. Alpert, D., Lee, D. A., Lyman, E. M. & Tomaschke, H. E. Initiation of electrical breakdown in ultrahigh vacuum. J. Vac. Sci. Technol.
1, 1 (1964).
8. Padamsee, H., Knobloch, J. & Hays, T. RF Superconductivity for Accelerators 2nd edn. (WileyVCH, Weinheim, 2008).
9. Norem, J. et al. Dark current, breakdown, and magnetic field effects in a multicell, 805 MHz cavity. Phys. Rev. STAB 6, 072001
(2003).
10. Moretti, A. et al. Effects of high solenoidal magnetic fields on RF accelerating cavities. Phys. Rev. STAB 8, 072001 (2005).
11. https://www.jlab.org/FEL/LPC/05lpc-mao.pdf.
12. Meyer-Vernet, N. et al. Dust detection by the wave instrument on STEREO: Nanoparticles picked up by the solar wind?. Solar
Phys. 256, 463 (2009).
13. Earhart, R. F. The sparking distances between plates for small distances. Philos. Mag. 1, 147 (1901) (Thesis written for A. A.
Michelson).
14. Hobbs, G. M. The relation between P.D. and spark-length for small values of the latter. Philos. Mag. 60, 671 (1905) (Thesis written
for R. A. Millikan.).
15. Kelvin, Lord, Insulation, Electrical & in “vacuum”, Phil. Mag. 8, 534, ,. Also, Mathematical and Physical Papers, Vol. VI, Voltaic
theory, Radioactivity, Electrions, Navigation and Tides, Miscellaneous, Cambridge University Press, Cambridge 1911, 211 (1904).
16. Feynman, R., Leighton, T. E., Sands, M. Feynman Lectures on Physics, Vol. II, Section 6–11, High-voltage breakdown. (Addison
Wesley, New York, 1963).
17. Jüttner, B. Cathode spots of electric arcs. J. Phys. D Appl. Phys. 34, R1-3-R123 (2001).
18. Insepov, Z. & Norem, J. Can surface cracks and unipolar arcs explain breakdown and gradient limits?. J. Vac. Sci. Technol. A 31,
011302 (2013).
19. Dyke, W. P. & Trolan, J. K. Field emission: Large current densities, space charge, and the vacuum arc. Phys. Rev. 89, 799 (1953).
20. Miller, M. K. Atom Probe Tomography. Analysis at the Atomic Level (Kluwer, New York, 2000).
21. Larson, D. L., Prosa, T. J., Ulfig, R. M., Geiser, B. P. & Kelly, T. F. Local Electrode Atom Probe Tomography (Springer, New York,
2013).
22. Kaiser, K. L. Electrostatic Discharge, (CRC Press, Boca Raton, 2019).
23. https://www.iter.org/mach/Heating.
24. Lings, R. (ed.) EPRI AC Transmission Line Reference Book—200 kV and Above, 3rd edn. (EPRI, Palo Alto, 2005).
25. Zhakiyev, N., Tynyshtykbayev, K., Norem, J. & Insepov, Z. Highly effective anti-corona coatings on aluminum wires by surface
modification. J. Phys. D Appl. Phys. 53, 015503 (2020).
26. https://www.instituteforenergyresearch.org/electricity-transmission/.
27. Ohring, M. Reliability and Failure of Electronic Materials and Devices, Chapter, 5 Mass Transport-Induced Failure (Academic Press,
Amsterdam, 2015).
28. Lienig, J., Thiele, M. M., Fundamentals of Electromigration Aware Integrated Circuit Design (Springer, Wien, 2018).
29. Wuensch, W. et al. Statistics of vacuum breakdown in the high-gradient and low-rate regime. Phys. Rev. STAB 20, 011007 (2017).
30. Schwirzke, F. R. Vacuum breakdown on metal surfaces. IEEE Trans. Plasma Sci. 19(5), 690 (1991).
31. Robson, A. E. & Thonemann, P. C. An arc maintained on an isolated metal plate exposed to a plasma. Proc. Phys. Soc. 73, 508
(1959).
32. Insepov, Z., Norem, J., Veitzer, S., Mahalingam, S. Modeling arcs, Proceedings of RF2011, June 1-3, Newport R. I. AIP Conference
Proceedings 1406 AIP Millville, New York (2011).
33. Insepov, Z., Norem, J. & Veitzer, Z. Atomistic self-sputtering mechanisms of RF breakdown in high-gradient linacs. Nucl. Instrum.
Method Phys. Res. B B268, 642 (2010).
34. Insepov, Z., Norem, J., Moretti, A., Morozov, I. V., Norman, G. E., Mahalingam, S., Veitzer, S. Progress in Modeling Arcs. In Pro-
ceedings of the IPAC12 Conference, New Orleans LA, May 20–25 (2012).
35. Anders, A. et al. Pulsed dye laser diagnostics of vacuum arc cathode spots. IEEE Trans. Plasma. Sci. 20(4), 466 (1992).
36. Morozov, I. V., Norman, G. E., Insepov, Z. & Norem, J. Sheath parameters for non-Debye plasmas: Simulations and arc damage.
Phys. Rev. STAB 15, 053501 (2012).
37. Wang, Lijun, Zhang, Xiao, Deng, Jie, Yang, Ze. & Jia, Shenli. Research progress of model of vacuum arc and anode activity under
axial magnetic fields. IEEE Trans. Plasma Sci. 47(8), 3496 (2019).
38. Landau, L. D., Lifshitz, E. M. Fluid Mechanics, Chapter VII. (Pergamon Press, London, 1959).
39. Hassanein, A. et al. Effects of surface damage on RF cavity operation. Phys. Rev. STAB 9, 062001 (2006).
40. Insepov, Z., Norem, J. H. & Hassanein, A. New mechanism of cluster-field evaporation in RF breakdown. Phys. Rev. STAB 7, 122001
(2004).
41. Mesyats, G. A. & Uimanov, I. V. Hydrodynamics of the molten metal during the crater formation on the cathode surface in a
vacuum arc. IEEE Trans. Plasma Sci. 43(8), 2241 (2015).
42. Wu, X. et al. High gradient breakdown studies of an X band compact linear collider prototype structure. Phys. Rev. AB 20, 052001
(2017).
43. Cahill, A. D., Rosenzweig, J. B., Dolgashev, V. A., Tantawi, S. G. & Wethersby, S. High gradient experiments with X-band cryogenic
copper accelerating cavities. Phys. Rev. AB 21, 102002 (2018).
44. Black, J. R., Electromigration—A brief survey and some recent results. IEEE Trans. Electron Devices. ED16(4), 338 (1969).
45. Antoine, C. Z., Peauger, F. & Le Pimpec, F. Electromigration occurrences and its effects on metallic surfaces submitted to high
electromagnetic field : A novel approach to breakdown in accelerators. Nucl. Inst. Method Phys. Res. A 665, 54 (2011).
Acknowledgements
We would like to thank the staff of Fermilab and the management of the Muon Accelerator Program who pro-
duced the facility where the experimental work we refer to was done. This work is based on experiments with
805 MHz cavities sponsored by the US/DOE, and directed at the problem of cooling diffuse beams of muons
from accelerator targets. We would also like to thank the Center for Nanoscale Materials at Argonne National
Lab. including a Hitachi SEM, supported by the Office of Energy, Office of Science, Office of Basic Energy Sci-
ences user facility, under Contract No DE-AC02-06CH11357. Z.I. is supported in part by the World Science
Stars grant by Nazarbayev University.
Author contributions
J.N. was responsible for the experimental data, Z.I. was responsible for most of the calculations, and A.H. con-
tributed specific plasma ideas and experience. All authors reviewed the manuscript.
Scientific Reports | (2021) 11:2361 | https://doi.org/10.1038/s41598-021-81947-5 9
Vol.:(0123456789)www.nature.com/scientificreports/
Competing interests
The authors declare no competing interests.
Additional information
Correspondence and requests for materials should be addressed to J.N.
Reprints and permissions information is available at www.nature.com/reprints.
Publisher’s note Springer Nature remains neutral with regard to jurisdictional claims in published maps and
institutional affiliations.
Open Access This article is licensed under a Creative Commons Attribution 4.0 International
License, which permits use, sharing, adaptation, distribution and reproduction in any medium or
format, as long as you give appropriate credit to the original author(s) and the source, provide a link to the
Creative Commons licence, and indicate if changes were made. The images or other third party material in this
article are included in the article’s Creative Commons licence, unless indicated otherwise in a credit line to the
material. If material is not included in the article’s Creative Commons licence and your intended use is not
permitted by statutory regulation or exceeds the permitted use, you will need to obtain permission directly from
the copyright holder. To view a copy of this licence, visit http://creativecommons.org/licenses/by/4.0/.
© The Author(s) 2021
Scientific Reports | (2021) 11:2361 | https://doi.org/10.1038/s41598-021-81947-5 10
Vol:.(1234567890)You can also read