Estimated Economic and Fiscal Impacts Cleveland Cavaliers Quicken Loans Arena - associated with the and Presented to: Presented by: March 11, 2014
←
→
Page content transcription
If your browser does not render page correctly, please read the page content below

CONFIDENTIAL DRAFT
                                     Subject to Change

Estimated Economic and Fiscal Impacts
             associated with the

         Cleveland Cavaliers
                    and

        Quicken Loans Arena

               Presented to:

               Presented by:

              March 11, 2014
March 11, 2014

Mr. Len Komoroski
Chief Executive Officer
Cavaliers Operating Company, LLC.
1 Center Court
Cleveland, Ohio 44115

Dear Mr. Komoroski:

Conventions, Sports & Leisure International (“CSL”) is pleased to present this draft of a
report regarding the economic and fiscal impacts estimated to be generated by the
development and operation of Quicken Loans Arena (“Arena”) and the ongoing
operations of the Cleveland Cavaliers (“Cavaliers”). The attached report summarizes our
research, analyses, and findings.

The information contained in this report is based on historical Arena and Cavaliers
operations, results of patron intercept surveys conducted at Arena events, and other
information developed from research of the market, knowledge of the industry, and other
factors, including certain information provided by you. All information provided to us by
others was not audited or verified, and was assumed to be correct. Furthermore, there
will be differences between projected and actual results. This is because events and
circumstances frequently do not occur as expected, and those differences may be
material. We have no responsibility to update this report for events and circumstances
occurring after the date of this report.

We sincerely appreciate the opportunity to assist you with this project, and would be
pleased to be of further assistance in the interpretation and application of the study’s
findings.

Very truly yours,

CSL International

                                       Conventions, Sports & Leisure International
         7501 Lone Star Drive, Suite 200B • Plano, TX 75204 • Telephone 972.491.6900 • Facsimile 972.491.6903
Table of Contents

EXECUTIVE SUMMARY ...........................................................................................................i

I.       INTRODUCTION ...........................................................................................................1

II.      FRANCHISE AND ARENA OVERVIEW ...........................................................................5

III. ECONOMIC AND FISCAL IMPACT METHODOLOGY ........................................................9

IV. QUANTITATIVE ECONOMIC AND FISCAL IMPACTS ......................................................16

V.       CSL CREDENTIALS ...................................................................................................20

Executive Summary

Conventions, Sports & Leisure International (“CSL”) was retained by the Cleveland
Cavaliers (“the Cavaliers” or “the Team”) to estimate the economic and fiscal impacts
related to the operation of the Cavaliers and Quicken Loans Arena (“the Arena”). The
study is designed to assist in identifying the quantifiable economic impacts of the Arena
and the Team.

This Executive Summary outlines the key highlights of the analyses conducted. The full
report should be read in its entirety to obtain the background, methodology and
assumptions underlying these findings.

Typically, and for the purposes of this report, quantifiable effects are characterized in
terms of economic impacts and fiscal impacts. Economic impacts are conveyed through
measures of direct spending, total output, personal earnings, and employment. Fiscal
impacts denote changes in tax revenues that result due to the operation of the site.

The assumptions underlying the historical economic and fiscal impacts presented herein
are based on a combination of sources including historical operations, fan intercept
surveys, discussions with project representatives and CSL's industry knowledge, among
other sources. Projected economic and fiscal impacts were made by CSL based on the
aforementioned sources.

Key Highlights

•   The opening of Quicken Loans Arena in 1994 provided Cleveland with a modern
    sports and entertainment venue in the heart of the city’s downtown and formed a
    centerpiece of the Gateway development, which rehabilitated the former Central
    Market site and spurred an era of economic growth and renewal throughout
    downtown Cleveland.

•   The Gateway District has been the beneficiary of nearly $700 million in retail,
    residential and hotel development since the early 1990’s, due largely to the presence
    of the Arena and the adjacent Jacobs Field, which has been renamed Progressive
    Field.

•   The operations of the Arena and the Cavaliers provide significant quantifiable
    benefits to the Cuyahoga County and the City of Cleveland economies. In 2013, the
    direct spending attributable to Arena and Team operations is estimated to total
    approximately $136 million within the county, which does not include spending that
    immediately leaves the economy.

                                            i
Executive Summary

•   This level of direct spending in turn generated approximately $215 million of total
    output, $110 million in personal earnings and 2,100 direct jobs supported at the
    Arena. Additionally, this economic activity results in approximately $26 million in
    state and local tax revenue.

•   Over the first 20 years of Arena operations, from 1994 through 2013, it is estimated
    that the Arena and Team will generate the following cumulative economic impacts
    (stated in 2013 dollars):

       o $2.4 billion in direct spending;
       o $3.8 billion in total output;
       o $1.9 billion in earnings;
       o An average of 2,100 direct jobs supported at the Arena; and,
       o $437 million in state and local tax revenues.

•   The State of Ohio is the largest benefactor of taxes generated as a result of Arena and
    Team operations, collecting an estimated $230 million in tax revenues from 1994
    through 2013 (stated in 2013 dollars). During the same period, the City of Cleveland
    is estimated to collect $168 million in tax revenues, while Cuyahoga County tax
    receipts are estimated to approximate $39 million.

•   The estimates of the economic activity are based on an input-output model developed
    by the Minnesota IMPLAN Group, Inc. The IMPLAN model measures how a given
    change in output at a firm supports economic activity across many firms and
    households within a study area. The direct impacts represent operations at the given
    firm. Indirect effects generally measure the secondary economic activity that is
    created when the firm purchases goods and services from their suppliers. Induced
    impacts are a result of the firm paying salaries and wages to its employees, who then
    spend a portion of their earnings in the local economy for goods and services. When
    added together, the direct, indirect, and induced impacts create a “multiplier” effect
    such that the total impacts are greater than the initial value of output of the firm. The
    IMPLAN model is widely used in academic and professional studies and is judged to
    offer reasonable, conservative estimates of the impacts of firm activities.

•   The estimates of spending and related impacts are based on the historical operations
    of the Arena and the Cavaliers since the facility opened in 1994.

                                             ii
Executive Summary

•   In addition to the quantifiable economic and fiscal impacts discussed previously, the
    presence of the Arena and Team has benefited many community groups and non-
    profit organizations throughout the Greater Cleveland area.

                                           iii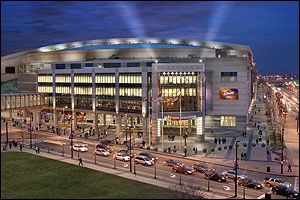
I. Introduction

The opening of Quicken Loans Arena (“the Arena”) in 1994 provided Cleveland with a modern
sports and entertainment venue in the heart of the city’s downtown. The development of the
Arena, originally known as Gund Arena, attracted the National Basketball Association (“NBA”)
Cleveland Cavaliers (“the Cavaliers” or “the Team”) back to Cleveland and Cuyahoga County
after 20 seasons in suburban Richfield. The Arena, along with the adjacent Jacobs Field,
renamed Progressive Field in 2008, which became the new home of the Major League Baseball
(“MLB”) Cleveland Indians, formed the centerpiece of the Gateway development, which
rehabilitated the former Central Market site and spurred an era of economic growth and renewal
throughout downtown Cleveland.

                         Quicken Loans Arena and Progressive Field

The development of the Gateway District in downtown Cleveland is a community and economic
development story that begins in the 1990s. Located on the southern end of downtown, the
Gateway District is proof how urban planning and economic development strategies have
fostered sustained growth in the creation of a dynamic mixed-use neighborhood.

Today, the Gateway District consists of 18 residential properties, five hotels, and over 60 full-
service restaurants and eateries that service its nearly 1,500 residents and five million visitors
each year. In addition, five properties are under construction or in design/development for
additional housing, hotel and retail. This represents over $700 million in investment surrounding
the Gateway Sports Complex.

                                                1
I. Introduction

In 1990, in addition to only six full-service restaurants, there were no/zero housing units and
no/zero hotel rooms. Today:

   •   The Gateway District consists of 18 residential properties with more than 1,400 units in
       2013 with 264 new units currently in the planning and construction stages.

   •   The Gateway District experienced significant investment in hotel operations leveraged by
       the Gateway Sports Complex. The development of five new hotel properties has resulted
       in an inventory of 1,000 hotel rooms within the Gateway District in 2014, with an
       additional 656 rooms slated for development. There are currently four hotels in various
       stages of development.

   •   With only six restaurants in 1990, the number of restaurants in the district increased to 17
       in 1997 to 38 full service restaurants and 31 eateries in 2013.

   •   Leveraging the initial hotel and restaurant/entertainment investment in the Gateway
       District, Euclid Avenue is emerging as a hospitality corridor between Public Square and
       Playhouse Square.

                                                 2
I. Introduction

                  Gateway District Before and After Redevelopment

                                         3
I. Introduction

In order to gain an understanding of the impacts that the operation of the Arena and the Cavaliers
have had and, will continue to have, on the local economy, the Cavaliers engaged Conventions,
Sports and Leisure International (“CSL”) to develop an independent estimate of the quantifiable
impacts generated by the Arena and Team. This report represents an update to a study originally
commissioned by the Positively Cleveland Convention and Visitors Bureau (“PCCVB”).

Typically, and for the purposes of this report, quantifiable effects are characterized in terms of
economic impacts and fiscal impacts. Economic impacts are conveyed through measures of
direct spending, total output, personal earnings, and employment. Fiscal impacts denote changes
in tax revenues.

The assumptions underlying the estimates of economic and fiscal impacts are based on the
historical operations of the Arena and Team, the results of 577 random patron-intercept surveys
conducted at the Arena, historical and projected operations of the Arena and Team, the use of
IMPLAN multipliers, and CSL’s experience in quantifying the economic and fiscal impacts of
similar projects. The study’s findings are presented in the following sections:

      I.     Introduction;
      II.    Franchise and Arena Overview;
      III.   Economic and Financial Impact Methodology;
      IV.    Quantitative Economic and Fiscal Impacts;
      V.     Qualitative Impacts; and,
      VI.    CSL Credentials.

This report outlines the key highlights of the economic and fiscal impact analysis of the
historical and future operations of Quicken Loans Arena and the Cleveland Cavaliers. The study
is designed to assist the community in understanding the impacts that the Arena and Team have
had and will have on the local economy. The report should be read in its entirety to obtain the
background, methods and assumptions underlying the findings.

                                                4
II. Franchise and Arena Overview
Overview of the Cleveland Cavaliers
The Cavaliers joined the National Basketball Association
(“NBA”) as an expansion franchise in 1970. During the
Team’s first four seasons, home games were played at
Cleveland Arena, a 9,800 seat facility built in 1937 and located
east of downtown Cleveland.
In 1974, the Cavaliers relocated to the newly constructed Richfield Coliseum. Located in
suburban Richfield, approximately 20 miles south of downtown Cleveland, the 20,000-
seat Coliseum provided the Team with a larger, more modern venue than Cleveland
Arena. The franchise enjoyed on-court success during its first few years at the Coliseum
before struggling throughout the early 1980’s, a period
marked by two franchise ownership changes. In 1980,
team founder Nick Mileti sold the franchise to Ted
Stepien, who owned the franchise for three years
before it was sold to Gordon and George Gund in
1983.
The Gund ownership group brought great stability, leadership
and growth to the franchise as the Team thrived in the
privately-owned and operated Richfield Coliseum, on and off
the court. On the court, the team qualified for the playoffs in
six of the seven seasons between 1987 and 1994. Off the court,
the franchise enjoyed one of the best facility and revenue
stream platforms in the NBA and a home court that was also
attractively situated in the middle of their marketplace and fan
geography. i
In the midst of this success, however, discussion escalated regarding the need for a new
Cleveland Indians MLB stadium and the risk for potential relocation of the Indians to
another city. The community searched for a multi-venue solution to help keep the Indians
in Cleveland with a new stadium, while also enticing the Cavaliers to move downtown
with a new arena. Hence, the Gateway District project was born. The decision to move
the Cavaliers downtown was a difficult one for the franchise, as it enjoyed full ownership
of its arena and property in Richfield along with the associated revenue streams.
Ultimately, the Gateway District effort hinged on the Cavaliers agreeing to join the
project. While forgoing what was likely a more financially attractive and regionally
desirable location in Richfield, Cleveland civic pride became a determining factor, and
the franchise agreed to join the Gateway District project and relocate to downtown
Cleveland.
5II. Franchise and Arena Overview
The Cavaliers returned to Cleveland beginning with the 1994-95 season, in the new
20,500-seat Gund Arena. The Team’s on-court success continued in the early years of
Gund Arena, with the franchise returning to the playoffs in three of the first four seasons
in its new home. While the team struggled on the court in the late 1990’s and early
2000’s, the Cavaliers then headed back to the playoffs in the mid-2000’s, drawing much
national media coverage to the Team, the Arena, the City of Cleveland and the region for
the remainder of the decade. At the same time, the Team agreed to re-define the terms of
its lease agreement with the Gateway Economic Development Corporation (GEDC), in
order to keep the GEDC solvent and place the burden of all operating and capital repairs
less than $500,000 on the Team.
The Team was purchased by a group led by Dan Gilbert, chairman and founder of
Quicken Loans in early 2005. The Arena name was changed to Quicken Loans Arena or
“The Q” and Gilbert has made over $45 million of private
investment to upgrade the Arena, including new seats,
scoreboards, video systems, technology and social media
systems, as well as upgrades to club entertaining areas,
locker rooms and team offices. Mr. Gilbert also built
Cleveland Clinic Courts, the $25 million state-of-the-art
Cavaliers player training and development center in nearby Independence, Ohio.
Mr. Gilbert has invested highly in the Team’s player personnel area during his
ownership. The Team has now taken a strategic position to develop a young core of
players, including the first group of four players from one team in the history of the NBA
to participate in the NBA All-Star weekend’s BBVA Rising Stars Challenge for first and
second year players in 2013. The Team also currently possesses a number of draft picks
in the next few years and significant player contract flexibility and salary cap space for
additional growth.
The Gilbert ownership group has also purchased and invested heavily in other franchises
now playing at The Q with the purchase and addition of the Lake Erie Monsters
(American Hockey League) in 2007 and the Cleveland Gladiators (Arena Football
League), who have been a tenant in the Arena since 2008, but were purchased by a group
led by Gilbert 2012.
6II. Franchise and Arena Overview
Overview of Quicken Loans Arena
Quicken Loans Arena is located in the
Gateway District at the south end of
downtown Cleveland and has served as
the home of the Cavaliers since 1994.
Two additional tenants have more
recently joined the Cavaliers at the
Arena: including the American Hockey
League (“AHL”) Lake Erie Monsters,
who began play in October 2007, and the
Cleveland Gladiators, who joined the Arena Football League (“AFL”) for the 2008
season. Past Arena tenants have also included the International Hockey League (“IHL”)
Cleveland Lumberjacks (1994-2001), the AHL Cleveland Barons (2001-2006), and the
Women’s National Basketball Association (“WNBA”) Cleveland Rockers (1997-2003).
The Arena was constructed at a cost of approximately $155.0 million. The project was
funded in conjunction with the development of the $230.0 million Jacobs Field, now
named Progressive Field. Public investment in the construction of the two facilities
totalled approximately $280.0 million financed by bonds issued by Cuyahoga County, as
well as various federal and state grants.
Quicken Loans Arena Funding Summary
Approximately $120.0 million of the Project Cost $155.0 million
Public Participation 77%
public funding was estimated to be Private Participation 23%
allocated toward Arena construction,
representing approximately 77 percent Private Business
Contributions:
Team
Contribution:
of total project costs. The remaining $28.0 million $7.0 million
funding components consisted of $28.0 i
million contributed by an organization
of 50 local business leaders and a $7.0
million contribution from Team County Alcohol
& Tobacco Tax:
ownership. $120.0 million
The Arena is owned by the Gateway Economic Development Corporation of Greater
Cleveland, a private, not-for-profit organization formed by the City of Cleveland and
Cuyahoga County in 1990 to oversee the financing, planning and construction of the
Gateway District sports complex. The Cavaliers signed a 33-year lease with the
Corporation to operate the building and play its home games therein. The current lease
expires following the 2026-2027, after which the Team will have the option to extend the
lease for three additional periods of five years each.
7II. Franchise and Arena Overview
Since opening in 1994, the Arena has provided Cleveland with a multi-faceted sports,
entertainment, and event venue, drawing about 2 million guests per year on average. In
addition to hosting 44 pre-season and regular season Cavaliers home games, the Arena
hosts a wide range of other sports seasons and events annually, including professional
hockey, arena football, other sporting events, concerts, family shows, special events,
charitable activities, and meetings.
A sports and entertainment facility, along with its tenant franchises, is often more than
just an entertainment choice or an employer in a diverse industry providing jobs and
income. It becomes a core element in the fabric of life of the community. These facilities
create economic and social value, and not just for those who directly consume the
product. Beyond the importance sports and entertainment play in a community in terms
of a major league, world class identity and quality of life, there are also a number of
quantifiable economic and fiscal benefits. Especially for facilities located in the urban
core, these benefits include increased neighborhood development and economic activity,
full and part-time jobs and increased tax revenues.
In addition to the numerous, general economic benefits attributable to the operation of
Quicken Loans Arena and the millions of guests that have visited the facility, various
community groups and non-profit organizations have also benefited. Contributions by the
Cavaliers and Quicken Loans Arena organization have positively impacted many local
non-profit organizations and community groups, totaling over $40 million dollars alone
since the arena opened in 1994.
8III. Economic and Fiscal Methodology
The operations of Quicken Loans Arena and the Cleveland Cavaliers provide significant
quantifiable benefits to the Cuyahoga County and City of Cleveland economies.
Typically, and for the purposes of this report, quantifiable effects are characterized in
terms of economic impacts and fiscal impacts. Economic impacts are conveyed through
measures of direct spending, total output, personal earnings, and employment. Fiscal
impacts denote changes in tax revenues. Each of the measures of economic impact is
further described below:
• Direct spending represents spending generated by Arena patrons including in-
facility expenditures on admissions, food and beverage, merchandise, hotel
rooms, rentals and other areas, as well as out-of-facility spending by patrons
on hotels, food and beverages, retail, transportation, and entertainment.
• Total output represents the total direct, indirect, and induced spending effects
generated by the Arena and the Cavaliers.
• Personal earnings represent the wages and salaries earned by employees of
businesses impacted by Arena and Team operations.
• Employment is expressed in terms of full- or part-time jobs.
Direct Spending
Quicken Loans Arena contributes directly to the local economy by increasing economic
activity, jobs and personal earnings. The operations of the Arena and the Cavaliers
impact the local economy in a variety of ways. As outlined on the following page, initial
direct spending is generated during operations on admissions, concessions, catering,
merchandise, parking and in other areas. Additionally, spending occurs throughout local
hotel, restaurant, retail, residential and other establishments. It is often difficult to
determine the level of spending that may have resulted in the absence of a specific
project. In the case of Cavaliers games, it is estimated that nearly 60 percent of attendees
do not reside in Cuyahoga County. The percentage even skews higher for other arena
events. Fans will go the distance to see major concerts like Katy Perry and Billy Joel, as
well as signature sporting events like the Mid-American Conference championships.
Furthermore, if the Arena had not been constructed in Cleveland, it is probable that the
fans originating from Cleveland would have exported their associated spending to the
municipality that would have accommodated the arena if it were not constructed in
Cleveland, a phenomenon that likely occurred when the Cavaliers played in Richfield
from 1974 through 1994.
9III. Economic and Fiscal Methodology
Direct Spending
Sources of Spending
Total Direct
Spending Construction Operations
• Materials • Tickets • Club Seats
• Supplies • Rent • Advertising
• Labor • Lodging • Sponsorships
• Professional Fees • Restaurants/Bars • Naming Rights
• Concessions • Licensing
• Retail • Personal Services
• Entertainment • Ticketing Services
• Parking • Media
• Transit • Other
• Suites
In order to accurately quantify initial direct spending, 577 intercept surveys were
completed with Arena patrons over a period of time. These surveys were conducted by
CSL and by Arena staff. The research instrument was designed to capture primary
market data regarding the attendance and spending behaviors of Arena patrons at
Cavaliers games. The results of the patron-intercept surveys are the primary basis for
developing assumptions related to fan origination and spending.
Total initial direct spending flows to various economic entities including the Arena, the
Cavaliers, other Arena tenants, restaurants, hotel operators, retail businesses and other
such entities. Focusing on the flow of spending is particularly important when analyzing
the unique characteristics of the sports and entertainment industry. As some of the
spending that occurs in connection with visits by Arena patrons does not fully impact the
local area, reductions in the total initial direct spending are made to reflect the amount of
spending associated with the Arena that remains locally. The direct impact excludes
spending that does not ever impact the local economy. For example, a significant portion
of fan spending is used by teams to pay players. However, it is unlikely that a large
percentage of that spending directly impacts Cuyahoga County. Other adjustments
include payments made to the sports leagues and entertainers/artists.
10III. Economic and Fiscal Methodology
As illustrated below, the flow of initial direct spending associated with the operation of
the Arena and Team is adjusted to reflect only the spending that remains within the local
area. The resulting spending, after all adjustments, is referred to throughout the
remainder of this analysis as direct spending.
Direct Spending Adjustments
Gross Project Spending
• Materials • Tickets • Concessions • Transit • Personal Svcs.
• Supplies • Rent • Retail • Suites/Club Seats • Media
• Labor • Lodging • Entertainment • Adv./Sponsorships • Other
• Prof. Fees • Restaurants/Bars • Parking • Naming Rights
Initial Direct Spending Adjustment
Adjustments are made to exclude spending that does not impact the
local economy or spending that occurs outside of the County.
Direct Spending
Represents portion of spending occurring in the County that remains in
the local economy.
Multiplier Effects
Economic impacts are further increased through re-spending of the direct spending. The
total impact is estimated by applying an economic multiplier to initial direct spending to
account for the total economic impact. The total output multiplier is used to estimate the
aggregate total spending that takes place beginning with direct spending and continuing
through each successive round of re-spending. Successive rounds of re-spending are
generally discussed in terms of their indirect and induced effects on the surrounding
economy. Each is discussed in more detail as follows:
Indirect effects consist of the re-spending of the initial or direct expenditures. These
indirect impacts extend further as the dollars constituting the direct expenditures continue
to change hands. This process, in principle, could continue indefinitely. However,
recipients of these expenditures may spend all or part of it on goods and services outside
the market area, put part of these earnings into savings, or use them to pay taxes. This
spending halts the process of subsequent expenditure flows and does not generate
additional spending or impact within the community after a period of time. This
progression is termed leakage and reduces the overall economic impact.
11III. Economic and Fiscal Methodology
Indirect impacts occur in a number of areas including the following:
• Wholesale industry as purchases of food and merchandise products are made;
• Transportation industry as the products are shipped from purchaser to buyer;
• Manufacturing industry as products used to service arena, sports franchise(s),
vendors and others are produced;
• Utility industry as the power to produce goods and services is consumed; and,
• Other such industries.
Induced effects consist of the positive changes in spending, employment, earnings and tax
collections generated by personal income associated with the operations of the various
facilities. Specifically, as the economic impact process continues, wages and salaries are
earned, increased employment and population are generated, and spending occurs in
virtually all business, household, and governmental sectors. This represents the induced
spending impacts generated by direct expenditures.
The appropriate multipliers to be used are dependent upon certain regional characteristics
and also the nature of the expenditure. An area which is capable of producing a wide
range of goods and services within its border will have high multipliers, a positive
correlation existing between the self-sufficiency of an area's economy and the higher
probability of re-spending occurring within the region. If a high proportion of the
expenditures must be imported from another geographical region, lower multipliers will
result.
The following graphic illustrates the flow of direct spending through the successive
rounds of re-spending including indirect and induced effects on the local economy.
12III. Economic and Fiscal Methodology
Multiplier Effect
Direct In-Facility Out-of-Facility Team-Related
Food & Numerous
Transport Energy/
Indirect Merchandise
Company Manufacturers Other
Wholesaler Utilities Industries
All Other
Business Household Governmental
Induced Services Spending Spending
Economic
Sectors
The multiplier estimates used in this analysis are based on the IMPLAN system.
IMPLAN, which stands for Impact Analyses and Planning, is a computer software
package that consists of procedures for estimating local input-output models and
associated databases. Input-output models are a technique for quantifying interactions
between firms, industries and social institutions within a local economy.
IMPLAN was originally developed by the U.S. Forest Service in cooperation with the
Federal Emergency Management Agency and the U.S. Department of the Interior's
Bureau of Land Management to assist in land and resource management planning. Since
1993, the IMPLAN system has been developed under exclusive rights by the Minnesota
Implan Group, Inc. which licenses and distributes the software to users. Currently, there
are hundreds of licensed users in the United States including universities, government
agencies, and private companies.
The economic data for IMPLAN comes from the system of national accounts for the
United States based on data collected by the U. S. Department of Commerce, the U.S.
Bureau of Labor Statistics, and other federal and state government agencies. Data are
collected for 440 distinct producing industry sectors of the national economy
corresponding to the Standard Industrial Categories (SICs). Industry sectors are
classified on the basis of the primary commodity or service produced.
Corresponding data sets are also produced for each county in the United States, allowing
analyses at the county level and for geographic aggregations such as clusters of
contiguous counties, individual states, or groups of states. For purposes of this analysis,
economic multipliers specific to Cuyahoga County were used.
13III. Economic and Fiscal Methodology
Data provided for each industry sector include outputs and inputs from other sectors,
value added, employment, wages and business taxes paid, imports and exports, final
demand by households and government, capital investment, business inventories,
marketing margins, and inflation factors (deflators). These data are provided both for the
440 producing sectors at the national level and for the corresponding sectors at the county
level. Data on the technological mix of inputs and levels of transactions between
producing sectors are taken from detailed input-output tables of the national economy.
National and county level data are the basis for IMPLAN calculations of input-output
tables and multipliers for local areas. The IMPLAN software package allows the
estimation of the multiplier effects of changes in final demand for one industry on all
other industries within a local economic area.
Fiscal Impacts
In addition to the economic impacts generated throughout the local market by Arena and
Team operations, the State of Ohio, Cuyahoga County and the City of Cleveland capture
higher taxes from ticket sales, merchandise and food and beverages sold at the Arena and
surrounding establishment, personal income taxes paid by Arena and Team employees,
business income taxes collected from the Arena, Team and surrounding business owners
and other such tax revenue streams. In preparing estimates of fiscal impacts, total tax
revenues attributable to the direct, indirect and induced spending were examined. Tax
revenues examined and estimated herein include state sales tax, City and County hotel
taxes, City and State personal income taxes, State corporate income taxes, City parking
and admissions taxes and County personal property taxes. Other taxes may apply, but
have not been included in this report.
14III. Economic and Fiscal Methodology
Direct tax impacts were calculated using the statutory tax rates and bases presented in the
following table.
Statutory Tax Rates and Bases
Tax Rate Rate Applied To:
Ohio State Taxes
Taxable direct spending by Arena patrons taking
place inside and outside of the Arena; taxable
Sales 5.50% - 6.00% (1)
indirect spending generated by Arena and Team
operations
Salaries of Cavaliers players and staff; personal
Personal Income 3.96%
earnings generated by presence of Arena and Team
Total output generated by presence of Arena and
Corporate Income 0.20% - 0.36% (2)
Team
Cuyahoga County Taxes
Taxable direct spending by Arena patrons taking
(3) place inside and outside of the Arena; taxable
County Sales 1.00% - 1.25%
indirect spending generated by Arena and Team
operations
Taxable direct spending by Arena patrons taking
place inside and outside of the Arena; taxable
RTA Sales 1.00%
indirect spending generated by Arena and Team
operations
Taxable lodging expenditures made by Arena patrons
Hotel 4.50%
in Cuyahoga County
Personal Property 0.00% - 8.00% (4) Estimated value of taxable Arena and Team property
City of Cleveland Taxes
Taxable lodging expenditures made by Arena patrons
Hotel 3.00%
in the City of Cleveland
Salaries of Cavaliers players and staff; personal
Personal Income 2.00%
earnings generated by presence of Arena and Team
Admissions 8.00% Gate receipts revenue generated by Arena events
Estimated parking expenditures made by Arena
Parking 3.00%
patrons
(1) State tax rate increased from 5.5% to 6.0% from 7/1/03 through 6/30/05, after which it returned to 5.5%. On 9/1/13, the tax rate increased from 5.5% to 5.75%.
(2) Estimated effective tax rate based on historical collections. Rate has varied from year to year due to changes in corporate tax laws.
(3) County sales tax rate increased from 1.0% to 1.25% effective 10/1/07.
(4) Rates for 2001 through 2005 imputed based on State-wide tax base and tax collections. Prior years estimated based on average rate
from 2001-05. Tax was being phased out between 2006 and 2009, so the imputed rate is decreased over that period.
15IV. Quantitative Economic and Fiscal Impacts
The operations of Quicken Loans Arena and the Cleveland Cavaliers provide quantifiable
benefits to Cuyahoga County and the City of Cleveland. Typically, and for the purposes
of this report, quantifiable effects are characterized in terms of economic impacts and
fiscal impacts. Economic impacts are conveyed through measures of direct spending,
total output, employment and personal earnings. Fiscal impacts denote changes in tax
revenues. A summary of the quantified economic and fiscal impacts generated by the
Arena and Team is presented in the following section of the report.
The construction phase of the Arena from 1992
to 1994 represents a significant one-time impact
on the local economy. Typically, construction
impacts are based on the volume and nature of
the construction expenditures. Direct spending
on construction typically consists primarily of a
large number of purchases of materials and labor.
Since these large purchases tend to take place in
a relatively short timeframe, a distinct and visible
impact on the community is typically created
during construction phases. This construction
period impacts are included in the estimated
economic impacts presented herein.
In addition to the one-time impacts related to facility construction, the operations of the
Arena and Team create annually recurring benefits in the local economy. Annual
operating period impacts are often significant, as these impacts represent a permanent
change in the economy.
The economic and fiscal impact estimates are presented in two stages of Arena and Team
history, as follows:
• 1990 through 1993 – Impacts generated in Cuyahoga County as a result of
Cavaliers operations during the Team’s final four years playing home games at
the Richfield Coliseum. These impacts were generally limited, as Richfield is
located outside of Cuyahoga County.
• 1994 through 2013 – Impacts generated as a result of Arena and Team operations
during the Team’s first 20 years at Quicken Loans Arena.
16IV. Quantitative Economic and Fiscal Impacts
The table below illustrates the estimated historical and future economic and fiscal
impacts generated by the operations of the Arena and the Cavaliers. The estimated
impacts are presented in both actual year and 2013 dollars. In addition, the annualized
impacts occurring during each of the two periods is presented in 2013 dollars, allowing
for comparisons among each period excluding the effects of inflation.
Adjusted Economic and Fiscal Impact Summary
Quicken Loans Arena and the Cleveland Cavaliers
($ Millions)
Direct Total Personal Tax
(1) (2) (3)
Spending Output Jobs Earnings Revenue
Annual:
2013 Estimates $136 $215 2,200 $110 $26
Cumulative - Actual Year Dollars
1990 to 1993 (estimated) $36 $58 200 $34 $6
1994 to 2013 (estimated) $2,017 $3,177 2,100 $1,601 $371
Total Impacts 1990-2013 $2,053 $3,235 n/a $1,635 $377
Cumulative - 2013 Dollars (4)
1990 to 1993 (estimated) $58 $93 200 $54 $9
1994 to 2013 (estimated) $2,406 $3,789 2,100 $1,906 $437
Total Impacts 1990-2013 $2,464 $3,883 n/a $1,960 $447
(4)
Annualized - 2013 Dollars
1990 to 1993 (estimated) $14 $23 200 $13 $2
1994 to 2013 (estimated) $120 $189 2,100 $95 $22
(1) Includes direct spending, as well as indirect and induced spending that occurs as money is re-spent in the local economy. Because total output includes direct spending, the
direct spending and total output numbers should not be considered additive.
(2) Represents the average jobs supported per year during each of the time periods analyzed.
(3) Personal earnings generated by the economic activity associated with arena and team operations. Should not be considered additive with direct spending or total output.
(4) Estimates for years prior to 2013 were inflated to 2013 dollars based on the change in CPI in the Cleveland market.
As shown, it is estimated that the Arena and Team generated approximately $136 million
in direct spending in Cuyahoga County in 2013. This level of spending was estimated to
produce approximately $215 million in total output, support 2,200 full and part-time jobs
that create approximately $110 million in personal earnings, and generate approximately
$26 million in State and local tax revenues.
17IV. Quantitative Economic and Fiscal Impacts
It should be noted that the economic impact estimates presented in the previous table and
throughout the remainder of this report have not been adjusted to account for spending
related to the Arena and Team that would have taken place in Cuyahoga County if the
Arena and Team did not exist. It is likely that a portion of the expenditures made by
Arena patrons would be made on other entertainment options or products if they were not
spent on Arena-related activities, and a portion of this spending would likely occur within
Cuyahoga County. Similarly, a portion of the corporate spending related to the Arena
and Team would likely still have been spent locally if the Arena and Team did not exist.
For example, a corporation may purchase a suite at another local sports venue or allocate
advertising dollars toward another medium in the market.
Based on factors such as the percentage of Arena patrons who reside in the County, the
number of local versus non-local corporate partners of the Arena and Team, it is
estimated that approximately 25 to 30 percent of the direct spending associated with
Arena and Team operations would take place locally regardless of the presence of the
Arena and Team. Therefore, the “Net New” spending and impacts, defined as those
impacts attributable solely to the presence of the Arena and Team, are estimated to be
approximately 70 to 75 percent of the impacts presented herein.
The annual and cumulative direct spending, total output, wage earnings, number of
jobs created and the fiscal impacts generated by the Arena and Team over the first 20
years of Arena operations, from 1994 to 2013. All estimates are presented in 2013
dollars:
• $2.4 billion - cumulative Direct Spending
• $3.8 billion - cumulative Total Output
• 2,100 - approximate average of Full and Part-time Jobs per year that the
Arena operations is estimated to support
• $1.9 billion- cumulative Personal Income generated by jobs supported
• $437 million- cumulative state and local Tax Revenues
18IV. Quantitative Economic and Fiscal Impacts
The following table presents additional detail related to the fiscal impacts estimated to be
generated by Arena and Team operations, including the tax revenues collected by the
State of Ohio, Cuyahoga County and the City of Cleveland.
Estimated Fiscal Impacts by Jurisdiction
(in Thousands of 2013 Dollars)
Cumulative Annualized
1990-1993 1994-2013 1990-1993 1994-2013
City of Cleveland
Hotel $0 $184 $0 $9
Personal Income 0 58,705 0 2,935
Parking 0 4,229 0 211
Admissions 0 105,175 0 5,259
Subtotal $0 $168,293 $0 $8,415
Cuyahoga County
Sales $404 $19,025 $101 $951
RTA Sales 404 17,498 101 875
Hotel 29 793 7 40
Personal Property 725 2,108 181 105
Subtotal $1,563 $39,424 $391 $1,971
State of Ohio
Sales $2,223 $97,317 $556 $4,866
Personal Income 5,497 122,502 1,374 6,125
Corporate Income 202 9,852 50 493
Subtotal $7,922 $229,672 $1,980 $11,484
Total Tax Revenues $9,485 $437,389 $2,371 $21,869
As shown, the State has been the largest benefactor of taxes generated as a result of
Arena and Team operations, with cumulative collections from 1994 through 2013
estimated to total approximately $230 million, stated in 2013 dollars.
The City of Cleveland has also collected significant tax revenues since the opening of the
Arena, due primarily to personal income and admissions taxes. Cuyahoga County has
collected significantly lower tax revenues than the City and State, with general and RTA
sales taxes comprising the County’s primary sources of fiscal impacts.
19V. CSL Credentials
A sports venue and its franchises create direct and indirect economic benefits in the
geographical area in which it is located. As previously described, many of those benefits
are explicit, and their impact can be accurately estimated. In addition to these benefits,
there are certain non-quantifiable benefits that must be considered in a review of the
economic benefits derived from a sports venue and its franchises.
The presence of Quicken Loans Arena and the Cleveland Cavaliers has benefited many
community groups and non-profit organizations throughout the greater Cleveland area.
Since its inception, the Cavalier organization's charitable arm, now called the Cavaliers
Youth Fund, has made grants totaling over $22.5 million back to deserving non-profits
and charitable groups. In addition, the Cavaliers have provided more than $18 million
in community gifts and contributions for a number of non-profit organizations,
including Flashes of Hope, the United Way of Greater Cleveland and Habitat for
Humanity. With over $40 million in community, civic and charitable giving, combined
with the financial and personal contributions by Quicken Loans Arena, Cavaliers
players, coaches and staff, a wide range of local non-profit organizations and charities
have been positively impacted.
Current charitable, non-profit and community activities supported by the Cavaliers
include:
• 6th Man employee volunteer program
• All-Star Kids & Head of the Class student and teacher recognition programs
• Awareness Nights (in-game)
• Black Heritage Celebration and Scholarship Program
• Cavaliers/FirstMerit Scholarship Program
• Cavaliers Holiday Toy Drive
• Cavaliers Youth Fund, a fund of the Cleveland Foundation
• Eco-Maniacs and Green Week
• Fit As A Pro youth health initiative
• Harvest for Hunger Food & Funds Drive
• Holiday Hospital Visit
• Legacy Projects (court refurbishments, family rooms at the Cleveland Clinic
Children’s Rehab Hospital and Ronald McDonald House of Greater Cleveland)
• Merchandise donations for schools and non-profit fundraisers
• NBA Math Hoops
• National Basketball Academy summer camps and clinics
• Player ticket program (players purchase and donate tickets and food vouchers to
non-profit organizations)
• Read to Achieve youth education initiative
• Reading & Learning Centers
• Season of Giving
• Straight “A” All-Stars youth education initiative
20V. CSL Credentials
• Thanksgiving dinner at The Q for local families in need
• Wheelchair Cavaliers and Jr. Wheelchair Cavaliers
In addition to team-wide initiatives, players and coaches also host a number of their
own events with support from the team, including Thanksgiving dinner giveaways,
holiday shopping sprees and special outings for children in need.
The summary of charitable efforts and similar activities provided herein is not an
exhaustive list and represents only a portion of the community-oriented activities
undertaken by the Arena and Team. In addition to those listed, there are numerous other
local charities and community activities supported by the teams’ foundations, individual
players, coaches and Arena staff.
21V. CSL Credentials
Conventions, Sports, & Leisure International is an industry-leading advisory firm
specializing in the analysis of the development and operations of sports, convention,
amusement, entertainment and leisure facilities. CSL was specifically established to
provide focused consulting services unique to these industries. As such, CSL has gained
a reputation for providing our clients with professional, thorough and timely hands-on
consulting services. One of the primary strengths of CSL is our experience. The CSL
team brings to each project a perspective gained through more than 120 years of
collective experience in consulting, participating in more than 500 projects.
We assist our clients from the earliest stages of project planning, ensuring that all
decisions are informed ones. Our consultants provide in-depth information, creative
solutions to underlying issues, a thorough analysis of financial implications, and various
measurements of risk and return surrounding alternative courses of action.
CSL has assisted numerous public bodies and private sector clients with the analysis of
the benefits associated with facilities similar to Quicken Loans Arena. Specifically, CSL
has assisted clients in evaluating the impact of the following selected franchises or facilities:
• Arizona Cardinals / University of Phoenix Stadium
• Carolina Panthers / Bank of America Stadium
• Dallas Cowboys / Texas Stadium
• Dallas Mavericks / American Airlines Center
• DC Baseball Team / New Stadium
• Detroit Lions / Ford Field
• FC Dallas / Pizza Hut Park
• Florida Marlins / New Stadium
• Green Bay Packers / Renovated Lambeau Field
• Houston Rockets / Toyota Center
• Houston Texans / Reliant Park
• New York Giants / New Stadium
• New York Islanders / Nassau Coliseum
• New York Mets / Citi Field
• NY/NJ Metrostars / New Stadium
• Orlando Magic / New Arena
• Philadelphia Eagles / Veterans Stadium
• San Antonio Spurs / AT&T Center
• San Francisco 49ers / New Stadium
• Texas Rangers / Rangers Ballpark in Arlington
CSL maintains offices in Dallas and Minneapolis. For more information regarding the
services provided by CSL or questions about the study, please contact Bill Rhoda at (972)
491-6900.
22You can also read