Regional Competitiveness in Latin America: A Comparative Study of the Key Elements for Regional Performance - Investigaciones ...
←
→
Page content transcription
If your browser does not render page correctly, please read the page content below
ISSN: 1695-7253          e-ISSN: 2340-2717
                                    investig.regionales@aecr.org
                           AECR - Asociación Española de Ciencia Regional
                                           www.aecr.org
                                          España – Spain

Regional Competitiveness in Latin
America: A Comparative Study of the Key
Elements for Regional Performance
 Sergio González Catalán
 Regional Competitiveness in Latin America: A Comparative Study of the Key Elements for
 Regional Performance
 Investigaciones Regionales – Journal of Regional Research, 50, 2021/02
 Asociación Española de Ciencia Regional, España

 Available on the website: https://investigacionesregionales.org/numeros-y-articulos/consulta-de-
 articulos

 Additional information:

 To cite this article: González, S. (2021). Regional Competitiveness in Latin America: A Comparative
 Study of the Key Elements for Regional Performance. Investigaciones Regionales – Journal of Regional
 Research 2021/2(50), 125-146. https://doi.org/10.38191/iirr-jorr.21.014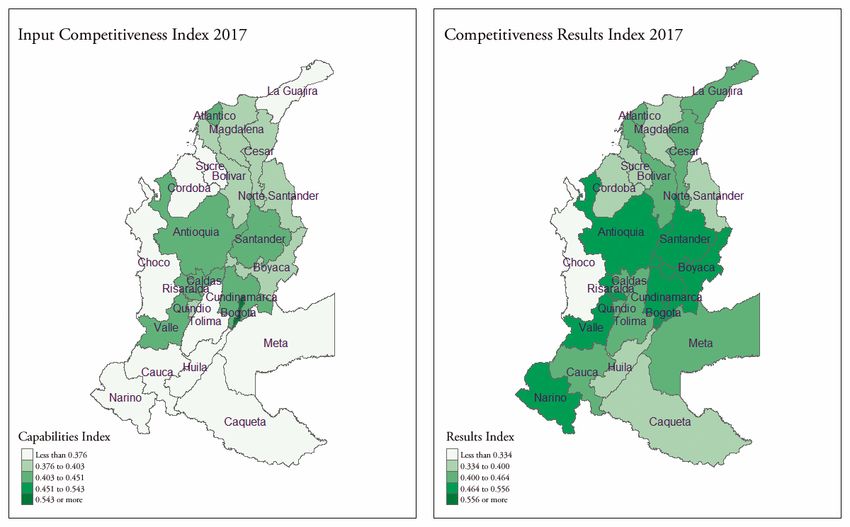
Investigaciones Regionales – Journal of Regional Research (2021/2) 50: 125-146
https://doi.org/10.38191/iirr-jorr.21.014

                                                                                                                   Articles

Regional Competitiveness in Latin America: A Comparative Study
of the Key Elements for Regional Performance

Sergio González Catalán*

                                                                                         Received: 27 February 2020
                                                                                         Accepted: 03 May 2021

Abstract:
Cross-country comparison is critical to understand the success of some regions and the stagnation of others
in Latin America. This study measures regional competitiveness using a set of comparable regional
indicators for Chile, Colombia, and Mexico in the 2008-2017 period and through a model that separates
input competitiveness from results competitiveness (Aiginger and Firgo, 2017). The measurement allows
comparison of regional competitiveness across countries. Results show that high regions with higher input
competitiveness yield higher progress in competitiveness results for the studied period and that
competitiveness capabilities play a major role in population well-being.
Keywords: Regional competitiveness; Latin America; regional performance.
JEL Classification: R11.

Competitividad Regional en América Latina: Un Estudio Comparativo de los
Elementos Clave para el Desempeño Regional

Resumen:
La comparación entre países es fundamental para comprender el éxito de algunas regiones y el
estancamiento de otras en América Latina. Este estudio mide la competitividad regional utilizando un
conjunto de indicadores regionales comparables para Chile, Colombia, y México en el período 2008-2017
y a través de un modelo que separa la capacidad competitividad del resultado competitivo (Aiginger y
Firgo, 2017). La medición permite comparar la competitividad regional entre países. Los resultados
muestran que las regiones con mayor competitividad de inputs presentan un mayor avance en la
competitividad de resultados para el período estudiado y que las capacidades competitivas de una región
juegan un rol clave en el bienestar de su población.
Palabras clave: Competitividad regional; América Latina; desempeño regional.
Clasificación JEL: R11.

1.     Introduction: Latin America and regional inequalities

      Latin America has a wide variety and diversity of regions, some of them have been successful and
have shown advancements in their regional performance indicators, while others are still lagging (ECLAC,
2015; ECLAC, 2017). In general, successful Latin-American regions are the ones that allocate an
important city (usually capital city) or the ones that have based their economic development on the
extraction of natural resources (ECLAC, 2015). The prevailing factors determining regional performance

* Universidad Camilo José Cela. Escuela Internacional de Doctorado. Programa de Doctorado en Ciencias Económicas y Jurídicas.
Corresponding author: sgcatalan@gmail.com

Investigaciones Regionales – Journal of Regional Research, 50 (2021/2), 125-146        ISSN: 1695-7253 e-ISSN: 2340-2717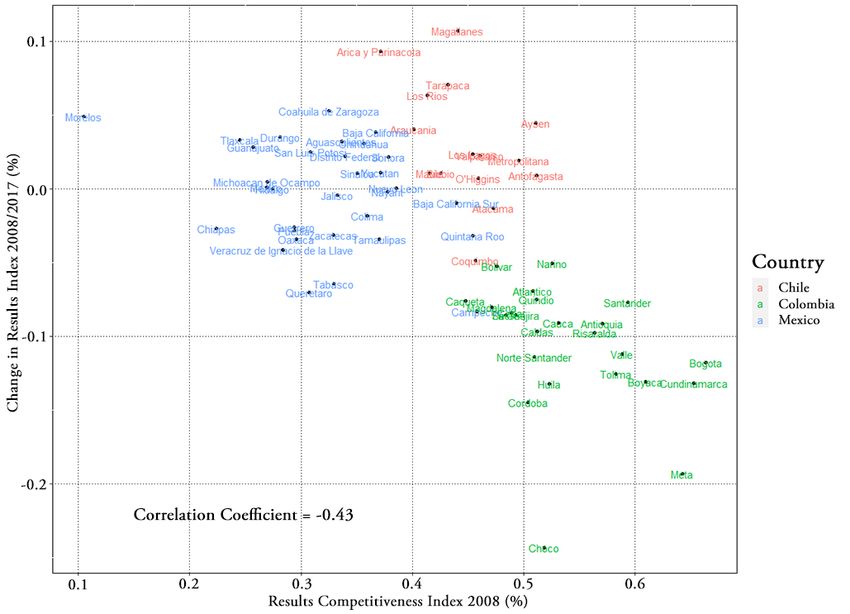
126   González, S.

in Latin America are not as clear as in comparative studies for regions within the European Union (EU),
which identify factors such as basic education and improving institutions for middle-developed regions
and innovation factors for developed regions (Annoni & Dijkstra, 2017). Innovation has been widely
discussed as a competitiveness factor for Latin American regions, but there is little evidence of its relative
importance compared to other competitiveness factors. Similarly, Aiginger & Firgo (2017) identify
education and innovation, and high institutional quality factors as solid drivers of regional competitiveness
in the EU.
      According to Figueroa (2013), in the 1950s, social scientists believed that the main reason for
underdevelopment in Latin American countries was the economic dependency they had with developed
economies, in what they called a center-periphery model. Since then, economic growth became the core
of development policy in Latin America, setting the basis for development policies in the second half of
the XX century. There is a consensus that Latin America has a productivity gap with developed economies
and that this is the main reason behind slow economic growth and not the lack of investment (Cornick,
2016; Fernandez-Arias & Rodriguez, 2016; OECD, 2019). Consequently, there is a renewed interest in
productivity growth policy and its role in promoting development in Latin American countries.
      Social indicators in Latin America improved, poverty was reduced from 45,5% in 2002 to 27,8% in
2014 (ECLAC, 2019). However, poverty increased to 30,8% in 2018. Inequalities measured by the Gini
index decreased from 0,538 in 2002 to 0,465 in 2018, but inequality reduction was much slower between
2014 and 2018.
      Despite having reduced poverty and income inequality, economic growth in Latin America has not
been enough to converge to well-being levels of developed economies (OECD, 2019).
      Convergence implies closing productivity gaps between Latin American countries and the developed
economies, but also closing structural inequalities within the countries (ECLAC, 2010). Regional
inequalities determine the level of potential wellbeing in a certain location, that is why their reduction is
crucial for development in Latin America (ILPES, 2009; ECLAC, 2010).
      According to 2017 data from the United Nations Economic Commission for Latin America and the
Caribbean demographic and economic concentration in are relatively high compared to OECD
economies, with one region concentrating most of the population or GDP. The Metropolitan region in
Chile concentrated 46% of the country´s GDP and 42% of the population, the City and State of Mexico
concentrated 26,2 % of Mexico´s GDP and 21 % of the population, while Bogota and Cundinamarca
concentrated 30,8 % of Colombia´s GDP and 23% of the population (ECLAC, 2017). The high levels
of demographic and economic concentration have been accompanied by high regional inequalities
measured through regional GDP per capita differences. Regional inequalities are higher in Latin American
countries such as Chile, Colombia, Mexico, Peru, Brazil, and Panama, compared to OECD economies
such as the United Sates and Spain. However, despite having high regional inequalities, Chile, Colombia,
Mexico, Peru, and Brazil had a convergence trend between 2000 and 2010. For a comprehensive review
of regional inequalities in Latin America see Llungo (2018).

2.     Regional competitiveness: concepts and applications

2.1. Competitiveness: From the National Level to the Regional Level

      Competitiveness is a widely used term, several researchers agree that there is no clear definition and
interpretation of competitiveness to this date (Borozan & Strossmayer, 2008; Aiginger & Firgo, 2017;
Ketels, 2016; Huggins & Thompson, 2017; Annoni & Dijkstra, 2017).
      Michael Porter formally addressed the definition of competitiveness in the 1980s, taking basis on
the concepts of absolute and comparative advantages to explain the economic performance of companies
and firms. Porter (1985, 1990), introduces the concept of ¨competitive advantage¨, which is the one
created and sustained locally and that allows a country to have an advantage in certain industries where
the environment, institutions and competition are favorable to them.

Investigaciones Regionales – Journal of Regional Research, 50 (2021/2), 125-146   ISSN: 1695-7253 e-ISSN: 2340-2717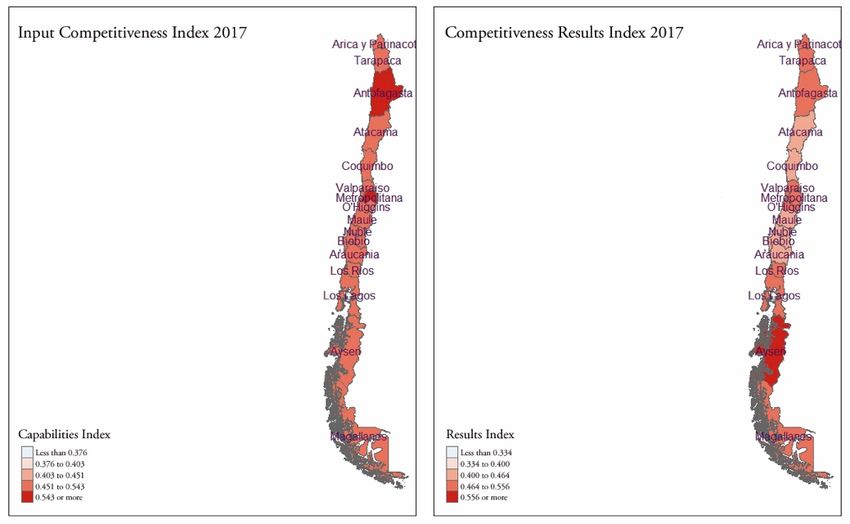
Regional Competitiveness in Latin America: A Comparative Study of the Key Elements for Regional Performance   127

      Krugman (1994) questions the very existence and use of the concept of country competitiveness.
He argues that countries do not compete in the same way companies do, since their objectives and the
very nature of competition are different. Krugman points to the fact that noncompetitive firms are not
sustainable and eventually go out of business, but countries that have a poor economic performance do
not go out of business. However, Porter (1990; 2003) and Krugman (1994) both agree that productivity
ultimately defines the capacity of a nation to generate a high and rising standard of living for its citizens.
Krugman stablishes that, in general, it is productivity and domestic factors, and not international trade,
what determines the level of wages and living standards of a country.
      Modern definitions of competitiveness implicitly distinguish the competitiveness of firms from
country competitiveness by recognizing a link between company performance and the capacity of a
country to produce wellbeing for its population. The World Economic Forum (WEF) defines country
competitiveness as the “set of institutions, policies and factors that determine a country’s level of productivity”
and recognizes that the goal is to improve human wellbeing (Schwab, 2017). For the IMD World
Competitiveness Center, country competitiveness is “ability of a nation to create and maintain an
environment that sustains more value creation for its enterprises and more prosperity for its people¨ (IMD,
2017).
       Porter (2003) acknowledges that much research on competitiveness has focused on the national
scale, without recognizing the internal differences between regions, which exist in all countries. He suggests
that the major components that determine economic performance are regional components, such as
specialized inputs, infrastructure, education of the labor force, institutions which will encourage
agglomeration of firms in the form of clusters.

2.2. Regional competitiveness

      Storper (1997) defines regional competitiveness as the capability of a region to attract and maintain
firms with stable or rising market shares in an activity, while maintaining or increasing standards of living.
Aiginger (2006) defines competitiveness as “the ability of a country or location to create welfare”.
       Borozan and Strossmayer (2008) place the concept of regional competitiveness between
microeconomic and macroeconomic competitiveness. Micro-economic competitiveness refers to the
ability of a firm to compete in a market successfully. Macro-economic competitiveness refers to country
competitiveness and is link to the idea that the environment that enables firms and companies to compete
successfully.
      The concept of regional competitiveness is complex because it is not the aggregation of
microeconomic competitiveness nor of the productivity of the firms within the region (Borozan &
Strossmayer, 2008). This vision neglects to consider the factors outside the region, which are not
controllable, as well as spillovers and network effect. Additionally, companies and regions have different
goals, companies seek profitability or productive, while regions seek for higher living standards, better
jobs, or minimization of corruption. Regional competitiveness is also not a derivative of national
competitiveness, because of the differences between macro-economic factors and regional economic
factors. National competitiveness is also much more heterogeneous that regional competitiveness.
National governments have a wider range of macroeconomic adjustment mechanisms and much more
influence over public, private, and non-profit sectors than regional governments have.
      Competitiveness of companies and regional competitiveness are different concepts and relate to each
other in a non-linear manner. Company success does not always translate into regional or national success.
For instance, firms that search outside knowledge sources by externalizing services, as part of their strategy,
may facilitate knowledge-based investment or capabilities within their region, which will translate into
higher productivity for both the firm and the region (Huggins et al, 2014). This will increase
competitiveness for the firm and for the region, but it is not always the case. Through a case study in
Sweden, Osarenkhoe, A. & Fjellström, D. (2017) state that clusters and networks of SMEs are vital to
gain a competitive advantage and promote regional growth. However, the way that cluster interactions
occur is complex and the degree of cooperation within the cluster influences the overall competitiveness
(Jankowska et al, 2017).

Investigaciones Regionales – Journal of Regional Research, 50 (2021/2), 125-146    ISSN: 1695-7253 e-ISSN: 2340-2717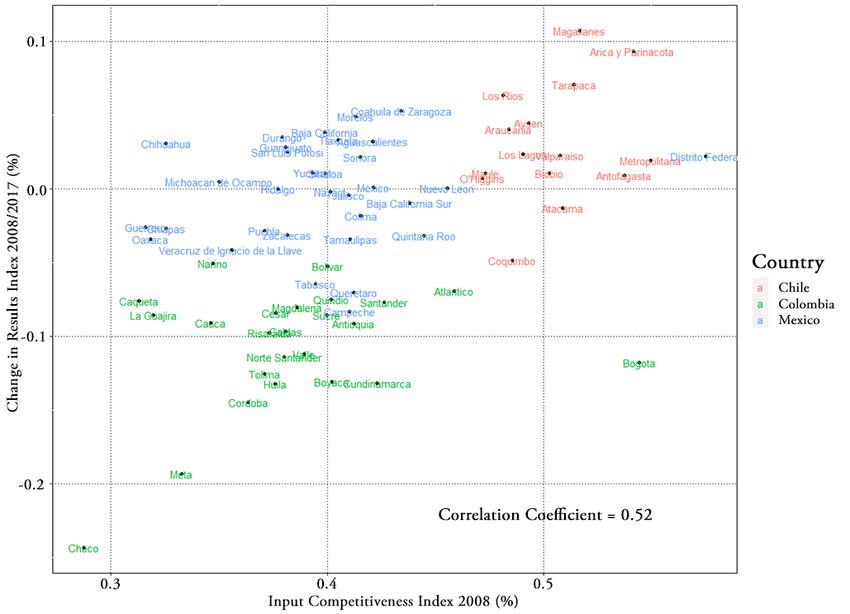
128   González, S.

      Boschma (2004) points out similarities between competitiveness of firms and regions. First, despite
that regions do not compete for market share as firms do, regions that economically grow faster will gain
a higher share of the national economic at the expense of slower growing regions. Secondly, regions that
specialize in similar sectors will compete in the attraction of work talent and investments. On the other
hand, one basic distinction is that companies enter or exit the market as they succeed or go bankrupt,
while regions do not go out of business or disappear. Companies also compete to attract work talent, but
the nature of regional goals is much more complex than the goals that companies have.
      Borozan, D. & Strossmayer (2008) and Aiginger & Vogel (2015) distinguish between input
competitiveness (costs, productivity, economic structure, and capabilities) and outcome competitiveness
(wellbeing). Malecki (2004), Aiginger & Vogel (2015), and Aiginger and Firgo (2017) consider a narrow
and an enlightened version of cost competitiveness. The narrow version of cost competitiveness is based
only on reduction of cost components such as taxes, wages, and energy, labor or raw materials costs. The
enlightened version of cost competitiveness incorporates productivity in addition to cost; if the costs are
higher, an economy can still be competitive by increasing productivity.
       Ketels (2016) distinguishes competitiveness definitions by those that are centered in costs and those
that are centered in productivity. Cost competitiveness depends on unit production costs in a specific
place; low unit production costs allow companies to be competitive in global markets. By contrast,
productivity competitiveness relies in the capacity of a place to add value based on production factors, in
other words how productive that place is. Productive factors, such as labor and capital, move between
regions and there are spillovers and synergies between regions, thus, the subnational economic structure
differs from the national economic structure. In other words, regions do not correspond to smaller versions
of national economies, because they are structurally different.
       According to Ibarra-Armenta & Trejo-Nieto (2014), competitive regions have high and sustained
levels of economic growth, along with high standards of wellbeing. In addition, competitive regions can
attract productive investment in a context of economic openness and globalization, allowing them to
achieve high levels of productivity.
       Contemporary views of regional competitiveness highlight the importance of increasing
productivity, but not at the expense of the population’s quality of life. For example, an increase in
productivity through the means of wage reduction will not increase people’s quality of life. Even though
it may generate a positive trade balance, it would not be sustainable in the long term (Huggins &
Thompson, 2017). Michael Peneder (2017) defines competitiveness as the “ability of an economic system
to develop” according to the goals of society, in a sustainable manner and allowing for long-term increase
in living standards. Malecki (2017) points out that the concept of regional competitiveness has value
when it focuses on the bases and dynamics of long-term wellbeing and not on restrictive views that only
focus on market share or resource competition.
      In summary, modern definitions of regional competitiveness have advanced from economic-
centered ideologies that prevailed in the 1980 and 1990s, towards a holistic concept that recognizes that
the goal of regional competitiveness is to increase wellbeing trough productivity. This feature is what
separates regional competitiveness from other purely economic definitions and from development
concepts that only focus on wellbeing, making it a comprehensive framework to address regional
performance differences.
      From a practical perspective, the regional competitiveness conceptual framework allows a broad
understanding of the differences in regional performance. Differences in regional performance have been
addressed by endogenous growth models (Romer, 1994), which place investments on human capital,
innovation and knowledge as key drivers of growth, in addition to the traditional factors of capital and
labor (Huggins, et al 2014; Huggins & Thompson, 2017b). According to Huggins & Thompson
(2017a), a major difference between endogenous growth models and competitiveness models is that
endogenous growth models seek to explain past growth. By contrast, competitiveness models are also
seeking to measure the potential for future growth, incorporating the explanatory factors adopted by
growth theorists such as labor, capital, technology or investment in human capital, as well as current rates

Investigaciones Regionales – Journal of Regional Research, 50 (2021/2), 125-146   ISSN: 1695-7253 e-ISSN: 2340-2717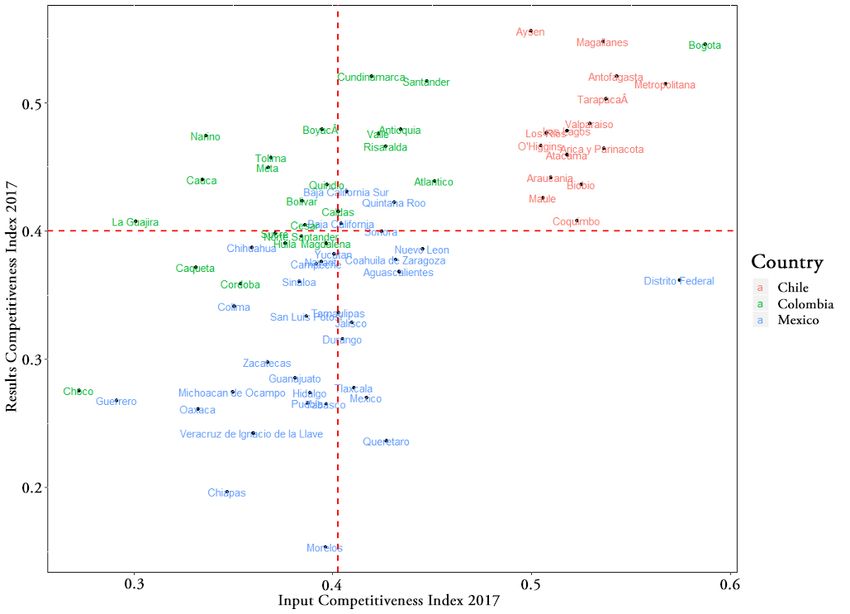
Regional Competitiveness in Latin America: A Comparative Study of the Key Elements for Regional Performance   129

of output and productivity. In other words, competitiveness models are implicitly based on endogenous
growth models.

2.3. The importance of regional competitiveness

       The advancement of free trade, globalization, and having a quick and efficient transport and
communication services would lead us to believe that location is less important. On the contrary, the place
of establishment of companies remains a very relevant variable. Competitive advantages develop from local
factors, such as knowledge, cooperation, competition, and concentration (Porter, 1998).
      Both Porter (1998) and Camagni (2003; 2005) recognize the local environment or milieu as a key
determinant of competitive advantages. The place of settlement or location will be an important factor in
determining a company’s performance at all geographical levels. The regional context will influence the
behavior and performance of companies and, consequently, will be relevant in determining their
competitiveness (Bochma, 2010). Regions compete, therefore, in providing the best platform to reach
high levels of productivity (Huggins & Thompson, 2017).
      Esser et al (1996) point out to the creation of a favorable environment in achieving competitiveness,
together with a collective effort from firms, associations, State and other stakeholders. The absence of a
favorable environment reduces the capacity of a company to sustainable achieve competitiveness.
      Local environment is determined by factors that arise from different scales or levels, for instance,
macroeconomic policy from the federal government as well as local institutions, public infrastructure, or
networks will influence the local environment. The systemic competitiveness model (Esser et al, 1996)
systematizes these factors in four different levels: Micro, Macro, Meso and Meta. The Micro level includes
factors linked to companies or firm networks such as human capital, business management, and business
strategies. The Meso level consists of environmental factors such as geography, location, security,
proximity to urban centers, and public infrastructure. The Macro level includes elements of the
macroeconomic context that influence the efficiency of markets and growth. The Meta level consists of
structural elements such as the political, economic, and legal organization, values, and cultural elements.
      Social capital, defined as norms and values that determine the relationships between people, will
favor competitiveness (Camagni, 2003). Malecki (2017) states that knowledge and innovation are the core
of regional competitiveness, as creativity and innovation occur only in some places. Global innovation
networks, which are the fundamental pillar of competitiveness, settle in places that are attractive to them.
Therefore, regional competitiveness is a dynamic process, constantly changing and adapting through the
learning process. Innovation capacity is dynamic, in the sense that it requires constant renewal, and
provides a relevant advantage for competitiveness compared to static aspects of production such as costs
or natural resource advantages (Fratesi, 2017).

2.4. Measuring regional competitiveness

      There are many approaches to measure regional competitiveness due to the diversity in interpretation
of current regional competitiveness conceptual frameworks (Annoni & Dijkstra, 2017).
      Although the functional form of regional competitiveness is unknown and its concepts are abstract
by nature, the competitiveness of two regions can be compared by measuring a set of competitiveness-
related indicators (CGE, 2018).
      A comprehensive definition of regional competitiveness is “the ability of a region to deliver beyond
GDP goals for its citizens today and tomorrow” (Aiginger et al, 2013; Aiginger and Vogel, 2015; Aiginger &
Firgo, 2017). Similarly, Annoni & Dijstra (2017) define regional competitiveness as the “ability to offer an
attractive and sustainable environment for firms and residents to live and work”. These definitions address
wellbeing and economic objectives and incorporate the idea of a regional environment that enables the
achievement of those objectives. Under these definitions, competitive regions have certain requirements
and characteristics, which listed below. For the purposes of this research, regional competitiveness is
defined as the ability of a region to sustainable deliver economic, social and environmental goals to its

Investigaciones Regionales – Journal of Regional Research, 50 (2021/2), 125-146    ISSN: 1695-7253 e-ISSN: 2340-2717
130   González, S.

citizens and workers (Aiginger et al, 2013; Aiginger & Vogel, 2015; Aiginger & Firgo, 2017, Annoni &
Dijkstra, 2017).
      The first characteristic is the idea that the region offers an environment for companies to achieve a
certain level of performance. In other words, competitive regions offer an environment that boosts
company productivity.
      Secondly, sustainability is a requirement for competitiveness, in the sense that it allows sustained
high performance for the companies. This implies that the setting cannot be composed of short-term
factors or time-specific conditions.
      Third, a competitive region needs to offer attractive conditions for both companies and residents;
the region needs to be attractive so that workers will live in that region. Regions in Latin America
specialized in the mining sector, are often considered competitive only because of company performance
and without considering any aspects of the resident’s wellbeing. Some of these regions offer a good
environment for mining companies to have a high performance, but many workers travel from other
regions and have no interest in residing within the region, because they get better services in other regions.
These types of regions are not competitive under the definition stated before.
      Forth, this definition implies that competitive regions need to offer certain conditions that attract
companies and people, which can allow a high productivity for companies and a high level of wellbeing
for people, but also that they need to show positive results in both of these factors. This last characteristic
implies that competitiveness features both certain conditions (environment) that will allow a potential
outcome, as well as the actual outcome (productivity and wellbeing). Wellbeing involves economic, social,
and environmental results.
       Finally, the goal of regional competitiveness is to increase wellbeing, which can be achieved by
increasing productivity (Porter, 1990; Krugman, 1994; Peneder, 2017). The concept of regional
competitiveness is strictly related to productive capacity acquired from being on those regions and how
this increased production allows or a higher regional performance. This feature is what separates regional
competitiveness from other purely economic definitions and from development concepts that only focus
on wellbeing.

2.5. Regional competitiveness measurement in Latin America and
     cross-country comparison

      There are several measurements of regional competitiveness in Latin America. Table 1 summarizes
available regional competitiveness measurements for Argentina, Colombia, Chile, Mexico, and Peru. One
of the characteristics of competitiveness measurements in Latin America is the fact that most countries
have more than one institution measuring it simultaneously. These measurements rank regions within
the country. However, no research compares regional competitiveness between countries in Latin
America. A comparative analysis of regional competitiveness measurements would allow establishing
common factors that arise from different research and competitiveness indexes.
       A major problem of comparing regions in Latin America is the availability of comparable indicators,
as few of them are constructed using similar sources and methodology. Additionally, the variability in the
size of administrative regions is enormous; there are regions in Latin America, such as Sao Paulo, Rio de
Janeiro or Mexico’s Federal District that have larger populations than entire countries (ECLAC, 2015).
Furthermore, when comparing different countries there are a number of factors such as institutional set-
ups, patterns of trade and innovation, industrial specialization, cultural factors, that differ between
countries and regions, and that may be a distorting factor when comparing performance (Smith, 2001).
To reduce this problem, best practice would be to use different performance measures, instead of a single
indicator or measure.
      Considering source and methodology consistency in Latin America, only few indicators are
comparable, these include indicators that come from population census, household surveys, employment
surveys, and national accounts. These indicators are usually constructed by National Statistics Institutes

Investigaciones Regionales – Journal of Regional Research, 50 (2021/2), 125-146   ISSN: 1695-7253 e-ISSN: 2340-2717
Regional Competitiveness in Latin America: A Comparative Study of the Key Elements for Regional Performance 131
or Central Banks in each country, which use the same standards and methodologies. All these institutions
follow international standardization methods and rely on similar sources (Buitelaar et al, 2015).
Cross-country comparison is critical to understand the success of some regions and the stagnation
of others. Regions compete for foreign investment and companies within regions compete for product
placement in international markets. In example, regions compete to attract foreign investments from
high-tech companies. Several tech companies have announced recently the installation of data centers in
Latin America. However, companies do not evaluate random locations, the look at regions such as the
Metropolitan region in Chile, the Province of Buenos Aires in Argentina, Sao Paulo and Rio de Janeiro in
Brazil, or the Federal District in Mexico, all of which provide the necessary telecommunication
infrastructure, connectivity, and skilled workers.
Likewise, regions and their clusters compete in international markets, with others country’s regions
and clusters. For example, table grapes produced the Copiapó valley from Atacama region, Chile compete
with table grapes produced in the Ica valley (Peru) in the United States markets. This type of regional
competition takes place between countries, it is not limited to in-country competition. As a result,
understanding regional competitiveness requires an international approach that compares regions between
countries.
3. Methodology and data
Figure 1 shows the regional competitiveness model which distinguishes competitiveness inputs from
competitiveness results (Aiginger & Firgo, 2017; Huggins & Thompson, 2017).
Inputs are those elements that allow for an attractive and sustainable environment for firms and
residents and that constitute a potential capacity of yielding a result. Inputs are factors that allow the
region to provide attractiveness for both people and companies to settle in. There are two types of inputs.
The first type of inputs are those that lead to low road competitiveness: cost and efficiency (Aiginger et al,
2013; Aiginger & Vogel, 2015, Malecki, 2017). The second type of inputs are complex factors that lead
to high road competitiveness (Aiginger & Vogel, 2015; Malecki, 2017). These types of elements are
related to the economic structure of the region and its capacities, including physical characteristics of the
region as well as the social grid, institutions, networks, innovation and clusters (Aiginger & Firgo, 2017;
Huggins & Thompson, 2017).
The result components are actual levels of performance and wellbeing that the region achieves.
Following a comprehensive definition, the result is the economic, social, and environmental performance
of the region.
Competitiveness is measured for 3 countries: Chile, Colombia and Mexico. These countries show
similar levels of competitiveness scores in the World Economic Forum´s Global Competitiveness Report
(Schwab, 2018), and they have enough data to measure regional competitiveness. Mexico and Chile are
the only two OECD countries in Latin America and Colombia is likely to be soon incorporated into the
OECD economies.
The data sources and variables are presented in table 2. Dataset includes 32 variables for 15 regions
in Chile, 32 regions in Mexico and 33 regions in Colombia for year 2008 and year 2017. Variables are
normalized using the “min-max” scaling method using historical minimum and maximus for all regions
and years to consider the evolution in the indicators across time (OECD, 2008).
Following OECD (2008) recommendations for composite indicators, variables used to measure
regional competitiveness are weighed using Principal Components Analysis (PCA) for each factor.
Principal Components Analysis (PCA) is used to give higher weight to those variables that explain most
of the variance of the dataset. Additionally, PCA allows to identify hidden patterns in the dataset and
which variables are correlated (Kassambara, 2017).
Out of the 32 regions from Colombia, 9 lack the information to be processed through PCA
(Amazonas, Arauca, Casanare, Guainía, Guaviare, Putumayo, San Andres y Providencia, Vaupes, and
Vichada). Results are presented for 71 regions.
Investigaciones Regionales – Journal of Regional Research, 50 (2021/2), 125-146 ISSN: 1695-7253 e-ISSN: 2340-2717132 González, S.
Inputs (or capabilities) competitiveness is measured trough the following factors: cost and efficiency,
regional structure, economic structure, innovation and education, health and social system, and
institutions. Inputs (or capabilities) competitiveness is measured trough the average of the six factors
(equation 1). No regional variables that were comparable between countries were identified for
sustainability and environment factors.
Results competitiveness is measured trough the geometric mean of social, economic, and
environmental results factors presented in equation 2. Since environmental, social, and economic factors
are necessary and equally important to achieve a competitiveness results, the geometric mean is used to
account and give the same importance to all factors. Additionally, it allows to overcome the possibility of
compensation of one factor for the other. If one of the factors drifts to 0 then the overall index will drift
to 0. This differs from the arithmetic mean, which allows to compensate the average value when one of
the components leans to 0 by increasing the values of the other components. Variables that compose each
factor are presented in table 2.
" " " " " "
!"#$% !"'()! = # +,,! + # !",./0! + # +1 2%.$1%! + # +'$1! + # 3(/4%ℎ! + # !"0%6%! (1)
Where:
Input Index = Inputs/capabilities competitiveness index for region i.
Eff = Efficiency and cost factor.
Infras = Regional infrastructure factor.
Ec Struct = Economic structure factor.
Educ = Innovation and education factor.
Health = Health and social system factor.
Instit = Institutions factor.
J(0$4%0 !"'()! = !K+1L"LM61! ∗ 2L16/4! ∗ +"O6.LM("%/4! (2)
Where:
Results Index = Results Competitiveness Index for region i.
Economic = Economic results component.
Social = Social results component.
Environmental = Environmental results component.
To test for consistency in the rankings and results, the Input Competitiveness Index was contrasted
with calculations giving each variable within each factor the same weight. Similarly, Results
Competitiveness Index was calculated using arithmetic means. Convergence trends for Results
Competitiveness are observed following Royuela, & García (2015), who test convergence not only for
economic variables but also for social variables in Colombian regions.
Investigaciones Regionales – Journal of Regional Research, 50 (2021/2), 125-146 ISSN: 1695-7253 e-ISSN: 2340-2717Regional Competitiveness in Latin America: A Comparative Study of the Key Elements for Regional Performance 133
TABLE 1.
Competitiveness indexes in Latin America: supporting theories and scope
Scale/number of
Country Index Name Author/Institution Supporting Theory Time frame
regions
24 regions (23
Índice de Regional competitiveness is the "Capacity or potential of
Bolsa de Comercio de Provincias and
Argentina Competitividad the economic system of a certain region to achieve higher 2007-2012
Córdoba (2012) Ciudad Autónoma
Provincial levels of per capita income in a sustained manner".
de Buenos Aires)
The index is based on an implicit definition of
competitiveness that gathers structures, dynamics and
achievements of a region that link economic growth,
Escalafón de CEPAL (Ramírez & De innovation, connectivity, the welfare of its population and
Colombia 2000-2017 32 departments
competitivdad Aguas, 2017) the governance of the territory. This definition is part of a
multidimensional vision, beyond GDP (Krugman, 1994),
and provides a panoramic and comprehensive view of the
relative development of each department.
Complete index for
Indice de Consejo privado de Bogota and 26
Based on the competitiveness definition from the World
Competitivdad Competitividad & departmentos.
Colombia Economic Forum: “set of institutions, policies and factors that 2013-2018 (6 versions)
departamental Universidad del Rosario Summarized index
determine a country’s level of productivity” (Schwab, 2017).
(IDC) (2018) for 32
departamentos.
El Instituto Chileno de
Índice de Measures regional development using a multidimensional
Estudios Municipales de
Desarrollo perspective, similar to the Human Development Index
Chile la Universidad 2016-2017 (2 versions) 15 regions
Regional - (HDI) from the United Nations Development Program
Autónoma de Chile
IDERE (UNDP).
(2017)
Centro de Estudios en
Índice de
Economía y Negocios de It is a measure of the competitive capacity of regions and
Competitividad
Chile la Universidad del accounts for the factors that enable systematically higher 1999-2015 (12 versions) 15 regions
Regional-
Desarrollo (Echeverria levels of productivity compared to other regions.
ICORE
& Arce, 2015)
Source: Own elaboration.
Investigaciones Regionales – Journal of Regional Research, 50 (2021/2), 125-146 ISSN: 1695-7253 e-ISSN: 2340-2717134 González, S.
TABLE 1. CONT.
Competitiveness indexes in Latin America: supporting theories and scope
Scale/number of
Country Index Name Author/Institution Supporting Theory Time frame
regions
Competitiveness is defined as the capacity of cities, states,
Indice de Instituto Mexicano para or countries to generate, attract, and retain talent and
32 regions
Mexico Competitividad la Competitividad – investments. Both talent and investment tend to allocate in 2006 - 2018 (7 versions)
(Estados)
Estatal IMCO (2018) places that offer higher economic and social returns
(IMCO, 2018).
Based on the competitiveness definition from the World
Índice de
Consejo Nacional de Economic Forum: “set of institutions, policies and factors 2007/2008 - 2013/14 (7
Perú Competitividad 24 regions
Competitividad (2013) that determine a country’s level of productivity” (Schwab, versions)
Regional
2017).
25 regions
Índice de Based on the competitiveness definition from the World
(Includes Lima and
Competitividad Instituto Peruano de Economic Forum: “set of institutions, policies and factors
Perú 2018 (6 versions) Lima Provinces.
Regional Economía (2018) that determine a country’s level of productivity” (Schwab,
Callao province is
INCORE 2017).
included in Lima)
26 regions (Include
Índice de Regional competitiveness is defined as the management of
Universidad Católica del Lima
Perú Competitividad resources and capacities to sustainably increase business 2010-2016 (5 versions)
Perú (Centrum, 2017) Metropolitana and
Regional productivity and wellbeing of the region's population.
Lima regions)
Source: Own elaboration.
Investigaciones Regionales – Journal of Regional Research, 50 (2021/2), 125-146 ISSN: 1695-7253 e-ISSN: 2340-2717Regional Competitiveness in Latin America: A Comparative Study of the Key Elements for Regional Performance 135
FIGURE 1.
Regional Competitiveness Model
Source: Based in Aiginger & Firgo, 2017.
TABLE 2.
Variables and Sources
Source
Variable Number Variable Name Unit of measure
Chile Mexico Colombia
Inputs
Inputs - Cost and Efficiency
GDP per worker
1 dollars current Dollars PPP Estimation based in World Bank data (1)
prices
In 2018 constant
Real minimum
2 prices at 2018 USD OECD
wages
PPPs (country level)
Median minimum
relative to average Ratio (country
3 OECD
wages of full-time level)
workers
1: Regional GDP was estimated using Country GDP in current dollars in PPP from World Bank and assigning values of
regional distribution of Gross Value Added within countries using official country data.
Source: Own elaboration.
Investigaciones Regionales – Journal of Regional Research, 50 (2021/2), 125-146 ISSN: 1695-7253 e-ISSN: 2340-2717136 González, S.
TABLE 2. CONT.
Variables and Sources
Inputs - Regional Structure
Internet broadband
4 % of households OECD OECD DANE
access
Number of People
5 Density per square Based in Population and Area
kilometer
Inputs - Economic Structure
GDP per area
6 (dollars world dollars PPP Estimation based in World Bank data
bank)
7 Specialization index Index 0-1 Based in GDP data
Banco
Manufacturing % of the sector in
8 Central de INEGI DANE
industry Regional GDP
Chile
Banco
% of the sector in
9 Financial services Central de INEGI DANE
Regional GDP
Chile
Banco
Real state and % of the sector in
10 Central de INEGI DANE
household services Regional GDP
Chile
Personal services
Banco
(Education and % of the sector in
11 Central de INEGI DANE
health) and Regional GDP
Chile
professional services
Banco
Public % of the sector in
12 Central de INEGI DANE
administration Regional GDP
Chile
Inputs- Capabilities: innovation and education
13 Illiteracy rate % CASEN INEGI DANE
14 Years of education years CASEN INEGI DANE
Tertiary education
15 % CASEN INEGI DANE
assistance rate
Secondary
16 education assistance % CASEN INEGI DANE
rate
Primary education
17 % CASEN INEGI DANE
assistance rate
PCT patent Fractional count;
World
18 applications per by inventor and OECD OECD
bank
million inhabitants priority year
Inputs- Capabilities: Health and Social System
Life Expectancy at
19 Years OECD
Birth
Number of less
Infant Mortality
20 than 1-year deaths OECD
Rate
for 1,000 live births
Dependency Ratio, % 65+ over
21 OECD
Elderly population 15-64
1: Regional GDP was estimated using Country GDP in current dollars in PPP from World Bank and assigning values of
regional distribution of Gross Value Added within countries using official country data.
Source: Own elaboration.
Investigaciones Regionales – Journal of Regional Research, 50 (2021/2), 125-146 ISSN: 1695-7253 e-ISSN: 2340-2717Regional Competitiveness in Latin America: A Comparative Study of the Key Elements for Regional Performance 137
TABLE 2. CONT.
Variables and Sources
Inputs- Capabilities: Institutions
Number of
Intentional homicides per
22 OECD
Homicide Rate 100,000
inhabitants
Social Capital Index 0-1 (country
23 Prosperity index - Legatum Institute
Index level)
Corruption Index 0-1 (country
24 Transparency international
perception index level)
Results - Economic
GDP per capita
25 dollars current dollars PPP Estimation based in World Bank data
prices (world bank)
Banco
GDP Growth rate 5
26 % Central de INEGI DANE
years
Chile
Results - Environmental
Average level in
Air Pollution in
27 µg/m³ experienced OECD
PM2.5
by the population
% of total final
Renewable energy
28 energy consumption World Bank
consumption
(country level)
Results- Social
29 Poverty % CASEN CONEVAL DANE
Employment Gap
30 (difference male- % CASEN INEGI DANE
female)
Labor participation
31 % CASEN INEGI DANE
rate
32 Unemployment rate % CASEN OECD DANE
1: Regional GDP was estimated using Country GDP in current dollars in PPP from World Bank and assigning values of
regional distribution of Gross Value Added within countries using official country data.
Source: Own elaboration.
4. Results
4.1. Regional Input Competitiveness and Results Competitiveness
Index
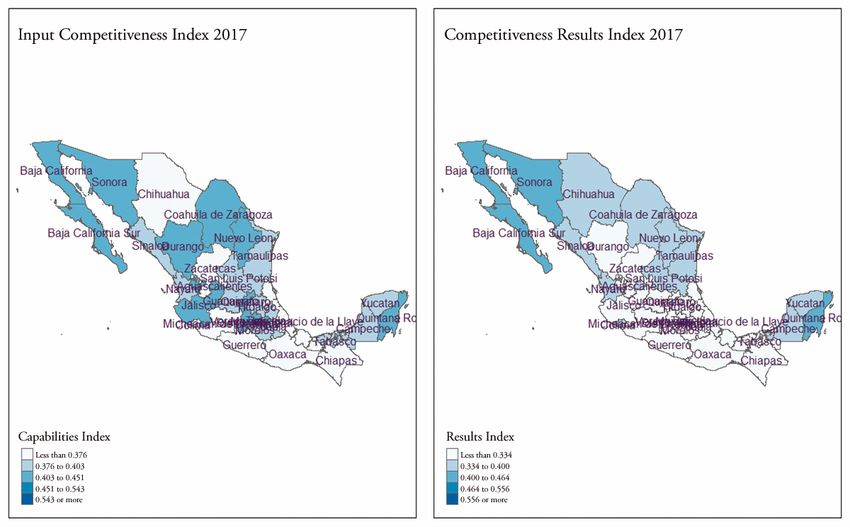
Figures 2 to 4 show Inputs Competitiveness Index and Results Competitiveness Index rankings for
Chile, Colombia, and Mexico in the year 2017. Detailed variables and ranking results are presented in
Appendix I, Table 1 - 3.
The Input Competitiveness Index shows consistent results when compared with an index with no
PCA weighting system. Similarly, Results Competitiveness Index show similar rankings using arithmetic
means instead of geometric means. Results of each alternative index are presented in Appendix 1, graphs
1 and 2.
Investigaciones Regionales – Journal of Regional Research, 50 (2021/2), 125-146 ISSN: 1695-7253 e-ISSN: 2340-2717138 González, S.
FIGURE 2.
Map of Chile. 2017 Input Competitiveness Index and Competitiveness Results Index by Region
FIGURE 3.
Map of Colombia. 2017 Input Competitiveness Index and Competitiveness Results Index by
Department
Investigaciones Regionales – Journal of Regional Research, 50 (2021/2), 125-146 ISSN: 1695-7253 e-ISSN: 2340-2717Regional Competitiveness in Latin America: A Comparative Study of the Key Elements for Regional Performance 139
FIGURE 4.
Map of Mexico. 2017 Input Competitiveness Index and Competitiveness Results Index by Region
Graph 1 shows the Results Competitiveness Index for 2017 and the Inputs Competitiveness Index
for 2017. Crossing red lines show the median score for the 2 indexes. Regions from Chile are clustered in
high levels of competitiveness for both inputs and results, together with 7 regions from Colombia and 3
regions from Mexico. The clustering of regional competitiveness by countries indicate that there are strong
country effects influencing overall scores.
Most regions that present below median levels of Input and Results Competitiveness are from
Mexico. Chocó, from Colombia, presents unusually low levels of Input and Results Competitiveness in
2017 along with the Mexican regions of Guerrero, Chiapas, Oaxaca, Morelos, and Veracruz de Ignacio de la
Llave.
On the other hand, all three regions that contain the national capitals from each country have the
largest level of Input Competitiveness and are not clustered by country in the case of Bogotá (Colombia)
and Distrito Federal (Mexico). High levels of both Results and Input Competitiveness are observed in
Bogotá.
Graph 2 shows for each country average scores for each competitiveness pillar and for Results and
Input Competitiveness Index. According to these results, the differences in Regional Input
Competitiveness between countries are explained by Regional Infrastructure, Innovation and Education,
and Institutions pillars. On the other hand, Results Competitiveness differences are explained by the
Environmental and Social components.
In average, Chile shows a higher relative score of Input Competitiveness, and this is specifically due
to higher results in Regional Infrastructure and Institutions pillars. Both Mexico and Colombia have
similar Input Competitiveness average scores, and low relative values to Chile. In Mexico, the Innovation
and Education pillar shows the lower relative score, while in Colombia the Institutions pillar shows the
lower relative score. Results Competitiveness relative scores are similar between Mexico and Chile but are
relative lower for Colombia. Colombia shows the lower relative score in the Environmental results pillar.
Economic results scores are not relative different between the three countries.
Investigaciones Regionales – Journal of Regional Research, 50 (2021/2), 125-146 ISSN: 1695-7253 e-ISSN: 2340-2717140 González, S.
GRAPH 1.
Results Competitiveness Index 2017 vs Input Competitiveness Index 2008
GRAPH 2.
Average Scores for Competitiveness Pillars and Competitiveness Index by Country
Investigaciones Regionales – Journal of Regional Research, 50 (2021/2), 125-146 ISSN: 1695-7253 e-ISSN: 2340-2717Regional Competitiveness in Latin America: A Comparative Study of the Key Elements for Regional Performance 141
4.2. Variation of regional input competitiveness and results
competitiveness
Graph 3 shows the variation in the results competitiveness index between 2008-2017 and the initial
levels of input competitiveness in 2008 for all regions. Regions with higher levels of input competitiveness
in 2008 have a higher increase of their level of results competitiveness index between 2008-2017. The
correlation coefficient between these two variables is 0.52. These results suggest that there is a positive
relation between levels of input competitiveness and changes in results competitiveness, thus higher
Regional Input Competitiveness levels would increase the growth of regional Results Competitiveness.
GRAPH 3.
Changes in Results Competitiveness Index 2017/2008 vs Input Competitiveness Index 2008
Graph 4 shows the variation in Results Competitiveness Index between 2008-2017 and the initial
levels of results competitiveness for 2008 for all regions. The correlation coefficient between these two
variables is -0.43. Regions with higher initial levels of Results Competitiveness Index had lower increases
in the Results Competitiveness Index between 2008-2017, thus suggesting a convergence trend between
2008 and 2017.
Table 3 shows variation coefficients (CV) of Regional Results Competitiveness Index for year 2018
and 2017 by country and for all the regions. In 2017, lower levels of CV for Results Competitiveness are
observed in Colombia, Mexico and all the regions, which supports the convergence trend observed in
graph 4. The decrease in the CV is explained by the Economic and Environmental pillars which show
lower levels of the CV in 2017. On the other hand, dispersion of the Results Competitiveness Index in
Chile is higher in 2017 than in 2008, suggesting a divergence trend which is explained by the increase in
the CV on the Economic Results Pillar.
Investigaciones Regionales – Journal of Regional Research, 50 (2021/2), 125-146 ISSN: 1695-7253 e-ISSN: 2340-2717142 González, S.
GRAPH 4.
Changes in Results Competitiveness Index 2017/2008 vs Results Competitiveness Index 2008
TABLE 3.
Variation Coefficients (CV) for Results Pillars and Results Competitiveness Index by Country
Chile Colombia Mexico All
Pillar 2008 2017 2008 2017 2008 2017 2008 2017
Economic Results
0.052 0.055 0.074 0.051 0.047 0.037 0.101 0.050
Pillar
Social Results Pillar 0.079 0.079 0.097 0.108 0.131 0.131 0.106 0.121
Environmental Results
0.147 0.083 0.085 0.101 0.059 0.059 0.284 0.231
Pillar
Results
0.040 0.043 0.070 0.068 0.060 0.059 0.114 0.090
Competitiveness Index
5. Conclusions
Comparable regional indicators are necessary to understand regional performance. Improving the
standardization of regional data for Latin American regions and increasing the availability of indicators at
the regional level is imperative, especially of those related to environmental and institutional factors, which
are not widely available at the regional level.
The largest endowment of competitiveness capabilities in Latin America is found in regions that
allocate major cities: Bogotá in Colombia, DF in Mexico and Metropolitana in Chile. Regions with higher
Investigaciones Regionales – Journal of Regional Research, 50 (2021/2), 125-146 ISSN: 1695-7253 e-ISSN: 2340-2717Regional Competitiveness in Latin America: A Comparative Study of the Key Elements for Regional Performance 143
competitiveness results index are Bogotá, Aysén and Magallanes, these regions show higher levels of
environmental, social, and economic indicators in 2107. Regions that are not capitals tend to cluster
around within countries levels of competitiveness, which may be an indication of country factors, such as
institutions having a major role in regional competitiveness.
The fact that Bogotá and Distrito Federal regions show unusually high levels for both input and
results competitiveness may be an indication that they may be competing in a different way than other
regions from those countries. In this sense, cross country comparison would make most sense when
comparing highly competitive regions, which compete for capital, skilled workers and foreign investment,
or regions that allocate exporting sectors, such as mining or agricultural industry. On the other hand,
medium or low competitiveness regions cluster around national averages, is an indication that these regions
may not be competing in the same way high competitiveness regions do.
Results show that regions with higher Input Competitiveness yield higher progress in
competitiveness results for the 2008-2017 period. In consequence, the initial level of competitiveness
capability of a region may be linked to an increase in the competitiveness result of a region and the welfare
of its population. Specifically, pillars related to Regional Infrastructure, Innovation and Education, and
Institutions present higher variability which would explain most of the differences in Input
Competitiveness.
Policy implications regarding this issue are important, since promoting competitiveness capabilities,
specifically of the identified Input Competitiveness pillars, in less advantaged regions would be crucial to
achieve economic, social, and environmental gains in those regions, thus increasing population well-being.
Additionally, results suggest a convergence trend in Regional Results Competitiveness, since CV
decreased between 2008 and 2017 for the whole sample. Within country dispersion of Regional Results
Competitiveness decreased in Colombia and Mexico but increased in Chile. The economic and
environmental pillars are the ones that explain most of the reduction in the dispersion.
Further research is needed to find econometric evidence to support the link between input and
results competitiveness and of convergence patterns of not only economic, but also social and
environmental variables.
References
Aiginger, K. (2006). Competitiveness: From a dangerous obsession to a welfare creating ability with
positive externalities. Journal of Industry, Competition and Trade, 6(2), 161–177.
Aiginger, K., Barenthaler-Sieber, S., & Vogel, J. (2013). Competitiveness under new perspectives. WWW
for Europe working paper No. 44. WIFO.
Aiginger, K., & Vogel, J. (2015). Competitiveness: from a misleading concept to a strategy supporting
Beyond GDP goals. Competitiveness Review, 25(5), 497–523.
Aiginger, K., & Firgo, M. (2017). Regional Competitiveness: connecting and old concept with new
goals. Handbook of regions and competitiveness.
Annoni, P., & Dijkstra, L. (2017) Measuring and monitoring regional competitiveness in the European
Union. Handbook of regions and competitiveness.
Barro, R., & Sala-i-Martin, X. (1992) Convergence. Journal of Political Economy 100(2), 223-251.
Boschma, R. (2004) Competitiveness of Regions from an Evolutionary Perspective. Regional Studies 38,
9, 1001-1014. https://doi.org/10.1080/0034340042000292601
Borozan, D., & Strossmayer, S. (2008). Regional competitiveness: some conceptual issues and policy
implications. Interdisciplinary Management Research, 4(1), 50-63.
Buitelaar, R, Espejo, A., González, S., y León, P. (2015) La comparabilidad de las estadísticas territoriales
en América Latina. Serie de Desarrollo Territorial 18 de la CEPAL. p.115.
Investigaciones Regionales – Journal of Regional Research, 50 (2021/2), 125-146 ISSN: 1695-7253 e-ISSN: 2340-2717144 González, S.
Camagni, R. (2003). On the Concept of Territorial Competitiveness: Sound or Misleading? ERSA
Conference Papers. European Regional Science Association, 39(13), 2395–2411.
Camagni, R. (2005). El concepto de competitividad territorial. Los Fundamentos de las políticas de
desarrollo regional de planificación urbana hoy. En Economía Urbana. Antoni Bosch.
Centrum (2017). Índice de competitividad regional del Perú 2016. Centro de Negocios de la Pontificia
Universidad Católica del Perú.
Consejo General de Economistas de España (2018). Informe de la Competitividad Regional en España 2018.
Estudios de Autor.
Consejo Nacional de la Competitividad (2013). Índice de Competitividad Regional. Informe Ejecutivo del
Consejo Nacional de la Competitividad.
Consejo Privado de Competitividad y Universidad del Rosario (2018). Índice Departamental de
Competitividad.
Cornick, J. (2016). Políticas de desarrollo productivo en América Latina: Discusiones recientes, creación de
empleo y la OIT. OIT Américas, Informes Técnicos, 2016/5. Oficina Regional para América Latina
y el Caribe.
Echeverría, C., y Arce, P. (2015). Índice de Competitividad Regional. Centro de Estudios en Economía y
Negocios. Universidad del Desarrollo.
Economic Commission for Latin America and the Caribbean – ECLAC (2010). La hora de la igualdad:
brechas por cerrar, caminos por abrir. Documento del periodo de sesiones de la CEPAL.
Economic Commission for Latin America and the Caribbean – ECLAC (2015). Panorama del desarrollo
territorial en América Latina y el Caribe 2015. Pactos para la igualdad territorial.
Economic Commission for Latin America and the Caribbean – ECLAC (2017). Panorama del desarrollo
territorial en América Latina y el Caribe 2017. Agendas globales de desarrollo y planificación
multinivel. Documentos de proyecto.
Economic Commission for Latin America and the Caribbean – ECLAC (2019). Panorama Social de
América Latina.
Esser, K., Hillebrand, W., Messner, D., y Meyer-Stamer, J. (1996) Competitividad sistémica: nuevo
desafío para las empresas y la política. Revista de la CEPAL 59, 39-52.
Fernandez-Arias, E., & Rodríguez, S. (2016). The productivity gap in Latin America: lessons from 50
years of development. IDB Working Paper Series, 692.
Figueroa, N. (2013). El desarrollo y las políticas públicas. Polis Revista latinoamericana, 33, 1-14.
https://journals.openedition.org/polis/8580
Fratesi, U. (2017). The dynamics of regional competitiveness. Handbook of Regions and Competitiveness.
Huggins, R., Izushi, H., Prokop, D., & Thompson, P. (2014). Regional competitiveness, economic
growth and stages of development. Zbornik Radova Ekonomskog Fakulteta u Rijeci. Proceedings of
Rijeka School of Economics, 32(2), 255-283.
Huggins, R., & Thompson, P. (2017a). Introducing regional competitiveness and development:
contemporary theories and perspectives. Handbook of Regions and Competitiveness.
Huggins, R., & Thompson, P. (2017b) Networks and Regional Economic Growth: A Spatial Analysis of
Knowledge Ties. Environment and Planning A 49(6),1247-1265.
Ibarra-Armenta, C., & Trejo-Nieto, A. (2014). Competencia territorial: un marco analítico para su
estudio. Economía, Sociedad y Territorio, XIV (44), 49–78. Retrieved from
http://www.redalyc.org/articulo.oa?id=11129102002
Investigaciones Regionales – Journal of Regional Research, 50 (2021/2), 125-146 ISSN: 1695-7253 e-ISSN: 2340-2717You can also read