Nexstar Media Group, Inc. Benchmark Company Consumer, Media and Entertainment Conference - NXST: NASDAQ
←
→
Page content transcription
If your browser does not render page correctly, please read the page content below
NXST: NASDAQ

                                      Nexstar Media Group, Inc.
Benchmark Company Consumer, Media and Entertainment Conference

                                             Tom Carter, EVP & CFO

                                              SEPTEMBER 2019
Disclaimer
Forward-Looking Statements
This communication includes forward-looking statements. We have based these forward-looking statements on our current expectations and projections about future events. Forward-
looking statements include information preceded by, followed by, or that includes the words "guidance," "believes," "expects," "anticipates," "could," or similar expressions. For these
statements, Nexstar claims the protection of the safe harbor for forward-looking statements contained in the Private Securities Litigation Reform Act of 1995. The forward-looking
statements contained in this communication, concerning, among other things, future financial performance, including changes in net revenue, cash flow and operating expenses, involve
risks and uncertainties, and are subject to change based on various important factors, including the impact of changes in national and regional economies, the ability to service and
refinance our outstanding debt, successful integration of acquired television stations and digital businesses (including achievement of synergies and cost reductions), pricing fluctuations
in local and national advertising, future regulatory actions and conditions in the television stations' operating areas, competition from others in the broadcast television markets, volatility
in programming costs, the effects of governmental regulation of broadcasting, industry consolidation, technological developments and major world news events. Nexstar undertakes no
obligation to update or revise any forward-looking statements, whether as a result of new information, future events or otherwise. In light of these risks, uncertainties and assumptions,
the forward-looking events discussed in this communication might not occur. You should not place undue reliance on these forward-looking statements, which speak only as of the date of
this release. For more details on factors that could affect these expectations, please see Nexstar’s other filings with the Securities and Exchange Commission.

Definitions and Disclosures Regarding non-GAAP Financial Information
Broadcast cash flow is calculated as net income, plus interest expense (net), loss on extinguishment of debt, income tax expense (benefit), depreciation, amortization of intangible assets
and broadcast rights (excluding barter), (gain) loss on asset disposal, corporate expenses, other expense (income) and goodwill and intangible assets impairment, minus pension and other
postretirement plans credit (net), reimbursement from the FCC related to station repack and broadcast rights payments. We consider broadcast cash flow to be an indicator of our assets’
operating performance. We also believe that broadcast cash flow and multiples of broadcast cash flow are useful to investors because it is frequently used by industry analysts, investors
and lenders as a measure of valuation for broadcast companies.

Adjusted EBITDA is calculated as broadcast cash flow, plus pension and other postretirement plans credit (net), minus corporate expenses. We consider Adjusted EBITDA to be an indicator
of our assets’ operating performance and a measure of our ability to service debt. It is also used by management to identify the cash available for strategic acquisitions and investments,
maintain capital assets and fund ongoing operations and working capital needs. We also believe that Adjusted EBITDA is useful to investors and lenders as a measure of valuation and
ability to service debt.

Free cash flow is calculated as net income, plus interest expense (net), loss on extinguishment of debt, income tax expense (benefit), depreciation, amortization of intangible assets and
broadcast rights (excluding barter), (gain) loss on asset disposal, stock-based compensation expense, non-cash compensation expense, stock-based compensation expense, goodwill and
intangible assets impairment and other expense (income), minus payments for broadcast rights, cash interest expense, capital expenditures, proceeds from disposals of property and
equipment, and net operating cash income taxes. We consider Free Cash Flow to be an indicator of our assets’ operating performance. In addition, this measure is useful to investors
because it is frequently used by industry analysts, investors and lenders as a measure of valuation for broadcast companies, although their definitions of Free Cash Flow may differ from
our definition.

For a reconciliation of these non-GAAP financial measurements to the GAAP financial results cited in this communication, please see the supplemental tables at the end of our fourth
quarter 2018 financial results press release dated February 26, 2019 and our second quarter 2019 financial results press release dated August 7, 2019. With respect to our forward-looking
guidance, no reconciliation between a non-GAAP measure to the closest corresponding GAAP measure is included in this release because we are unable to quantify certain amounts that
would be required to be included in the GAAP measure without unreasonable efforts and we believe such reconciliations would imply a degree of precision that would be confusing or
misleading to investors. In particular, reconciliation of forward-looking Free Cash Flow to the closest corresponding GAAP measure is not available without unreasonable efforts on a
forward-looking basis due to the high variability, complexity and low visibility with respect to the charges excluded from these non-GAAP measures such as the measures and effects of
stock-based compensation expense specific to equity compensation awards that are directly impacted by unpredictable fluctuations in our stock price and other non-recurring or unusual
items such as impairment charges, transaction-related costs and gains or losses on sales of assets. We expect the variability of these items to have a significant, and potentially
unpredictable, impact on our future GAAP financial results.

                                                                                                                                                                                                   2
Nexstar Media Group, Inc. (Nasdaq: NXST)
                          One of North America’s Largest Local Media Companies
                 Positioned for the Ongoing Enhancement of Long-Term Shareholder Value

• Pure-play broadcast television and digital media leader with broad geographic scale and reach
   – #2 in broadcast group in terms of U.S. television household reach
   – Owns or provides services to more than one TV station in over half of its 100 total markets

• Robust revenue, net income and free cash flow (“FCF”) growth
   – FY18 net revenue of $2.8 bn, net income of $388.3 mm (including one-time transaction expenses of $8.4 mm)
   – FY18 Adjusted EBITDA of $1.0 bn and FCF of $692.7 mm (before one-time transaction expenses)
   – Returned over $120 mm to shareholders in the form of dividends / share repurchases and reduced total net debt by ~$400 mm in FY18
   – 1H19 (six-months ended 6/30/19) net revenue of $1.3 bn, net income of $127.6 mm (including one-time transaction expenses of $10.5
     mm) and FCF of $216.7 mm (before one-time transaction expenses)
   – Returned ~$41 mm to shareholders in the form of dividends and reduced total outstanding debt by ~$204 mm through the six-month
     period ended June 30, 2019

• Leading industry consolidator with proven ability to extract value from acquisitions
   – Entered into definitive agreement to acquire Tribune (NYSE: TRCO) for $6.4 bn in accretive cash transaction in 4Q18
     • Compelling combination delivering immediate and long-term value to shareholders of both companies
     • Leverages proven acquisition track record highlighted by 2017 Media General (MEG) transaction where Nexstar met or exceeded its
        synergy realization and leverage reduction targets
          – Generated 2017/2018 average annual FCF of over $610 mm before one time transaction expenses on a reported basis (not
            including pro-forma adjustments)
          – Reduced total net leverage ratio from 5.5x at the closing of the MEG transaction to 3.39x at June 30, 2019

• Disciplined management team with history of operational excellence and strong record of delivering shareholder value
   –   Accretive M&A, growing dividend and opportunistic share repurchases
   –   Ongoing focus on managing Company costs and capital structure
   –   CEO / CFO placed 1st in the 2018 and 2019 Institutional Investor All America Executive Team survey for the TMT sectors
   –   Over the last five years, NXST share price performance has significantly outpaced the Dow Jones, S&P 500 and Russell 3000 indices
                                                                                                                                           3
2018: Record Financial Results For Seventh Consecutive Year
NXST Generated Record 2018 Financial Results
NXST 4Q18 and FY18 Financial Results Y/Y and Political Even-Year Comparison1,2
4Q Ended Dec. 31 FY Ended Dec. 31 3M Change (%) 12M Change (%)
(in millions) (in millions)
2018 2017 2016 2018 2017 2016 ‘18 vs. ’17 ‘18 vs. ‘16 ‘18 vs. ’17 ‘18 vs. ‘16
Net Revenue $798.0 $653.7 $309.9 $2,766.7 $2,432.0 $1,103.2 +22.1% +157.5% +18.2% +150.8%
Net Income $154.5 $379.9 $20.4 $388.3 $475.3 $91.5 +(59.3)% +657.4% +(18.3)% +324.4%
Broadcast Cash Flow $379.9 $241.9 $145.4 $1,123.6 $868.6 $456.7 +57.0% +161.3% +29.4% +146.0%
Adjusted EBITDA (Before 1x Transaction Exp.) $358.3 $227.8 $134.8 $1,031.9 $802.2 $405.5 +57.3% +165.8% +28.6% +154.5%
Adjusted EBITDA $352.8 $225.7 $134.8 $1,023.4 $743.3 $405.5 +56.3% +161.7% +37.7% +152.4%
Free Cash Flow (Before 1x Transaction Exp.) $255.4 $157.5 $85.4 $692.7 $528.0 $244.8 +62.1% +199.1% +31.2% +183.0%
Free Cash Flow $249.9 $155.4 $85.4 $684.2 $469.0 $244.8 +60.8% +192.6% +45.9% +179.5%
NXST 2018 Revenue Growth
Television Advertising Revenue Retransmission, Digital & Other Revenue NXST FY18 Revenue Mix
Local National Political Other Digital Retrans (% of Total Net Revenue)
+18.2% +13.8% Other Television
$ millions $1,135 $1,341
$ millions 2% Advertising
$2,432 $2,767 48%
$43
$75 $261 Retrans &
$251
+38.9% $27
+22.1% $227 Digital 50%
$303 $292 NXST FY18
$316 $439 $654 $798 Net Revenue
~$2.8 Billion
$13 $140 $22 $10
$65
$83 $82 $63
$220 $216 $805 $798 $253 $285 $996 $1,121
4Q17 4Q18 FY17 FY18 4Q17 4Q18 FY17 FY18
1For a reconciliation of non-GAAP financial measurements, please see the supplemental tables at the end of our fourth quarter 2018 financial results press release dated February 26, 2019
2For detailed disclosure, please see Company’s Annual Report on Form 10-K for the three and twelve month period ended December 31, 2018
42019: First Half Financial Results and Capital Allocation
NXST 1H19 Financial Results and Revenue Mix
NXST 1H19 Financial Results Y/Y and Non-Political Odd-Year Comparison1,2 NXST 1H19 Revenue Mix
(% of Total Net Revenue)
1H Ended Jun. 30 1H Change (%)
(in millions) Other Television
‘19 vs. ’18 ‘19 vs. ‘17 1% Advertising
2019 2018 2017 41%
Net Revenue $1,275.7 $1,275.7 $1,166.4 0.0% 9.4% Retrans &
Net Income $127.6 $133.9 $53.4 (4.7)% 139.0% Digital 58%
NXST 1H19
Broadcast Cash Flow $435.2 $462.0 $415.2 (5.8)% 4.8% Net Revenue
Adjusted EBITDA (Before 1x Transaction Exp.) $385.9 $415.9 $379.9 (7.2)% 1.6% ~$1.3 Billion
Adjusted EBITDA $375.4 $414.2 $326.0 (9.4)% 15.2%
Free Cash Flow (Before 1x Transaction Exp.) $216.7 $271.4 $247.9 (20.2)% (12.6)%
Free Cash Flow $206.1 $269.6 $194.0 (23.6)% 6.2%
Notes: The comparable 2018 six-month period benefitted from cyclical revenue of over $20.0 mm related to the Winter Olympics and ~$41.0 mm related to the 2018 mid-term elections, which was non-recurring in the 2019 six-month period
Second quarter 2019 free cash flow was impacted by the timing of 2019 operating cash tax payments and capital expenditures. Nexstar’s fiscal year 2019 budgets for cash taxes and cap-ex remain unchanged, therefore the timing issue
will self-resolve over the remainder of the year.
NXST 2019 YTD Capital Allocation Mix
Dividend • Nexstar remains committed to applying growing FCF toward leverage reduction, increased
Payments 16%
returns of capital to shareholders and additional investments in its business / employees to
Strategic deliver enhanced levels of service to its viewers, local communities and advertisers
M&A 3%
NXST 1H19 • Raised cash dividend 20% to $1.80 annually in 1Q, marking 6th annual consecutive increase
Capital – Returned ~$41 mm to shareholders in the form of dividend payments in 1H19
Allocation1
~$251 Million • Reduced funded debt by ~$112 mm in 2Q and allocated ~$204 mm in cash from operations
(% of Total) to reduce total outstanding debt through the six-month period ended June 30
– Subsequent to quarter-end, repaid ~$12 mm on term loan balance in July
Leverage • NXST paid the remaining ~$6 mm related to its acquisition of KHII-TV in January
Reduction 81%
1For a reconciliation of non-GAAP financial measurements, please see the supplemental tables at the end of Nexstar’s second quarter 2019 financial results press release dated August 7, 2019
2For detailed disclosure, please see Company’s Quarterly Report on Form 10-Q for the three month period ended June 30, 2019
5Nexstar Acquisition of Tribune Media
SUBTITLE TEXT
6Nexstar and Tribune: A Powerful Combination
Leveraging the Value of Leading Local Media Assets, Scale, Diversification and Management
▪ Creates leading pure-play broadcast television and digital media company
– One of the nation’s largest providers of local news, sports and network programming and digital content
– Premium local advertising opportunities and integrated marketing campaigns at national scale
▪ #1 broadcast television group with broad geographic reach and scale
– 197 stations in 115 markets, with greatly expanded presence in top 50 DMAs (1)
– Further diversifies affiliation mix and increases Nexstar’s attractiveness as a network partner
▪ Advances growing portfolio of digital products to drive increased value for advertisers, agencies and brands
– Comprehensive and competitive offering of digital media products and services across all markets
▪ Financially compelling combination for shareholders of both companies
– $160 million of readily achievable year one synergies
– Strong recurring cash flow from 31% interest in TV Food Network
– Nexstar’s pro forma average 2018/2019 FCF increases ~46% to more than $900 million
– Positioned for significant de-leveraging and increased return of capital to shareholders
▪ Leverages Nexstar’s proven acquisition track record highlighted by 2017 Media General transaction
– Experienced, industry-leading management team
– History of seamless integration and synergy realization outperformance
– Long-term record of creating shareholder value through accretive M&A
– Established divestiture process in order to secure regulatory approvals
____________________
Source: Company filings and Wall Street research.
(1) Includes divestitures necessary for regulatory approval.
7Nexstar and Tribune: America’s Leading Local Broadcast and Media Company
#1 local broadcast group in terms of US TV household reach
% of U.S. Television Households Reached, Inclusive of UHF Discount
39% 39% FCC Cap on National TV Ownership1
27%
25% 25% 24%
21% 20%
17%
13% 12%
7% 6%
4%
____________________
Source: Company filings and SNL Kagan. Pro forma for all transactions announced to date.
(1) US television household reach is shown after all necessary divestitures for regulatory approval. 8Significantly Increases Geographic Diversification and Scale
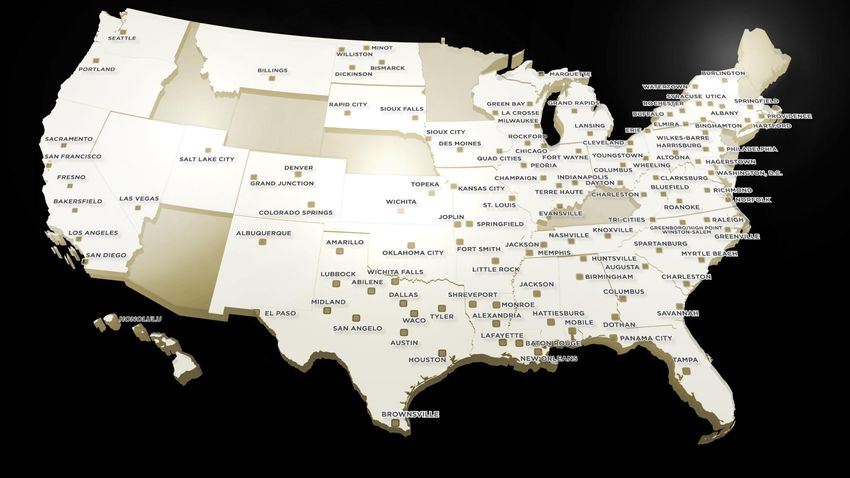
Pro Forma: 197 Television Stations in 115 markets across 42 US States1
#1 local broadcast TV station group and one of the largest producers and distributors of
local news, lifestyle, sports and network programming
1130101_1.wor Ny008U43
____________________
Source: Company filings.
(1) Number of stations and markets includes announced necessary divestitures for regulatory approval. 39% household reach is inclusive of the UHF discount and after all necessary divestitures for regulatory approval. 9Strong Combined Company Financial Profile
2017/2018 Net Revenues ($ millions)
$4,585
$2,887
$2,054 $2,049
$1,029
NXST PF SBGI TGNA GTN (3) SSP
+ (1)
2017/2018 Adj. EBITDA ($ millions)
$1,670
$840 $783
$722
$177
NXST PF SBGI TGNA GTN (3) SSP
+ (1)(2)
____________________
Source: Company filings and Wall Street research.
Note: 2017 figures are as reported unless otherwise noted. 2018 figures are based on Wall Street research and not pro forma for acquisitions unless otherwise noted. Adjusted EBITDA is Post-SBC.
(1) Revenue includes $75mm of net retransmission synergies and EBITDA includes $160mm of total synergies.
(2) Includes the net impact broadcast rights payments greater than broadcast rights amortization of $21mm and $44mm in 2017 and 2018, respectively. Includes cash distributions from TV Food Network.
(3) Pro forma for the announced acquisition of Raycom Media. Based on RBC Capital Markets equity research from November 6, 2018.
10Nexstar and Tribune: Transaction Update
▪ In March, Tribune Media stockholders voted to approve the transaction
▪ In March and April, Nexstar entered into three definitive agreements with TEGNA, E.W. Scripps and Circle City Broadcasting
to divest a total of 21 stations in 16 markets for an aggregate purchase price for $1.36 bn, representing a blended multiple
of 10.6x average two-year broadcast cash flow
– Marks completion of divestiture plan to comply with Federal Communications Commission (FCC) local and national TV
ownership rules and to obtain FCC and Department of Justice approval of the proposed transaction
– The total gross divestiture proceeds exceed Nexstar’s initial estimate by approximately 36%, while the cash flow to be
divested, inclusive of the elimination of certain synergies, is less than prior projections
– As a result, Nexstar’s net leverage ratio at transaction close will approximate 5.1x, compared to the Company’s prior
estimate of approximately 5.3x
▪ In April, the Federal Trade Commission / DOJ approved Nexstar’s divestitures to E.W. Scripps from the standpoint of the
transaction’s compliance with the national ownership cap
▪ In late April, the divestiture applications were put on public notice and the comment period for these applications ended
in late May
▪ In June, Nexstar priced a new $3.1 billion term loan B and a new $675 million term loan A facility and in July, the Company
closed an offering of $1,120 million in aggregate principal amount of 5.625% new senior notes due 2027, marking the
successful completion of the primary financing components needed to complete the Tribune acquisition, with the
favorable rates and terms
▪ In July, Department of Justice provided its settlement and conditional approval of the Tribune acquisition, subject to the
planned station divestitures
▪ Nexstar has made all required FCC and other regulatory applications and continues to expect the transaction to close in
the third quarter of 2019
11Nexstar Stand-Alone Business Fundamentals
SUBTITLE TEXT
12One of the Largest North American Local Media Companies
174 Local TV Stations
40 U.S. States
100 U.S. Markets
26% Household Reach*
Growing Digital Business
Note: Inclusive of UHF discount. 13Nexstar Broadcasting, Inc.
Superior Locally Produced Content and Network Programming for Viewers;
Unrivaled Consumer Reach / Influence for Local Businesses and Advertisers
• Leading local broadcast television operator
– #2 broadcast group in terms of U.S. television household reach of 26%*
• Financial strength and flexibility to pursue additional select accretive acquisitions
– Owns or provides services to more than one TV station in over half of markets
– Operations in six Top 25 markets and twenty Top 50 markets
• Diverse portfolio of local television stations with long-term “Big 4” network contracts
– ~82% of station portfolio comprise of “Big 4” network affiliates
– #1 CBS affiliate group; #2 NBC affiliate group; #3 ABC, FOX and CW affiliate group
– Affiliate contracts give NXST exclusive rights to live primetime network content in its markets
• One of the nation’s largest providers of local news, lifestyle, sports and network programming
– NXST produces and delivers +3,900 hours per week of wholly-owned local news and content
– #1 or #2 viewership share ranking in 73% of markets
• Stable core advertising revenue and growing political advertising revenue
– Stable core revenue trends; projected annual growth (ex-pol.) of between 0.0% and +LSD% (local + national)
– Emphasis on local sales driving strong levels of quarterly new-to-television business
– Continued political revenue growth due to significant spending by PACs and non-candidate entities
• Growing non-traditional revenue streams
– Retransmission consent revenue growth
– Digital media revenue (community portal websites, mobile apps, etc.)
*Inclusive of UHF discount. 14Strong Broadcast Industry Fundamentals
1. Proven Business Model with High Barriers to Entry U.S. Pay TV Subscriber Growth (% Chg. Y/Y)
• The pay TV subscriber model with traditional MVPDs (cable/satellite) and 5.0% vMVPD excluded vMVPD included
virtual MVPDs (internet) remains relatively stable, though some vMVPDs 3.0%
are experienced share shift in 1H19 due to fewer promotions, higher prices
1.0%
• According to Goldman Sachs, the disparity between Netflix subscriber
-1.0%
1Q13
2Q13
3Q13
4Q13
1Q14
2Q14
3Q14
4Q14
1Q15
2Q15
3Q15
4Q15
1Q16
2Q16
3Q16
4Q16
1Q17
2Q17
3Q17
4Q17
1Q18
2Q18
3Q18
4Q18
1Q19
2Q19
growth and cord cutting indicates that it has been a supplement, rather
than a replacement, to subscription pay TV services1 -3.0%
• Overall, NXST’s subscriber levels have remained largely constant, with total -5.0%
pay TV subscriber growth down less than 0.1% -7.0%
1Credit Suisse, MoffettNathanson, Goldman Sachs, Company Data, SNL Kagan Source: MoffettNathanson estimates and analysis, Company reports
U.S. TV Station Advertising Revenue (Core + Political)
2. Stable Traditional TV Ad (Core + Political) Revenue
$22.0 $ billions 2017 – 2022
• While digital (predominately Google and Facebook) has overtaken TV as the CAGR 2.98%
$21.0
largest ad market globally, the TV ad-revenue stream has remained stable
$20.0
• U.S. TV station advertising revenue (core + political) is projected to grow at $19.0
a compound annual rate of 2.98% (2017 – 2022)2 $18.0
$17.0
• TV stations are expected to capture ~12% of the total local ad market in $16.0 $19 $20 $19 $22 $20 $22
2019 and TV broadcasters are well positioned to pursue opportunities in the $15.0
addressable TV market to sustain/grow revenue share3 2017 2018 2019 2020 2021 2022
2S&P Global / SNL Kagan June 2019; 3BIA Advisory Services December 2018 Source: S&P Global / Kagan, June 2019
3. Growing and Diversified Revenue Streams U.S. TV Station Revenue Mix (% of Total)
• With the rise in retransmission fee and digital revenues, today the U.S. TV Advertising Retrans Digital
broadcast TV industry is far less dependent traditional TV advertising
compared to ten years ago 2022 53% 39% 8%
• U.S. TV station retrans revenue is projected to grow at a compound annual
rate of 9.4% (2017 – 2022)2
2008 93% 2% 4%
• TV broadcast digital revenue is projected to grow at a compound annual
rate of 6.8% (2017 – 2022)2
2S&P Global / SNL Kagan June 2019 Source: S&P Global / Kagan, June 2019 15Strong Broadcast Industry Fundamentals
4. Greatest Share of Consumers’ Time Spent 4Q18 American Adults Weekly Time Spent with Media (HH:MM)
• Traditional TV has proven to be resilient, maintaining its central position in Traditional Live + Time-shifted Television 31:33
America’s households in an era of media industry disruption
• Despite rapid changes in video distribution technology, traditional TV TV-Connected Video on a
5:42 0:49
continues to dominate viewing and access to consumers, with American Devices Computer
adults (A18+) spending more time with TV than all media combined1
Video-Focused Video-Focused
• Americans (A18+) spent +37 hours with their TV sets in 4Q18, including TV- App Smartphone
1:35
App Tablet
0:50
Connected devices, with live TV accounting for ~74% of total TV viewership2
1GfK TVB Media Comparisons Study 2019; 2Nielsen Total Audience Report Source: Nielsen Q4 2018 Total Audience Report
Top 10 “Must Keep” TV Brands in US Among 18-34 Year Olds
5. Unrivaled Consumer Reach / Engagement / Trust
• Television reaches nearly 80% of all American adults (A18+)2 1. 6.
• According to a recent GfK study, 43% of American consumers cited 2. 7.
traditional TV as having the strongest influence on their decision to
3. 8.
purchase a product or service versus 5% for social media3
4. 9.
• Poynter Media Trust Survey found 76% of Americans have “a great deal” or
“a fair amount” of trust in local TV news, compared to 55% in national news 5. 10.
and 47% in online-only news outlets4
3GfK TVB Purchase Funnel Study 2019; 4Poynter Media Trust Survey August 2018 Source: Solutions Research Group (srg) “Must Keep TV Report, 11th Edition” (2018).
Relative Impact (Lift) Per $1 Million Advertising Investment
6. Brand-safe, ROI-Driven Marketing Platform
• For a $1M investment, TV’s lift is consistently 7x better than paid search
+7x +5x
and 5x better than online display ads5
• Removing TV and implementing standalone digital strategy has an average
negative effect of (18%) on ROI5
• Automakers that increased TV ad spend saw a statistically significant boost
in digital KPIs, including unique visitors and search, suggesting digital dollars Paid Online
TV TV
could be made more effective when paired with a TV campaign6 Search Display
5Neustar MarketShare 2017; 6VAB “A Look Under The Hood: The Effects Of TV Spend On Digital Interactions” August 2018 Source: Neustar MarketShare 2017 16Growth in NXST Political and Issue Advertising
CMAG: Political Spot TV Ad Revenue Growth CMAG: 2018 Political Spot TV Ad Revenue
($ millions) (Top 15 States, % Share of Total Spend)
Presidential Election Year Mid-term Election Year # State Ad Spend ($ mil.) Share (%)
1. California $480.7mm 16.1%
$3.1 2. Florida $369.1mm 12.4%
$2.9 3. Nevada $165.6mm 5.6%
$2.6 4. Illinois $145.2mm 4.9%
5. Texas $135.4mm 4.5%
$2.1 $2.0 6. Missouri $115.5mm 3.9%
7. Arizona $111.5mm 3.7%
$1.5 8. Ohio $111.0mm 3.7%
9. Michigan $107.6mm 3.6%
10. Pennsylvania $98.8mm 3.3%
11. New York $90.0mm 3.0%
12. Wisconsin $77.0mm 2.6%
13. Colorado $76.1mm 2.6%
14. Tennessee $71.7mm 2.4%
2008 2010 2012 2014 2016 2018 15. Indiana $68.0mm 2.3%
▪ NXST exceeded FY18 political revenue guidance generating $251.2 mm of net political revenue
▪ NXST FY18 same-station political ad revenue came in 50% higher than the comparable 2014 period and 38% higher
than the 2016 presidential election cycle
▪ CMAG reported 2018 political ad spending of $3.1B on local broadcast television, an increase of +50% compared to
the 2014 mid-term cycle and an increase of nearly +7% compared to the 2016 presidential election cycle1
▪ Long-term political spending expected to continue to grow due to significant spending increases by PACs, non-
candidate entities and issue advertising
Source: Company filings and Nexstar management. Note: Dollars in millions. 17
1Kantar/CMAG and TVBGrowth in NXST Political and Issue Advertising
Local TV Political Ad Spend Trends What To Expect NXST 2019 / 2020 Political
Going Forward Senate and Gubernatorial Elections
2020 Senate Races 2020 Gubernatorial Races
(34 Total Races; 24 NXST Markets) (11 Total Races; 9 NXST Markets)
Market Incumbent Party Market Incumbent Party
2019 Alabama Doug Jones D Delaware John Carney D
▪ Gubernatorial elections 3 total races; 2 in NXST Markets Alaska Dan Sullivan R Indiana Eric Holcomb R
Arizona Martha McSally R Missouri Mike Parson R
Arkansas Tom Cotton R Montana Steve Bullock* D
Colorado Cory Gardner R New Hampshire Chris Sununu R
2020 Delaware Christopher Coons D North Carolina Roy Cooper D
▪ Presidential race Georgia David Perdue R North Dakota Doug Burgum R
Idaho Jim Rich R Utah Gary Herbert* R
– Toss-Up: AZ, FL, MI, PA, WI Illinois Dick Durbin D Vermont Phil Scott R
– Lean Republican: GA, IA ME, NE, NC Iowa Joni Ernst R Washington Jay Inslee D
Kansas Pat Roberts* R West Virginia Jim Justice R
– Lean Democrat: MN, NH, NV Kentucky Mitch McConnell R
Louisiana Bill Cassidy R 2019 Gubernatorial Races
Maine Susan Collins R (3 Total Races; 2 NXST Markets)
▪ House race 435 seats total; 68 competitive races total Massachusetts Ed Markey D Market Incumbent Party
Michigan Gary Peters R Kentucky Matt Bevin R
– Broad exposure to races in NXST markets Minnesota Tina Smith D Louisiana John Bel Edwards D
– 61 competitive races in states where NXST has Mississippi Cindy Hyde-Smith R Mississippi Phil Bryant R
Montana Steve Daines R
presence Nebraska Ben Sasse R
New Jersey Cory Booker D
New Mexico Tom Udall * D
▪ Senate race 34 seats total; 11 competitive races total North Carolina Thom Tillis R
– 24 total races in NXST markets New Hampshire Jeanne Shaheen
Oklahoma Jim Inhofe
D
R
– 9 competitive races in NXST markets Oregon Jeff Merkley D
Rhode Island Jack Reed D
South Carolina Lindsey Graham R
▪ Gubernatorial elections 11 total; 4 competitive races total South Dakota Mike Rounds R
West Virginia Shelley Capito R
– 9 total races in NXST markets Wyoming Mike Enzi R
– 3 competitive races in NXST markets Tennessee
Texas
Lamar Alexander*
John Cornyn
R
R
Virginia Mark Warner D
Source: TVB, AAPC (2/15/19), Cook Political Report (1/9/19) Source: Cook Political Report, grey shading indicates non-NXST markets 18
*Incumbent not running for re-election due to personal choice or term-limitsGrowth in NXST Retransmission and Digital Media Revenue
Retransmission and Digital Media revenue is materially diversifying NXST’s total net revenue
NXST Retransmission & Digital Media Revenue NXST Retransmission Revenue
(% of Total Net Revenue) ($ millions)
Retransmission Revenue as a % of Total Net Revenue
Digital Media Revenue as a % of Total Net Revenue
50.3% 50.0% $1,121.1
43.3% 44.9% $995.8
40.9% 40.5%
33.2% 35.7%
31.9%
26.3%
24.5%
20.9% 20.1%
$394.0
15.8%
14.3% 14.0% 16.1% $298.0
8.6% 9.6% 11.1% $155.0
9.6%
$101.1
5.1% $60.9
3.6% 4.6% 4.4% 4.8% 4.9% 6.1% 7.4% 10.0% 9.2% 9.3% 9.4% $14.4 $24.3 $30.0 $37.4
2008 2009 2010 2011 2012 2013 2014 2015 2016 2017 2018 2008 2009 2010 2011 2012 2013 2014 2015 2016 2017 2018
• NXST led industry in securing retransmission consideration beginning in 2005
• Acceleration in retransmission revenue post-contract renewal cycle highlights ability to negotiate favorable rates
which also leads to competitive advantages in deriving value from station acquisitions
– Retransmission revenues: FY18 $1.1 bn (+12.6% Y/Y); CAGR of 57.2% (2008-2018)
– ~10% of sub base to reprice in 2018 and ~70% of sub base to reprice in 2019
• Digital revenue growth was driven by organic growth at Nexstar Broadcasting and contributions from Nexstar Digital
19Nexstar Digital LLC
Comprehensive Suite of Cross-platform Digital Marketing Products and Services for
Local and National Media Companies, Advertisers, Agencies and Brands
• Leading local digital advertising and content monetization solutions and services
– Profitable / growing business segment with very little competition due to focus on local
• Merged NXST and MEG products under the Nexstar Digital brand with a unified market strategy
– Creates more comprehensive and competitive offering of digital media products and services across all markets
– Opportunity to leverage cross-selling strategies from digital properties
– Product offerings include enterprise-class publishing platforms, mobile video technology and digital agency services under the HYFN,
Mass2 and Lakana brands
• Adding complementary capabilities through accretive acquisition of LKQD Technologies
– NXST acquired LKQD, a fast-growing, profitable digital video ad technology company for ~$97 mm cash including working capital in
December 2017; transaction closed in early 1Q18
o Infrastructure as a Service (IaaS) technology provides end-to-end systems for ad serving, mediation, programmatic auctions and
advanced reporting
o LKQD’s video advertising platform has the largest reach in the US, with ~115 mm viewers across all digital devices 1
• Expanding portfolio of digital products allows NXST to drive increased value through scale
– NXST will continue making accretive investments in digital products that complement its core competencies and have high growth
potential
• Objective is to double annual revenues within the next five years (2021)
– On a consolidated basis, NXST’s digital business continues to have positive revenue growth and EBITDA
– NXST completed shuttering of unprofitable MEG digital businesses, resulting in improved bottom-line performance for the
consolidated digital segment
o As a result of discontinued MEG digital operations, expect lower same-store top-line revenue growth to continue in 1H19 and
improve over time
1comScore Video Metrix®, Video Ad Ecosystem rankings, August, 2017 20Nexstar Financials and Leverage
SUBTITLE TEXT
21Significant FCF Growth
NXST Average Annual Free Cash Flow Growth (FY) Based on Two-Year Cycles
($ in millions)
$615.0 2
$390.8 1
$184.0
$82.7
$47.2
2010/2011 2012/2013 2014/2015 2016/2017 2018/2019E
1 Reported average annual free cash flow before transaction expenses in the twenty-four month period 2016/2017
2 Estimated average annual free cash flow before transaction expenses in the twenty-four month period 2018/2019
For legacy Nexstar, higher net revenues and net income from organic growth and recently completed transactions is
expected to drive average annual FCF to ~$615 mm during the 24 month period 2018/20192
• Estimates inclusive of management’s assumptions for interest rate increases by Fed policymakers in 2018/2019 and
the Company’s transition to a near full cash tax payer in 2018
• Reflecting announced share repurchase activity, NXST had ~45.6 mm shares outstanding at December 31, 2018
Pro forma for the pending Tribune acquisition, Nexstar is expected to generate average annual
FCF of ~$900 mm during the 24 month period 2018/2019
22Historical Financial Summary (in millions)
FY Net Revenue FY Broadcast Cash Flow(1)
$1,124
$2,767
$2,432
$869
$914
$1,103 $457
$896 $350
$631 $270
$369 $388
$502 $171 $193
$285 $252 $313 $306 $379 $172
$132
$82 $174 $116
$112 $157 $182 $190
$265 $279
39% 32% 42% 38% 45% 38% 43% 39% 41% 36% 41%
2008 2009 2010 2011 2012 2013 2014 2015 2016 2017 2018 2008 2009 2010 2011 2012 2013 2014 2015 2016 2017 2018
FY Adjusted EBITDA(1) FY Free Cash Flow(1)
$1,023
* $684*
* *
$743 $469
* *
$405 $245
$305 $208
$235 $160
$112 $146 $167 $81 $85
$96 $63 $96 $60
$26 $20 $34
34% 25% 36% 31% 39% 33% 37% 34% 37% 31% 38%
2008 2009 2010 2011 2012 2013 2014 2015 2016 2017 2018 2008 2009 2010 2011 2012 2013 2014 2015 2016 2017 2018
1) Definitions and disclosures regarding non-GAAP financial information can be located in the Company’s Fourth Quarter 2018 Financial Results press release dated February 26, 2019
*Reported Adjusted EBITDA and Free cash flow including transaction expenses in the twelve month period ended December 31 of $8.5 million in 2018, $58.9 million in 2017 and $8.9 million in 2016
Adjusted EBITDA before transaction expenses in the twelve month period ended December 31 was $1,031.9 million (28.6% margin), $802.2 million (33.0% margin) in 2017 and $414.3 million (37.6% margin) in 2016
Free cash flow before transaction expenses in the twelve month period ended December 31 was $692.7 million in 2018, $528.0 million in 2017 and $253.6 million in 2016
23
232Q19 and 1H19 Financial Summary
Three Months Ended June 30 6-Months Ended June 30
($ in thousands) 2019 2018 Change 2019 2018 Change
Local Revenue $ 199,279 $ 198,560 +0.4 )% $ 387,445 $ 391,828 (1.1 )%
National Revenue $ 68,332 $ 71,633 (4.6 )% $ 132,010 $ 138,678 (4.8 )%
Total Spot Ad Revenue 267,611 270,193 (1.0 )% 519,455 530,506 (2.1 )%
Political Revenue $ 3,157 $ 31,636 (90.0 )% $ 4,464 $ 40,902 (89.1 )%
Total Television Ad Revenue $ 270,768 $ 301,829 (10.3 )% $ 523,919 $ 571,408 (8.3 )%
Retransmission Fee Revenue $ 314,268 $ 276,273 +13.8 % $ 628,242 $ 552,214 +13.8 %
Digital Revenue $ 56,237 $ 63,999 (12.1 )% $ 109,072 $ 126,803 (14.0 )%
Trade and Barter / Other Revenue $ 7,739 $ 18,222 (57.5 )% $ 14,426 $ 25,234 (42.8 )%
Net Revenue $ 649,012 $ 660,323 (1.7 )% $ 1,275,659 $ 1,275,659 0.0 %
Income from Operations $ 149,944 $ 174,494 (14.1 )% $ 277,018 $ 292,110 (5.2 )%
Net Income $ 70,735 $ 86,606 (18.3 )% $ 127,622 $ 133,947 (4.7 )%
Broadcast Cash Flow(1) $ 227,458 $ 257,495 (11.7 )% $ 435,188 $ 461,998 (5.8 )%
Broadcast Cash Flow Margin(2) 35.0 % 39.0 % 34.1 % 36.2 %
Adjusted EBITDA Before One-Time Transaction Expenses(1) $ 202,178 $ 233,825 (13.5 )% $ 385,940 $ 415,916 (7.2 )%
Adjusted EBITDA (1) $ 197,037 $ 233,061 (15.5 )% $ 375,402 $ 414,171 (9.4 )%
Adjusted EBITDA Margin(2) 30.4 % 35.3 % 29.4 % 32.5 %
Free Cash Flow Before One-Time Transaction Expenses(1) $ 90,911 $ 148,926 (39.0 )% $ 216,673 $ 271,373 (20.2 )%
Free Cash Flow(1) $ 85,770 $ 148,162 (42.1 )% $ 206,135 $ 269,628 (23.5 )%
1) Definitions and disclosures regarding non-GAAP financial information including reconciliations are included in the First Quarter 2019 Financial Results press release dated
August 7, 2019
2) Broadcast cash flow margin is broadcast cash flow as a percentage of net revenue. Adjusted EBITDA margin is Adjusted EBITDA as a percentage of net revenue
3) Note: The comparable 2018 six-month period benefitted from cyclical revenue of over $20.0 mm related to the Winter Olympics and political advertising revenue related to
the 2018 mid-term elections of ~$32 million in the three-month period ended and ~$41 million in the six-month period, which was non-recurring in the 2019 three- and six-
month periods.
4) Note: Second quarter 2019 free cash flow was impacted by the timing of 2019 operating cash tax payments and capital expenditures. Nexstar’s fiscal year 2019 budgets for
cash taxes and cap-ex remain unchanged, therefore the timing issue will self-resolve over the remainder of the year. 24Debt/Leverage Analysis
TTM ENDED 3M ENDED
(in millions) 12/31/11 12/31/12 12/31/13 12/31/14 12/31/15 12/31/16 12/31/17 12/31/18 06/30/19
Revolver $ 24.3 $ - $ - $ 5.5 $ 2.0 $ 2.0 $ 3.0 $ 5.6 $ 5.6
First Lien Term Loans 148.1 288.3 545.4 705.1 682.2 662.2 2,791.9 2,407.5 2,211.0
8.875% Sr. Sec 2nd Lien
Notes 318.4 319.4 - - - - - - -
6.875% Sr. Sub Notes - 250.0 525.7 525.6 519.8 520.7 - - -
6.125% Sr. Sub Notes - - - - 272.2 272.6 273.0 273.4 273.7
5.875% Sr. Sub Notes - - - - - - 408.1 406.2 405.3
5.625% Sr. Sub Notes - - - - - 884.9 886.5 888.2 889.1
7% Sr. Sub Notes 149.6 - - - - - - - -
11.375% Sr. Discount Notes - - - - - - - - -
Total Debt $ 640.4 $ 857.8 $ 1,071.1 $ 1,241.6 $ 1,476.2 $ 2,342.4 $ 4,362.5 $ 3,980.9 $ 3,784.7
Cash on Hand $ 7.5 $ 69.0 $ 40.0 $ 131.9 $ 43.4 $ 87.7 $ 115.7 $ 145.1 $ 79.9
Reported EBITDA $ 96.2 $ 146.3 $ 166.7 $ 234.7 $ 305.1 $ 405.5 $ 802.2* $ 1,031.9* $ 202.2*
Compliance EBITDA $ 103.3 $ 189.5 $ 176.7 $ 211.2 $ 322.9 $ 429.0 $ 842.9 $ 1,101.6 $ 1,090.1
Compliance Leverage: 6.20x 4.16x 5.84x 4.40x 4.32x 3.20x 5.06x 3.69x 3.39x
FCF $ 34.2 $ 80.5 $ 84.9 $ 159.7 $ 208.2 $ 244.8 $ 528.0* $ 692.7* $ 90.9*
*Before one-time transaction expenses
25Transformative M&A, Commitment to Local and Operating Strategies Driving Record FCF
• Continued growth of non-core revenue channels
– Political: FY18 same-station political revenue was 50% higher than FY14 and 38% higher than FY16
• NXST political revenue exceeded guidance
– Retransmission: Contract renewals for >200 agreements in last three years
• Repriced ~10% of sub base in 2018 and over 70% to be repriced in 2019
• Agreements with ABC / FOX /CBS / NBC include equally attractive economics for OTT platforms
– Digital: Profitable growth of station-level and Nexstar Digital platform
• New revenue applications / monetization of mobile leading to growth organically and via accretive M&A
• Strong operating fundamentals, accretive M&A, share repurchases and balance sheet driving record FCF
– With higher net income, legacy NXST is expected to generate average annual FCF of ~$615 mm in 2018/2019 cycle and
$660 mm in 2019/2020 cycle
▪ Agreement to acquire TRCO represents strategically / financially compelling growth opportunity
– Creates largest US broadcast television station group with leading digital media platform
– Positions NXST to more effectively compete with other media and innovate
– Pro forma operating base of 197 full power TV stations in 115 markets with greatly expanded presence in top 50 DMAs*
– Significant year-one synergy realization of ~$160 mm expected to result in only a minimal increase in pro-forma leverage
– Expected to generate average annual pro forma FCF of ~$900 mm during the 2018/2019 cycle
– Transaction expected to close late in the third quarter of 2019
• Financial capacity / flexibility to reduce leverage while returning capital to shareholders
– 2018 cash dividend increase of 20% to $1.80 annually in 2019, marking sixth annual consecutive rise of cash dividend
– Opportunistic share repurchases of ~750,000 shares in 2018
• ~$201.9 million remains under NXST’s share repurchase authorization (a/o 6/30/19)
– Reduced total net leverage ratio from 5.07x at YE17 to 3.39x at 2Q19
• FCC’s proposed rulemaking to modernize ownership rules and facilitate the voluntary adoption of new ATSC 3.0 standards for
innovative Next Gen TV services would result in stronger competitive positioning for broadcast TV industry
– Potential new long-term revenue opportunities through the development of ATSC 3.0 related products/services
*Includes announced divestitures necessary for regulatory approval 26NXST: NASDAQ
Nexstar Media Group, Inc.
Benchmark Company Consumer, Media and Entertainment Conference
Tom Carter, EVP & CFO
SEPTEMBER 2019You can also read