Enhancing Returns: The Case for Hedge Fund Seeding - White Paper July 2021 - Investcorp-Tages
←
→
Page content transcription
If your browser does not render page correctly, please read the page content below

Enhancing Returns:
The Case for Hedge Fund Seeding
White Paper
July 2021

Contact                                  Author
Investcorp-Tages                         Mark de Klerk

39 St James’s Street, London, SW1A 1JD   Seeding Structuring

www.InvestcorpTages.com                  Investcorp-Tages

enquiries@InvestcorpTages.com
Enhancing Returns: The Case for Hedge Fund Seeding

AN OVERVIEW OF HEDGE FUND SEEDING

Seeding or acceleration capital investments can help investors with patient capital to decrease hedge fund
investment costs and to increase hedge fund returns. In exchange for making a day one investment (“seed capital”)
or early-stage investment (“acceleration capital”) into the manager’s hedge fund, investors can directly participate
in the management and performance fee revenues of a hedge fund manager’s firm.

This economic interest is typically structured as a gross revenue share participation which allows the investor to
receive a percentage of the management and performance fees earned by the manager without bearing exposure
to the costs of running an asset management firm. This economic interest is received at no additional cost to
making the initial investment in the manager’s fund.

Invested capital is typically subject to a commitment period of two to three years, during which the investor may
not redeem, unless certain pre-negotiated negative events have occurred; for example, a predefined loss of capital.
Following the expiry of the commitment period or one of these “redemption trigger events”, the investment can be
redeemed on standard redemption terms.

Following expiration of the commitment period, the revenue share interest continues for the life of the transaction
(typically for a minimum of 10 years but in many cases, this can be perpetual1). This is irrespective of whether the
capital remains invested or not. We estimate that the revenue share participation can contribute, on average, over
five times the profits that would be received on a hedge fund portfolio, in the absence of the revenue share
participation.

In this paper, we illustrate this enhancement to hedge fund returns under different return and asset raising
assumptions. We do this by simulating different return outcomes drawn from a random sampling of hedge fund
strategy index returns, and mapping these against an asset raising grid which we constructed based on
assumptions made between early-stage fund performance and asset raising over the life of each transaction. The
objective of the exercise is to demonstrate the consistent enhancement to returns which is available from seeding,
as well as the positive skew to the distribution of returns.

We also discuss the challenges of comparing returns from seeding to other asset classes which also derive their
returns from the economics of asset management firms. For example, private equity funds investing in minority
equity interests in the management companies or general partnerships of alternative asset managers (commonly
referred to as “GP stakes investing”). This is due to the mismatch between the term over which the seed capital is
at risk (the fund investment period, typically 2-3 years) and the term over which the gross revenue share is
potentially earned (the transaction period, typically 10+ years). This can make direct comparison of traditional
metrics potentially misleading and we illustrate this by modelling a seed portfolio where recycling of capital
continues over a similar measurement period to a typical private equity fund.

This characteristic of seeding may also be interesting for investors subject to regulatory capital charges against
their hedge fund portfolios.

THE EVOLUTION OF HEDGE FUND SEEDING

Prior to 2000, hedge funds were typically incubated within banks or seeded by wealthy individuals. Some successful
managers seeded their protégé’s launches, a practice which remains a common source of seed capital. In the early
2000’s, some alternative investments firms, typically those affiliated with an existing fund of hedge fund business,
began to seed new managers under more structured seeding programs. Investcorp was at the forefront of this
development, launching its seeding program in 2004. However, several seed investors struggled during the Global
Financial Crisis (GFC) and only a few of the original players remain in the business of seeding today.

The industry investor base has changed materially since the GFC, with a significant increase in institutional
investors and consultants focused on larger funds. The introduction of regulatory restrictions on global banks
investing in hedge funds and consolidation within the fund-of-hedge funds universe resulted in an overall decline
in seed capital available to new launches.

Since 2008, there has been a noticeable bifurcation in the industry, with the lion’s share of the asset growth going
to the largest managers. As an illustration of this, the top 463 firms managing over $1bn (the so called “billion-dollar
club”) accounted for $2.7trn or 90% of Assets Under Management (AUM) at the end of 2019 as compared to 79%

1
    Seward & Kissel 2020 Seed Transaction Deal Points: 80% of transactions were perpetual over the 2015-2020 review period

                                                  Investcorp-Tages Limited                                   Page 2 of 17
                                                  www.InvestcorpTages.com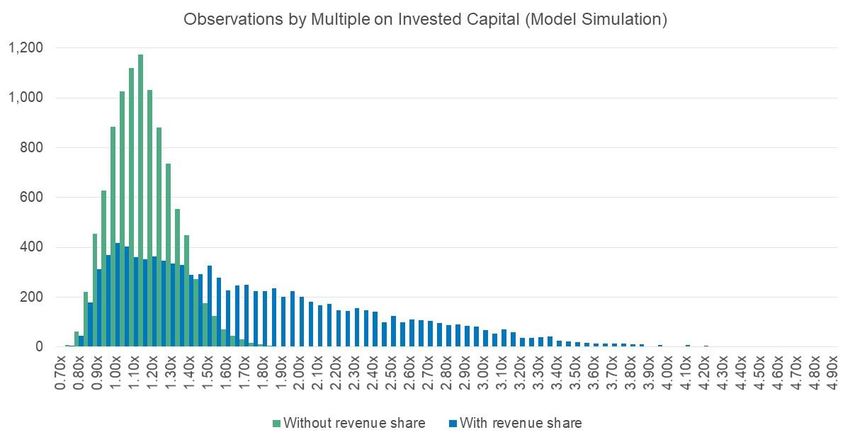
Enhancing Returns: The Case for Hedge Fund Seeding

of AUM in 2009 (although this did fall in 2020 to approximately 87%2). Institutional allocators often require a
minimum fund AUM to limit concentration and business risk. It is estimated that approximately 30% of investors
allocate to emerging managers (defined as launched within the past 2 years3), but many prospective allocators
have maximum holding ratios, minimum track record requirements, or minimum AUM requirements before they will
consider investing in a fund.

This provides an attractive opportunity for seed investors to support a manager in the early years and to scale their
AUM. New entrants to seeding who were attracted to this profile of returns or as a way to decrease costs post the
GFC, included some of the larger pension funds, in particular in North America, as well as some of the large multi-
strategy firms who began providing seed capital to in-house managers wanting to spin out and launch their own
firms. However, there remains a scarcity of dedicated seed capital providers, particularly in mid-size transactions,
defined as those in the $50m-$100m range.

THE DEMAND FOR HEDGE FUND SEEDING

There continues to be a strong pipeline of high-quality, talented managers with hedge fund experience, attracted
to the high margins available in the industry (40%+ margins are common4). At the same time, increasing institutional
minimum asset size requirements and escalating regulatory, compliance and operating costs have increased the
barriers to entry and therefore increased the attractiveness and value of seed capital. One option to overcoming
these difficulties is for managers to partner with a strategic investor who can provide patient seed or acceleration
capital. In many cases, the seed investor will also work with the manager to develop the business infrastructure
and distribution capabilities given the alignment of interest on both performance and asset-raising.

Prior to the GFC, some institutional allocators and hedge fund managers viewed the decision to take seed capital,
in exchange for giving up economics, as a negative signal that the manager was not in sufficient demand to launch
on their own. As the industry has matured and some high-profile institutional investors have directly or indirectly
entered the seeding space, this perception has reversed.

The demand for emerging managers has been increasing over the past five years. By way of example, managers
with under $500m in AUM have received net inflows of $53bn since the GFC, while mid-sized managers ($1-5bn
in AUM) received net outflows of $102bn over the same period. Larger managers ($5bn+ in AUM) increased AUM
significantly until 2015, but have received net outflows over the past 5 years5.

However, many investors still have minimum AUM requirements, maximum holding ratios and/or require evidence
of business stability prior to investing. A seed investors’ contribution to this stability, via committed AUM, due
diligence on the business, and direct or indirect working capital (via fees), can help an emerging manager to get
early-stage investors comfortable with making an allocation. This contribution to stability is now highly valued by
allocators who were previously sceptical on seeding, as well as by many of the bank capital introduction teams.

Although there is a wide range of emerging manager cost structures, we estimate that the working capital
requirement for a new launch today is between $1-2m per annum, depending on the strategy and location. When
considering seed economics and/or some level of fee discounting to attract early-stage capital, we estimate that
this equates to an AUM break-even range of $100m-150m, prior to performance fees.

In addition, many institutional investors expect to see a material level of “skin in the game” from the principals. This
could run into multiple single to low double-digit millions of dollars. Although all circumstances are different, early-
stage investors are likely to focus on this aspect of due diligence if the level of this co-investment is inconsistent
with the perceived pedigree and expected earnings of the principal(s) in their former roles.

These barriers to entry present an acute challenge to early-stage managers, which can make seed and acceleration
capital more valuable, both from a working capital perspective and as a signalling mechanism to service providers
and prospective investors. However, it also makes the size of the seed capital and the momentum of asset raise
within the first three years important.

2
  HFM Billion Dollar Club
3
  Morgan Stanley Quarterly Vantage Points Feb 2021
4
  Barclays Under the Hood – HF Financials November 2020
5
  HFR Global Hedge Fund Industry Report 2020

                                               Investcorp-Tages Limited                                  Page 3 of 17
                                               www.InvestcorpTages.com
Enhancing Returns: The Case for Hedge Fund Seeding
HEDGE FUND SEEDING ECONOMICS
Returns of a seed investment are derived from 1) the performance generated on the underlying fund investment
while invested in the fund and 2) participation in the revenues generated by the hedge fund manager, including
those derived from management and performance fees earned by the manager. These fees often extend across
any funds managed by the manager over the term of the transaction. These revenues are dependent on asset
growth, fees charged and performance of the underlying funds.
For the purposes of illustration in this paper, we will make some simplifying assumptions, but it is worth noting that
most seed transactions are highly negotiated with bespoke terms for each transaction. Given the strategic nature
of the relationship, this also provides the opportunity to negotiate other benefits such as preferential fees, capacity
rights and co-investment opportunities. A typical seed transaction will also include various risk mitigation / protective
clauses, but within this section we will focus on the main drivers of potential returns to the seed investor.
As shown in Chart 1, we provide an illustration of the potential enhancement to returns that a seed investor could
achieve in any one year over and above a standard hedge fund investment.
In this illustrative example, we assume a $50m seed capital investment on 1.50% management fees and 17.5%
performance fees, a gross fund performance of 9%, additional fund expenses of 0.50%, a gross revenue share
participation of 20%, and average fees charged by the manager on third party capital of 1.35% management fees
and 17% performance fees.
The chart illustrates the enhancement to returns which can be achieved in any one year, depending on different
levels of AUM.
Chart 1: Enhancement to returns from revenue share participation in any single year of investment
In Chart 2, we provide an illustration of the fee savings on the seed capital invested given the revenue share earned
in each year while the seed capital is invested. At approximately $260m, the seed investor participates to 100% of
the gross profits earned on the seed capital with the revenue share participation offsetting management and
performance fees.
Investcorp-Tages Limited Page 4 of 17
www.InvestcorpTages.comEnhancing Returns: The Case for Hedge Fund Seeding
Chart 2: Fee offset at different levels of fund AUM, due to revenue sharing
In Chart 3, under the same set of assumptions, we provide an illustration of the cash flows, assuming that the
revenue share interests are earned for 10 years and peak assets of 15 times the invested capital are achieved by
year 4. This conservative assumption is meant to illustrate the revenue share enhancement to the Internal Rate of
Return (IRR) and the Multiple on Invested Capital (MOIC) from hedge fund seeding, even at lower levels of AUM
multiples for a single transaction, although most seed investors would be targeting a higher multiple than this.
Chart 3: Single transaction returns with and without revenue share participation
Investcorp-Tages Limited Page 5 of 17
www.InvestcorpTages.comEnhancing Returns: The Case for Hedge Fund Seeding
SEEDING RETURNS AT A PORTFOLIO LEVEL
To demonstrate how seeding can significantly enhance risk-adjusted returns to investors at a portfolio level, we
used a Monte Carlo process to simulate the potential return distribution of hedge fund portfolios, with and without
a revenue share participation. We assumed each portfolio to be composed of six individual funds, whose strategy
was assigned independently and probabilistically using the strategy’s relative AUM weight in the HFRI indices
(i.e., the greater the AUM, the greater the likelihood of a strategy being assigned). For the sake of simplicity in this
example, each fund received a similar capital allocation. For each portfolio, we created a return stream for each
underlying fund by randomly selecting a month of returns, applied consistently across strategies, and allowing for
resampling of each month. By bootstrapping these observations, we created 10 years of fund return data for each
simulated portfolio. We also assumed that a loss of greater than 15% from starting capital triggered a redemption
after the typical three-month redemption notice, and therefore resulted in the fund’s exit from the portfolio and a
cessation of the revenue share participation. The AUM path of each fund in the portfolio was derived from
the asset grid detailed in the Appendix. We assumed that capital, even if available, was not recycled during the
investment period6.
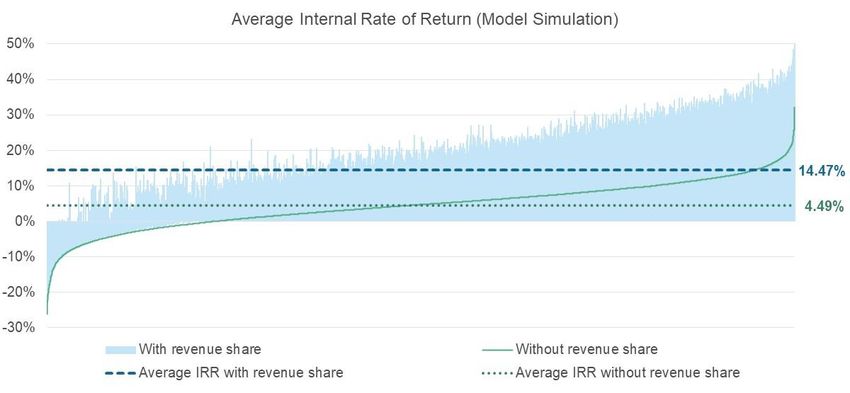
Over a sample of 10,000 iterations, the average portfolio without revenue share participation resulted in a MOIC of
1.14x with an IRR of 4.49%, very similar to the median portfolio observation. With revenue share participation, the
average MOIC was 1.71x, which represents 5 times the average profits earned without revenue share participation.
Table 1 displays the range of modelled returns.
Table 1: Seeding model simulation – distribution of returns (with no recycling of capital)
No Revenue Share With Revenue Share
Sample MOIC IRR MOIC IRR
Max 2.15x 32.22% 4.82x 50.01%
Mean 1.14x 4.49% 1.71x 14.47%
Median 1.13x 4.71% 1.55x 14.56%
Min 0.87x -7.56% 0.90x -5.74%
Chart 4 shows the IRR distribution of the 10,000 portfolio simulations, with revenue share and without revenue
share participation, and from lowest to highest. Revenue share participation increases the average IRR from 4.49%
to 14.47%.
Chart 4: Seeding model simulation – distribution of IRR observations (with no recycling of capital)
6
All returns are shown net of manager fees, but do not include any costs or fees associated with managing the seeding
portfolio. Further details on the assumptions and calculation methodology behind the model are included in the Appendix.
Investcorp-Tages Limited Page 6 of 17
www.InvestcorpTages.comEnhancing Returns: The Case for Hedge Fund Seeding
Chart 5 shows the MOIC distribution of the 10,000 portfolio simulations, with revenue share and without revenue
share participation, and from lowest to highest. Revenue share participation increases the average MOIC from
1.14x to 1.71x.
Chart 5: Seeding model simulation – distribution of MOIC observations (with no recycling of capital)
It is notable that, with revenue share participation, the mean MOIC is greater than the median MOIC, illustrating
the positive skew in returns from seeding. This is intuitive as the seed investor is not exposed to the costs of
underlying managers and therefore the revenue share can only be a positive contribution to returns. Where a fund
underperforms, there is no additional loss to that incurred in the portfolio without revenue share participation (to
the contrary, there can still be a contribution from revenue share participation). However, the funds that outperform
tend to raise assets and consequently contribute to the revenue share, and therefore to a higher average multiple
for portfolios in the higher deciles of modelled returns. This right tail skew to returns from seeding can be seen in
Chart 6 below.
Chart 6: Seeding model simulation – histogram of MOIC observations (with no recycling of capital)
Investcorp-Tages Limited Page 7 of 17
www.InvestcorpTages.comEnhancing Returns: The Case for Hedge Fund Seeding
WHY DIVERSIFICATION OF SEED TRANSACTIONS MATTERS
Dispersion between single transactions can be high. Using the same methodology above, we selected only
the first transaction in any portfolio (i.e., 10,000 iterations). Keeping in mind that this model simulation includes a
15% drawdown trigger, with 3 months to exit the position, the range of outcomes for a single transaction without
revenue share participation is large, namely the worst transaction observation had a drawdown of 44% (or MOIC
of 0.56x) and the best transaction observation had a MOIC of 2.50x. A seeding portfolio of 6 transactions, without
revenue share participation, exhibited a much tighter range of outcomes with a worst portfolio observation of a
29% drawdown (or 0.71x MOIC) and a best portfolio observation with a MOIC of 2.15x. The median and mean
outcomes were very similar.
When adding in the revenue share participation, the benefits of diversification are even more pronounced. The
worst observations have a similar profile to the differences exhibited with no revenue share (given that the worst
observation comprises a series of poor transactions outcomes, each of which are individually unlikely to raise
assets). Unsurprisingly, the correlation between weak performance and poor asset raising is high. However, the
median observation is a MOIC of 1.23x across the single transaction population set, as compared to a MOIC of
1.55x across the portfolio population set. The best outcome in the single transaction population set was a MOIC of
5.74x, as compared to a MOIC of 4.82x across the portfolio population set.
Intuitively this makes sense, as a revenue share participation can be thought of as a fund investment plus a
long call option on the economic success of the manager. A portfolio of transactions can be thought of in terms of
a diversified portfolio of fund investments, with a lower expected worst case loss scenario than any one single
transaction, plus a portfolio of call options which are floored at zero value. By diversifying the number of
seed transactions that an investor makes, the investor increases the probability that one or more of these
options will pay off and increase overall returns. As shown in Table 2, this profile provides for a positively convex
return distribution.
Table 2: Seeding model simulation – distribution of returns (with no recycling of capital)
Single Transaction Portfolio - without recycling
MOIC Without revenue share With revenue share Without revenue share With revenue share
Max 2.50x 5.74x 2.15x 4.82x
Mean 1.14x 1.70x 1.14x 1.71x
Median 1.13x 1.23x 1.13x 1.55x
Min 0.56x 0.56x 0.71x 0.72x
COMPARISON TO PRIVATE EQUITY STAKES IN ASSET MANAGERS
Some investors compare seeding to private equity investments which purchase a minority stake in alternatives
asset managers. Although both strategies are exposed to the asset raising and performance success of the
underlying asset manager, the strategies are quite different and are exposed to different risks and rewards.
Private equity funds investing in minority equity interests of alternative asset managers (commonly referred to as
“GP stakes investing”) pay for a minority equity stake, typically between 15% and 25%, in the management
company or general partner of an established manager. This equity is exposed to the revenues and costs of the
manager, as opposed to a seeding or acceleration transaction, where the investor typically receives 20% – 25%
of the gross revenues of an emerging manager but does not pay for this. For a manager with 40% – 60% gross
margins, a 20% revenue share participation, if perpetual, is the equivalent of a 33% – 50% equity stake.
In the case of the GP stake, the investor is typically able to make an attractive yield from day one, by investing in
an illiquid equity stake in the already established manager. This equity can increase in value if asset growth and
performance is strong. However, this can also decrease in value if assets decline or performance is poor, to nil
value in the extreme scenario of a manager going into liquidation.
The seed investor on the other hand is invested for a limited time in the manager’s underlying fund (typically
2 – 3 years), which is often comprised of liquid securities which can be redeemed at the end of the commitment
period. The fund can also be redeemed in the event of a defined loss (e.g., a 15% drawdown) or a breach of
covenants such as investment guidelines.
Investcorp-Tages Limited Page 8 of 17
www.InvestcorpTages.comEnhancing Returns: The Case for Hedge Fund Seeding
Both transactions typically have similar types of protections negotiated to protect the economic interest in the
manager, such as consent and information rights. In the case of the GP stakes investor, the remedy to a breach of
one of these rights could be a contractual claim against the manager. In the case of the seed investor, the remedy
could be a contractual claim, but more importantly this typically results in a redemption trigger event and the right
to redeem the seed capital on standard redemption terms.
Both investment strategies have attractive characteristics which can meet the different needs of investors.
However, it can be challenging to make a like-for-like comparison between the two strategies when using traditional
metrics. This is due to the mismatch between the term over which the seed capital is at risk (the fund investment
period is typically 2-3 years) and the term over which the gross revenue share is potentially earned (the transaction
period is typically 10+ years). This can make direct comparison of traditional metrics potentially misleading and we
illustrate this by modelling a seed portfolio where recycling of capital continues over a similar measurement period
to a typical private equity fund.
Using the same underlying assumptions, we rerun the model simulation but, in this case, we assume that capital
is recycled continuously within a 10-year period to approximate the experience of a private equity investor. In this
case we assume 18 transactions are executed over a 7-year period, with full return of the fund investments after
10 years (which can be achieved by standard fund redemptions rather than the secondary market sale required by
a GP stakes business). We calculate an embedded value for the revenue share stakes after 10 years, by
discounting forecast cashflows at a 30% discount rate to simulate a sale of the underlying revenue share stakes,
similar to the experience of a private equity investor at the end of the life of a closed ended vehicle.
Table 3 illustrates the multiple expansion by deploying capital over a 10-year period. The average MOIC with
revenue share participation was 3.0x across 10,000 simulations. Of this, 85% is comprised of realised profits
(i.e., a distribution to paid in capital (DPI) of 2.56x, prior to the sale of any residual revenue share interests).
Chart 7 displays the profile of the MOIC with and without recycling of capital. We believe that this multiple would
be the appropriate metric to use when comparing these two different strategies.
Table 3: Seeding model simulation – mean / median returns (with recycling of capital)
Portfolio - without recycling Portfolio - with recycling
Without revenue share With revenue share Without revenue share With revenue share
Sample IRR MOIC IRR MOIC IRR MOIC IRR MOIC
Mean 4.49% 1.14x 14.47% 1.71x 4.61% 1.48x 15.02% 3.00x
Median 4.71% 1.13x 14.56% 1.55x 4.73% 1.42x 14.97% 2.70x
Chart 7: Seeding model simulation – average MOIC per year
Investcorp-Tages Limited Page 9 of 17
www.InvestcorpTages.comEnhancing Returns: The Case for Hedge Fund Seeding
WHY MID-MARKET SEEDING REPRESENTS GOOD VALUE
If the objective for an investor is to maximise the IRR and MOIC on their seed capital, then we believe the ideal
seed or acceleration ticket size is in the $50m-$100m range. This, together with the principal’s capital and day-one
investors paying discounted fees, can often result in a launch size of $100m or higher.
A seed investor may target a minimum revenue share asset base multiple of 20 times the seed investment to target
the average IRR and MOIC multiples discussed in this paper thus far. However, although that may be the target
minimum asset base multiple for a single transaction, the average target asset base multiple across a portfolio will
likely be lower as there will be some managers in the portfolio who do not achieve that type of asset growth. We
would hope that more successful managers would raise a significantly higher multiple than this to partially offset
those managers that do not. Referring to the Appendix, Chart 10 shows the average portfolio asset base multiple,
which was generated in the model simulation without recycling, which peaked at an average of 13.21x.
In practice there are several strategies which are capacity constrained and so will be limited as to what the top end
of that multiple can be. Whenever a strategy is capacity constrained, this creates an upper boundary on asset
raising contribution to those successful managers that will contribute to the investors’ returns. Put another way, a
seed investment of $200m needs to achieve a peak asset base of $4bn in AUM to achieve the same returns as a
seed investment of $50m with a peak asset base of $1bn in AUM, all else being equal.
There is a limited universe of managers that can manage $4bn in AUM without materially degrading performance,
so the larger seed ticket has a lower number of managers and strategies available to choose from. Alternatively, if
capacity is not a key consideration, there is nothing preventing a successful manager from achieving the higher
asset base multiple by starting out with the lower seed capital investment.
The counterpoint to this is that a larger seed ticket may help a manager scale quicker in the earlier years, may
provide additional credibility to day one investors, and may be important in securing trading counterparty support
in certain strategies (e.g., balance sheet intensive strategies such as fixed income arbitrage).
It is also worth noting that larger seed tickets do not typically receive a higher revenue share participation, and
certainly not a pro-rata uplift, although this would be transaction specific.
Alternatively, if the ticket size is too small, a manager may find it challenging to scale to the important $100m
threshold and fees may cover too low a percentage of working capital. For this reason, we think the “sweet spot”
for seeding or acceleration is in this “mid-market” space, with the optimal ticket size being approximately $75m.
OTHER BENEFITS TO BEING AN EARLY-STAGE INVESTOR
Managers have been deploying creative solutions to incentivise investors to make an early-stage investment for
some time. These include offering founder and early bird share classes, with discounted fee structures to invest on
day one, within a fixed time or before achieving a certain capital raise objective. In addition, some managers offer
further discounts on fees for the early-stage investor once they achieve a certain AUM level, effectively a proxy for
achieving a certain level of working capital into the business from the existing investor base.
These hybrid approaches can be viewed as a revenue sharing of sorts, with a cap on the amount of revenue that
the manager forgoes and only payable for the period that the investor stays invested. They are typically much
cheaper structures to implement, often being able to be implemented via a side agreement rather than a lengthy
and complex revenue share negotiation, but with significantly less participation to the upside if the manager is
successful.
Typically, the seed investor will still negotiate capacity rights and low fees for any additional capital that is invested
on a non-locked basis. This can be particularly helpful to a manager when the seed investor is part of a broader
allocator business, where clients are looking for emerging manager exposure for low fees. Most seed investors will
also look to negotiate Most Favoured Nations (MFN) rights, whereby no other investors can receive more
favourable terms than the seed investor (although this would not be expected to apply to fees on the seed capital
during the seed capital commitment period).
Some seed investors also look to obtain exclusive access to the manager’s skills for a set period of time before
they are allowed to take on other investors. However, most seed investors are happy to enhance their potential
returns by participating in the growth of the business, preferring to leverage their strategic investor status in order
Investcorp-Tages Limited Page 10 of 17
www.InvestcorpTages.comEnhancing Returns: The Case for Hedge Fund Seeding
to obtain additional benefits (e.g., discounted fees, additional capacity rights, most favoured nation rights,
information transparency and a cap on fund expenses).
Over the past few years there has also been a significant increase in co-investing opportunities provided by
managers. Early-stage investors develop the relationships with managers which may provide access to
participation in these co-investment opportunities. This approach can provide access to a manager’s best ideas,
as well as taking a more concentrated position in these ideas than a manager may be willing or able to take in the
comingled fund. It is also used by some investors as a means of decreasing the overall cost ratio of investing with
a manager, as management fees (and possibly performance fees) associated with co-investments are often much
lower than the comingled fund. In the case of a seed investor, this is typically a contractual right built into the
seeding agreement.
FAVOURABLE REGULATORY CAPITAL CONSIDERATIONS
In addition to enhancing returns, seeding can present a regulatory capital cost effective way of investing in hedge
funds. This is due to the duration mismatch between the time the seed capital is invested in an underlying liquid
hedge fund and the period over which the insurance company or bank is receiving revenue share distributions.
For example, while the seed capital is invested, let us assume that for the hedge fund strategy that is seeded by
an insurance company attracts a Solvency II base capital charge of approximately 49% under the standard model.
Due to the strategic position that a seed investor is in, they are likely to be able to obtain full position level
transparency and so may be able to decrease this if an internal model is being used.
However, even if we assume that this is not the case, there can still be a material benefit in treatment because
while the seed investment is only invested for two to three years, the revenue share participation is received for a
much longer period so the charge is lower as a percentage of the overall returns than investing without a revenue
share participation.
VALUE CREATION OPPORTUNITIES
A seed investor is incentivised to maximise both performance on their seed capital while invested and to
maximise the revenue share participation via both asset raising and performance over the life of a transaction.
The seed investor is strongly aligned with the manager to maximise revenues and therefore the investor (or their
appointed asset manager) is incentivised to 1) help to raise capital, 2) help on business strategy and product
development and 3) advise on implementing the right operational infrastructure in order to scale and create a
sustainable business.
Professional seed investors will be resourced with experienced professionals who are able to help managers in
each of these areas. It can be extremely helpful to the manager if the seed investor has a distribution capability, a
strong network of early-stage investors, and the experience of raising capital for managers.
As the seed investor will often be the first institutional investor to perform due diligence on a manager, feedback
and impartial advice on fund structures, fund terms, best practice in operations, and fund governance can be
invaluable to helping a manager prepare for early-stage investors and can act as a “stamp of approval” from a
reputable seed investor. This can be both a competitive edge to securing the highest quality managers and an
advantage to raising the locked-up capital required to secure these transactions for clients.
Although the majority of revenue share participation is expected to derive from quarterly revenue share
distributions, transactions will typically include 1) provisions for consent and tag along rights in the event of the sale
of the business, 2) a mechanism or terms under which a manager can buy back the revenue share interest and 3)
rights to sell this economic interest to a secondary market buyer. With the increase in private equity funds seeding
GP stakes, we expect that opportunities will arise to sell gross revenue share stakes in successful managers,
especially where multiple product lines have been developed by the manager across more than one team.
Investcorp-Tages Limited Page 11 of 17
www.InvestcorpTages.comEnhancing Returns: The Case for Hedge Fund Seeding
CONCLUSION
Both increased barriers to entry and high industry margins available to emerging managers that can obtain scale,
offer an opportunity for seed investors to extract a significant liquidity premium for locking up capital and supporting
a hedge fund manager at an early stage in their life cycle. Seed investors can benefit from multiple streams of cash
flow including management fees, performance fees and carried interest earned on existing and future products that
a seeded manager may launch. This economic interest can be obtained at no additional cost to making an early-
stage investment in the manager’s fund, with multiple contractual risk mitigants which are heavily negotiated prior
to executing a transaction.
In return for making a seed or acceleration capital commitment, we believe that investors can achieve an average
of five times or greater the return on the same hedge fund investment without a revenue share participation.
However, seed transactions can be complex to negotiate and require an experienced team to source, due diligence,
structure and negotiate. This paper demonstrates the benefits of seeding via a portfolio approach to diversify
downside risk, and to benefit from the positive return convexity that a seeding portfolio can provide. Revenue share
participation continues after redemption of the seed capital which is typically invested in liquid underlying securities.
This presents a duration mismatch which can enhance risk-adjusted returns and provide a favourable regulatory
capital treatment as compared to investing directly in hedge funds without a revenue share participation.
When considering the return potential from seeding, one should look at the return profile of seeding in a systematic
way via a portfolio approach. By recycling capital over a term like that of a typical private equity fund, we believe it
is possible to achieve highly competitive returns on capital, while investing in a significantly more liquid underlying
asset class. The supply and demand dynamics in the hedge fund industry are currently favourable to seeding and
those capital providers who can commit capital at an early stage of the hedge fund life cycle. However, we believe
the key drivers to success is through correct partner selection, management of downside risk, and the availability
of resources to help managers build a sustainable business.
Investcorp-Tages Limited Page 12 of 17
www.InvestcorpTages.comEnhancing Returns: The Case for Hedge Fund Seeding
APPENDIX: MODEL ASSUMPTIONS AND CALCULATION METHODOLOGY
Model assumptions are shown in Table 4 below. For simplicity, we assumed a portfolio of 6 transactions of $50m
seed capital, each is deployed based on a transaction every 4 months (or 3 transactions a year). This is what is
referred to as the non-recycled portfolio, with the assumptions highlighted in green. For the recycled portfolio, we
assumed that each transaction that is redeemed is deployed the following month into another seeding transaction,
with a total of 18 transactions over 7.33 years, which are redeemed fully within 10 years. For simplicity and to be
prudent, we kept these investments cycles standard even though some of the transactions may have been available
for earlier recycling depending on performance.
Table 4: Seeding model simulation assumptions
Capital Revenue Share Revenue Seed Seed Average Average
Transaction Execution Commitment Redemption Redemption Transaction Revenue Share Termination Share Management Performance Management Performance Seed Expense
Transaction Lag (Months) (Month) (Months) Lag (Months) (Month) Strategy Commitment Term (Years) (Month) Participation Fees Fees Fees Fees Performance Cap
1 0 30 3 33 Sampled $50,000,000 10 120 20.00% 1.50% 17.50% 1.35% 17.00% Sampled 0.50%
2 4 4 30 3 37 Sampled $50,000,000 10 124 20.00% 1.50% 17.50% 1.35% 17.00% Sampled 0.50%
3 4 8 30 3 41 Sampled $50,000,000 10 128 20.00% 1.50% 17.50% 1.35% 17.00% Sampled 0.50%
4 4 12 30 3 45 Sampled $50,000,000 10 132 20.00% 1.50% 17.50% 1.35% 17.00% Sampled 0.50%
5 4 16 30 3 49 Sampled $50,000,000 10 136 20.00% 1.50% 17.50% 1.35% 17.00% Sampled 0.50%
6 4 20 30 3 53 Sampled $50,000,000 10 140 20.00% 1.50% 17.50% 1.35% 17.00% Sampled 0.50%
7 14 34 30 3 67 Sampled Recycled 10 154 20.00% 1.50% 17.50% 1.35% 17.00% Sampled 0.50%
8 4 38 30 3 71 Sampled Recycled 10 158 20.00% 1.50% 17.50% 1.35% 17.00% Sampled 0.50%
9 4 42 30 3 75 Sampled Recycled 10 162 20.00% 1.50% 17.50% 1.35% 17.00% Sampled 0.50%
10 4 46 30 3 79 Sampled Recycled 10 166 20.00% 1.50% 17.50% 1.35% 17.00% Sampled 0.50%
11 4 50 30 3 83 Sampled Recycled 10 170 20.00% 1.50% 17.50% 1.35% 17.00% Sampled 0.50%
12 4 54 30 3 87 Sampled Recycled 10 174 20.00% 1.50% 17.50% 1.35% 17.00% Sampled 0.50%
13 14 68 30 3 101 Sampled Recycled 10 188 20.00% 1.50% 17.50% 1.35% 17.00% Sampled 0.50%
14 4 72 30 3 105 Sampled Recycled 10 192 20.00% 1.50% 17.50% 1.35% 17.00% Sampled 0.50%
15 4 76 30 3 109 Sampled Recycled 10 196 20.00% 1.50% 17.50% 1.35% 17.00% Sampled 0.50%
16 4 80 30 3 113 Sampled Recycled 10 200 20.00% 1.50% 17.50% 1.35% 17.00% Sampled 0.50%
17 4 84 30 3 117 Sampled Recycled 10 204 20.00% 1.50% 17.50% 1.35% 17.00% Sampled 0.50%
18 4 88 30 3 121 Sampled Recycled 10 208 20.00% 1.50% 17.50% 1.35% 17.00% Sampled 0.50%
We assumed an average commitment period of 2.5 years, with a 3-month lag between expiry and redemption. This
is consistent with the industry averages, for example a recent survey showed an average of 45% of seed
transactions were locked for 3 years and an average of 48% were locked for 2 years or less over 2019 / 20207.
Chart 8 shows the portfolio cash flows for a non-recycled portfolio and a recycled portfolio if the gross performance
was assumed to be 9% across all transactions.
Chart 8: Cash flow example
We assumed a standard revenue share profile of a fixed 10-year participation at 20% of gross revenues. While
many transactions are perpetual in nature and we believe that a seed investor can obtain a higher participation
than 20%, we made this simplifying assumption for the purposes of uniformity.
We assumed that the seed investor pays “headline fees” on the seed investment, prior to any revenue share
participation which would indirectly decrease these fees. We assumed that the remaining capital raised pays an
7
Seward & Kissel 2020 Seed Transaction Deal Points
Investcorp-Tages Limited Page 13 of 17
www.InvestcorpTages.comEnhancing Returns: The Case for Hedge Fund Seeding
average of 1.35% management fees and 17.00% performance fees with no hurdle. This is in line with various
industry surveys, from HFR which recently reported an average of 1.36% / 17.97% across newly launched funds
to Preqin which recently reported average fees of 1.47% / 18.18% for emerging managers (less than $500m)8.
We compiled strategy buckets, referencing the AUM of the main strategies and sub-strategies in the hedge fund
industry and those that a seed investor would be likely to focus on (which we defined as having over $70bn in
AUM9). As shown in Table 5, these strategies account for 88.7% of the hedge fund industry AUM.
Table 5: Strategy AUM split
2019 AUM
Strategy Strategy Bucket > $70bn Strategy Totals Strategy %
HFRI Macro: Discretionary Thematic Index Macro $125,561
HFRI Macro: Multi-Strategy Index Macro $101,494
HFRI Macro: Systematic Diversified Index Macro $313,744 $540,799 18.4%
HFRI ED: Activist Index Event Driven $133,124
HFRI ED: Distressed/Restructuring Index Event Driven $204,682
HFRI ED: Multi-Strategy Index Event Driven $86,277
HFRI ED: Special Situations Index Event Driven $398,564 $822,647 27.9%
HFRI EH: Equity Market Neutral Index Equity Hedge $71,146
HFRI EH: Fundamental Growth Index Equity Hedge $127,774
HFRI EH: Fundamental Value Index Equity Hedge $520,827
HFRI EH: Sector - Technology/Healthcare (Total) Index Equity Hedge $99,829 $819,576 27.8%
HFRI RV: Fixed Income-Asset Backed Index Relative Value $99,201
HFRI RV: Fixed Income-Corporate Index Relative Value $156,100
HFRI RV: Multi-Strategy Index Relative Value $508,587 $763,888 25.9%
$2,946,910
For each transaction, we sampled this strategy universe, based on a random selection out of the percentile of AUM
that the random seed mapped to. This aimed to achieve an AUM split across the simulated population of
transactions and portfolios that we constructed, that reflects the AUM split across the main hedge fund strategies
in the industry.
In order to simulate transaction and portfolio returns, we used index returns from the 14 HFRI sub-strategy indices
over the period of 31 January 2008 to 30 April 2021 (160 observation points, thereby ensuring our sample period
would include crisis periods such as the GFC in 2008-2009, the European Crisis in 2011 and the Pandemic Crisis
in 2020). Recognising that indices tend to exhibit a lower volatility than the underlying fund components, we volatility
adjusted the sub-strategy index returns, while controlling for the same mean return. We did this by adjusting each
observation by a “loading factor” which was calculated as a ratio of the volatility of the current sub-strategy index
fund components (over a 24-month lookback period from April 2021), over the relevant sub-strategy index volatility
over the same time period. The “loading factors” are shown in Table 6 below.
Table 6: Index returns: “loading factor” calculation using a 24-month lookback period
Average Volatility Underlying
Sub-Strategy Index Volatility Managers Loading Factor
HFRI Macro: Discretionary Thematic Index 7.56% 16.49% 2.2x
HFRI Macro: Multi-Strategy Index 7.16% 15.90% 2.2x
HFRI Macro: Systematic Diversified Index 5.65% 13.21% 2.3x
HFRI ED: Activist Index 21.40% 23.10% 1.1x
HFRI ED: Distressed/Restructuring Index 11.18% 16.75% 1.5x
HFRI ED: Multi-Strategy Index 9.81% 17.02% 1.7x
HFRI ED: Special Situations Index 14.71% 18.23% 1.2x
HFRI EH: Equity Market Neutral Index 3.49% 10.19% 2.9x
HFRI EH: Fundamental Growth Index 14.35% 19.95% 1.4x
HFRI EH: Fundamental Value Index 16.59% 23.11% 1.4x
HFRI EH: Sector - Technology/Healthcare (Total) Index 11.16% 17.63% 1.6x
HFRI RV: Fixed Income-Asset Backed Index 10.38% 10.78% 1.0x
HFRI RV: Fixed Income-Corporate Index 9.68% 11.77% 1.2x
HFRI RV: Multi-Strategy Index 5.98% 10.54% 1.8x
We then simulated a return stream over 240 months, by mapping each monthly observation (i.e., month 1, 2, 3, …
240) to a random month selected from an observation period of 31 January 2008 to 30 April 2021 (160 observation
8
Preqin Global Hedge Fund Report 2021
9
HFR Global HF Industry Report 2019
Investcorp-Tages Limited Page 14 of 17
www.InvestcorpTages.comEnhancing Returns: The Case for Hedge Fund Seeding
points, e.g., month 1 = 30 April 2016, month 2 = 31 August 2014, month 3 = 31 October 2016, …. Month 240 = 28
February 2019).
For each monthly observation we mapped the month to the adjusted sub-strategy index return for that month across
all the strategies, as defined in Table 5. For each transaction, based on the random strategy sampled, we
bootstrapped a return stream for that transaction, starting from the subscription date to the end of the revenue
share period. So, for each transaction in a single iteration of a portfolio, each monthly return in the portfolio return
matrix came from the same random monthly sub-strategy index return that had been mapped to the relevant
monthly observation point. However, no serial correlation was assumed between months as these had been
randomly selected, as described previously.
For each simulated transaction, an assumption was made that if there was a cumulative drawdown of 15% or more,
from par, at any point in the return stream, the fund would be redeemed with a 3-month lag (i.e., allowing for
potential further losses or recovery, as is the case in the real world).
Eighteen transaction return streams were calculated per simulation and two portfolios were constructed, a “portfolio
without recycling” which was comprised of the first 6 transactions and a “portfolio with recycling” which was
comprised of 18 transactions.
These cash flows were then used to calculate a simulated return stream across 10,000 iterations, to calculate a
distribution of IRRs and MOICs for a single transaction, a portfolio with recycling of capital and a portfolio without
recycling of capital. The resulting mean IRR of approximately 4.5% appears reasonable as compared to the HFRI
Fund Weighted Composite Index 10-year annualised return of 4.7%, 5-year annualised return of 7.8% and 3-year
annualised return of 8.32%10.
Once we had a simulated IRR for each transaction over the seed investment period, we created an asset base grid
to map the average asset base available to earn a revenue share on, in each year for that transaction. Chart 9
displays the asset base grid and is derived from what we believe the average manager can achieve, given this
performance. Note that the range of potential outcomes within this group is wide in practice, but for the purposes
of illustrating the enhancement available to seed investors, in particular at a portfolio level, we believe this
simplification provides a good “rule of thumb” from which to begin. It is also consistent with what we believe is the
target minimum peak asset raise of a typical institutional seed investor when entering into a transaction, i.e., a
minimum peak asset target of 20 times the seed capital invested (e.g.., $1bn in AUM for a $50m seed investment
or $1.5bn in AUM for a $75m seed investment).
Chart 9: Asset Base Grid
Next, we mapped the simulated return stream per transaction against the asset grid to calculate a simulated asset
raise and AUM profile for each fund. We calculated the management and performance fees and allocated these
cash flows across each portfolio to calculate a gross revenue share per year, which was then allocated on a cash
flow basis (assuming management fees are paid quarterly, and performance fees are paid annually, each with a
10
HFR as of April 2021
Investcorp-Tages Limited Page 15 of 17
www.InvestcorpTages.comEnhancing Returns: The Case for Hedge Fund Seeding
one-month lag). This enabled us to then calculate the IRR and MOIC per portfolio, “with no recycling” and “with
recycling” of capital, and subsequently run 10,000 iterations of these portfolios to draw conclusions on the
distribution of outcomes.
Chart 10 shows the average asset base profile at a portfolio level, with and without recycling of capital, across the
10,000 simulations.
Chart 10: Average Portfolio Revenue Share Asset Base per year
Note that these assumptions resulted in an average transaction life of 5.9 years across the simulation. This is
consistent with the “real world” in that there is a high attrition rate in hedge funds which is highly correlated to
performance. Per one study on survivorship, only 76% of managers survive past 3 years, 62% past 5 years and
the “breakeven point” at which 50% of managers remain up and running is somewhere between 6 and 7 years11.
11
Goldman Sachs Hedge Fund Survivorship Study 2020
Investcorp-Tages Limited Page 16 of 17
www.InvestcorpTages.comEnhancing Returns: The Case for Hedge Fund Seeding
IMPORTANT INFORMATION
The information contained herein is sourced from third parties and/or provided by Investcorp-Tages. Investcorp-Tages is the
brand name under which Tages Capital LLP (“Tages Capital”) and Investcorp Absolute Return Investments LLC (“IARI”) operate.
Tages Capital is authorised and regulated by the Financial Conduct Authority in the United Kingdom. Tages Capital is
incorporated in England and Wales under registered number OC364873 with registered office 39 St James’s Street, London,
SW1A 1JD. Investcorp Absolute Return Investments LLC is registered with the U.S. Securities and Exchange Commission under
with CRD number 306860 / SEC number 801-118192 with registered office 280 Park Avenue, New York, NY 10017.
Investcorp-Tages is a 50/50 joint venture (“JV”) between Investcorp S.A. and Tages S.p.A formed in May 2020 from merging
Investcorp’s Absolute Return Investments business (IARI) and Tages Capital, the absolute return subsidiary of Tages S.p.A. IARI
is an indirect wholly owned subsidiary of Investcorp S.A. organized in 1996, and Tages Capital is an indirect wholly owned
subsidiary of Tages S.p.A organized in 2011. IARI provides investment management (“IM”) services to accounts that prior to the
JV were clients of each of Investcorp Investment Advisers LLC and Investcorp Investment Advisers Limited, each an indirect
wholly owned subsidiary of Investcorp S.A. Similarly, Tages Capital will continue to provide IM services to accounts that prior to
the JV were existing clients of Tages Capital.
This material is also issued and approved by Investcorp Securities Limited, which is regulated by the Financial Conduct Authority
(“FCA”). The material in this communication is not investment research or a research recommendation as defined by the FCA
rules and has accordingly not been prepared in accordance with any legal requirements designed to promote the independence
of investment research nor is it subject to any dealing prohibition on dealing ahead of the dissemination of investment research.
To the extent that the information in this material reflects the views of Investcorp Securities Limited or its affiliates, this information
and views expressed are subject to change without notice to you. Investcorp Securities Limited does not guarantee its accuracy
or completeness. Investcorp Securities Limited, a private limit ed company incorporated in England and Wales under company
number 02217792. Registered Office: 48 Grosvenor Street, London, W1K 3HW, United Kingdom. Unless and until you execute
a direct agreement with us for managed account or advisory services, Investcorp Securities Limited will not be responsible for
providing you with protections that would apply if you were a regulatory customer of Investcorp Securities Limited, and will not be
giving you regulated financial advice.
This document does not create any legally binding obligations on the part of Investcorp-Tages and/or its affiliates. All opinions
and estimates included herein are subject to change without notice and Investcorp-Tages is under no obligation to update the
information contained herein. Investcorp-Tages does not make any representations or give warranties that the information and/or
material contained in this document is accurate or complete. Investcorp-Tages assumes no responsibility or liability for any errors
or omissions with respect to the information contained herein.
Without limitation, this document does not constitute investment advice and does not constitute an offer or recommendation to
buy or sell an investment. This document should not be relied upon as including sufficient information to support an investment
decision. Prospective investors should seek professional advice before making any investment decision.
Past performance (whether real or proxy) should not be viewed as a guide to future performance. Investment and/or products
described herein carries the risk of potential total loss of capital. Alternative Investment fund investments are speculative in nature
and involve a high degree of risk. There can be no assurance that a fund’s investment objectives will be achieved, and investment
results may vary substantially over time. Investments in alternative investment funds are not intended to be a complete
investment program for any investor. There is no secondary market for an investor’s interest in alternative investment funds and
none is expected to develop. Alternative Investment funds are generally not registered under the Investment Company Act of
1940 and accordingly are not extensively regulated. Opportunities for redemption and transferability of interests are restricted, so
investors may not have access to capital when it is needed. Leverage may be employed in these funds, which can make
investment performance volatile. Valuation of the securities in alternative investment funds may involve uncertainties and the
exercise of judgment and could adversely affect the value of any investment in hedge funds. An investor should not make an
investment in hedge funds unless the investor is prepared to lose all or a substantial portion of its investment.
Certain information contained herein may constitute forward-looking statements which, owing to various risks and uncertainties,
could result in actual events or results or the actual performance of an investment differing materially from those reflected or
contemplated in such forward-looking statements. This document is being provided on a confidential basis and is for informational
purposes only.
If you wish to invest in a specific investment or product managed by Investcorp-Tages you should refer to the risk warnings in the
relevant prospectus for that product or investment. Information and details of such investments, managers or their products or
laws or circumstances may change, and it is the requirement of any investor or those making or considering to make such
investments that they conduct due diligence on any and all investments made or considered. All investments should be made
with discretionary capital set aside strictly for speculative purposes. Offers in the US may only be made at the time a qualified
offeree receives the related confidential offering memorandum for a specific fund describing the offering and executes a related
subscription agreement provided by N.A. Investcorp LLC (“NAILLC”). Any interests in securities of any funds shall not be offered
or sold in any jurisdiction in which such an offer, solicitation or sale would be unlawful until the requirements of the laws of such
jurisdiction have been satisfied.
Investcorp-Tages Limited Page 17 of 17
www.InvestcorpTages.comYou can also read