CIT Y OF ATLANTA DEPARTMENT OF FINANCE 2021 FISCAL CONDITION OF THE CIT Y - ROOSEVELT COUNCIL JR., CFO

Page created by Brian Newman
 
CONTINUE READING
CIT Y OF ATLANTA DEPARTMENT OF FINANCE 2021 FISCAL CONDITION OF THE CIT Y - ROOSEVELT COUNCIL JR., CFO
CIT Y OF ATLANTA
     DEPARTMENT OF FINANCE
2021 FISCAL CONDITION OF THE CIT Y

       ROOSEVELT COUNCIL JR., CFO
CIT Y OF ATLANTA DEPARTMENT OF FINANCE 2021 FISCAL CONDITION OF THE CIT Y - ROOSEVELT COUNCIL JR., CFO
AGENDA
        Introduction
     Economic Outlook
Revenue Impacts by Category
      Federal Funding
Operating Budget Development
         Revenues
       Expenditures
        Trust Fund
        Impact Fees
       Fund Balance
    Debt & Investments
           Q&A
CIT Y OF ATLANTA DEPARTMENT OF FINANCE 2021 FISCAL CONDITION OF THE CIT Y - ROOSEVELT COUNCIL JR., CFO
ECONOMIC OUTLOOK
CIT Y OF ATLANTA DEPARTMENT OF FINANCE 2021 FISCAL CONDITION OF THE CIT Y - ROOSEVELT COUNCIL JR., CFO
ECONOMIC OUTLOOK

COVID-19
The COVID-19 pandemic has already caused sharp drops in employment and economic growth. Unlike the 2008 financial
crisis, COVID-19 is an external “shock” that is disrupting the entire economy, rather than originating from within the financial
system itself. This is an unprecedented and uncertain environment, with serious impacts on the City of Atlanta’s General Fund
and future revenues. There are several major categories of municipal revenue that will be affected by the pandemic differently
based on the underlying economic activity from which they are derived.
• Atlanta has benefited from a strong US economy that had seen growth in recent years, but even before COVID-19, many
  economists were forecasting a recession or slowdown of economic activity. Leading up to the current circumstances, the City
  of Atlanta was well positioned to be able to withstand these impacts due to a variety of reasons, including:
• Lower unemployment and higher median household income than the national average
• Diversified economy that isn’t overly reliant on industries sensitive to the COVID-19 public health impacts (e.g. oil & gas,
  hospitality)
• Diversified tax revenue structure that isn’t dependent on a single source of revenue (e.g. personal income tax, sales tax)
• The City of Atlanta’s General Fund has received between $687M - $717M in revenue per year since FY17 with the largest
  sources of funds being property tax (~30%), licenses & permits (~18%), local options sales tax (~17%) and public utility,
  alcoholic beverages & other (~16%).

Source: Deloitte City of Atlanta Revenue Assessment 4/14/20                                                                        4
CIT Y OF ATLANTA DEPARTMENT OF FINANCE 2021 FISCAL CONDITION OF THE CIT Y - ROOSEVELT COUNCIL JR., CFO
ECONOMIC OUTLOOK

Considering varying revenue impacts including citywide business closures and recovery rates
presents a range of possible revenue impacts. As the public health outlook becomes more clear, the
economic projections and range of financial estimates will sharpen in focus as well.
• Short Term Impacts: Approx. 40% of the General Fund revenues come from property taxes and
  public utility franchises and are secure in the near term. Sales tax and permit/license revenues are
  vulnerable in the short term due to business closures and reduced household spending. General
  Fund revenues will see a decline of up to approximately $40M in FY20. In FY21, the City is
  expecting General Fund revenue to drop to $614M.
• Long Term Impacts: Much of the General Fund’s revenue comes from property tax (~30%), and the
  effects of COVID-19 on those revenues will lag by roughly 3-years. Therefore, there may be a decline
  that ranges from $9M - $46M between FY23 – FY24. Additionally, based on how long businesses
  are shut down, we could see varying rates of overall recovery depending on closures’ impact to
  unemployment and consumer spending.

Source: Deloitte City of Atlanta Revenue Assessment 4/14/20
                                                                                                     5
CIT Y OF ATLANTA DEPARTMENT OF FINANCE 2021 FISCAL CONDITION OF THE CIT Y - ROOSEVELT COUNCIL JR., CFO
COVID-19 POLICY RESPONSE AND ECONOMIC IMPACT

                                               6
CIT Y OF ATLANTA DEPARTMENT OF FINANCE 2021 FISCAL CONDITION OF THE CIT Y - ROOSEVELT COUNCIL JR., CFO
OVERVIEW OF MACROECONOMIC SCENARIOS

                               GDP YoY % Change
15.00%                                                                                           HIGH                                     MEDIUM                                  LOW

 5.00%                                                                              LONG HARD TREK TO RECOVERY                  FINANCIAL CRISIS & DEEP                      THE COVID-19
                                                                                                                                      RECESSION                               RECESSION
                                                                                •    COVID-19 outbreaks continue for
 -5.00%                                                                              2 years                               •   COVID-19 affects both the         •   GDP falls by 2x the average
                                                                                                                               economy’s supply side and             postwar recession
-15.00%                                                                         •    Consumers pause big-ticket                demand side
           2017 2018 2019 2020 2021 2022 2023 2024 2025                              purchases                                                                   •   GDP begins to recover in late
                                                                                                                           •   Shrinking economy uncovers            2020 as the disease is brought
                   Consumer Spending YoY % Change                               •    US economy struggles to recover           industry weaknesses                   under control
15.00%                                                                          •    GDP drops steeply in 2020,            •   Lending dries up, throws the      •   Aggressive monetary and fiscal
                                                                                     remains low in 2021 with high             economy into a recession.             policy jump-start the recovery
 5.00%                                                                               unemployment
                                                                                                                           •   Policy intervention creates       •   GDP falls 2.3% in 2020 but starts
 -5.00%                                                                         •    Growth picks up by 2023,                  demand to end recession by            recovering in 2021
                                                                                     remains high due to pent-up               mid-2021
-15.00%                                                                              consumer demand                                                             •   GDP rises at a fast rate in 2022
            2017 2018 2019 2020 2021 2022 2023 2024 2025                                                                   •   2022 sees a strong recovery           and 2023
                                                                                •    Scenario accounts for
                       Unemployment YoY % Change                                     accommodative monetary and
                                                                                     fiscal policy
15.00%

10.00%

 5.00%                                                                                  Across scenarios, the General Fund is impacted in the long term by several overarching
                                                                                    economic trends including, but not limited to GDP, consumer spending, unemployment, and new
 0.00%                                                                                                                       housing starts.
           2017 2018 2019 2020 2021 2022 2023 2024 2025
      Note: Economic indicators are shown as a calendar year, not fiscal year
                                                                                                                       Source: Deloitte U.S. Economic Forecast
            Full model assumptions located in Appendix
CIT Y OF ATLANTA DEPARTMENT OF FINANCE 2021 FISCAL CONDITION OF THE CIT Y - ROOSEVELT COUNCIL JR., CFO
KEY CONSIDERATIONS
There are a number of macro-level “unknowns” that policymakers and officials must navigate as the COVID-19 pandemic progresses, including public health
developments, related public policy responses, and associated economic and financial impacts

                Public Health                                           Public Policy                                     Economics & Finance

•   Current infection rate and spread                   •   Duration of shelter-in-place orders                •   Depth and severity of economic downturn
•   Resiliency of hospital and public health            •   Potential escalation to full lockdown (e.g.        •   Effects of unemployment and retail
    system                                                  Wuhan or Lombardy)                                     business closures on other sectors
•   Immunity and reinfection rates for                  •   Economic relief for small business and             •   Impact on real estate markets
    recovered individuals                                   corporations
                                                                                                               •   Resilience of global supply chains and
•   Likelihood of “second wave” in fall 2020 or         •   Monetary assistance and direct aid to                  impact on international trade
    beyond                                                  unemployed                                         •   Financial market liquidity & health
•   Timeline for vaccine development, testing,          •   Federal stimulus funding and aid for state         •   Risk to major financial institutions
    and approval                                            and local governments

      This revenue forecast was prepared during the highly dynamic stages of the initial COVID outbreak, with limited access to reliable
                        econometric data, information on relevant operational drivers, or revenue collection formulas
CIT Y OF ATLANTA DEPARTMENT OF FINANCE 2021 FISCAL CONDITION OF THE CIT Y - ROOSEVELT COUNCIL JR., CFO
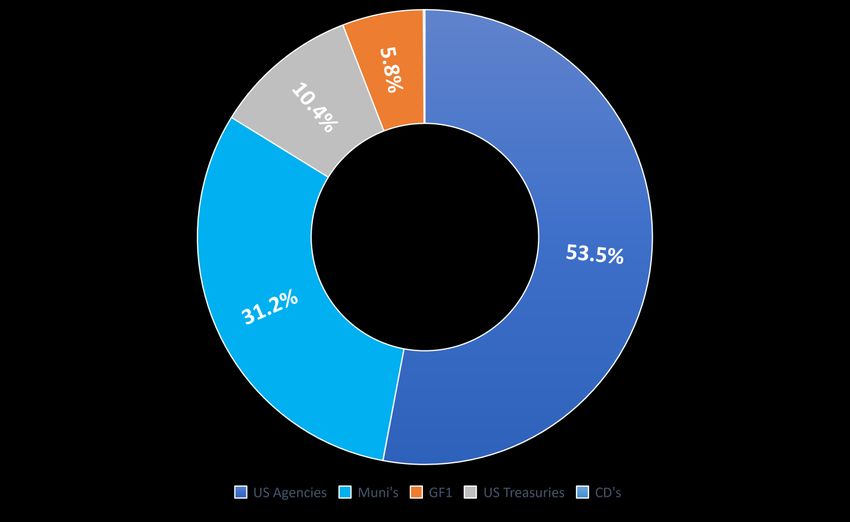
KEY RESULTS – INITIAL ANALYSIS
An initial assessment of the economic impact of COVID-19 have been identified in a high, medium, and low scenario over a 5-year period, each based on a fixed business closure
period and subsequent recovery curve
                                                        Total Revenue ($M)                                                                  Key Insights
        $740
        $720       $696                                                                   $709            $722      • All scenarios assume near-term economic
                                                     $686                                                 $702
                                                                                                                      recession
        $700
        $680
                                                                                          $683                      • High scenario implies likelihood for an extended
        $660                                                                                              $658
                                                      $629                                                            economic depression
        $640
        $620
                                                     $583                                 $634                      • Up to $109M potential decline in overall
        $600                                                                                                          municipal revenue by FY21
        $580
                       FY19          FY20             FY21       FY22           FY23      FY24       FY25
                                                                                                                    • Business closures lead to near-term shock for
                                                     High      Medium           Low                                   consumer spending and spike in unemployment
                                                       FY19    FY20     FY21      FY22    FY23    FY24      FY25

                  HIGH               Total Revenue
                                                                                                                    • Sales tax and business license revenue affected
                                                       696.1   638.0    583.4     667.7   680.1   634.1     657.6
          9 Month Business Closure       ($M)                                                                         immediately in FY20
                MEDIUM               Total Revenue
                                                       696.1   640.4    628.7     682.4   707.4   683.1     701.9
                                         ($M)
          6 Month Business Closure
                                                                                                                    • Hit to property tax revenues lags by approximately
                   LOW               Total Revenue                                                                    3 years
                                         ($M)          696.1   647.7    685.9     704.2   718.0   708.8     721.7
          4 Month Business Closure
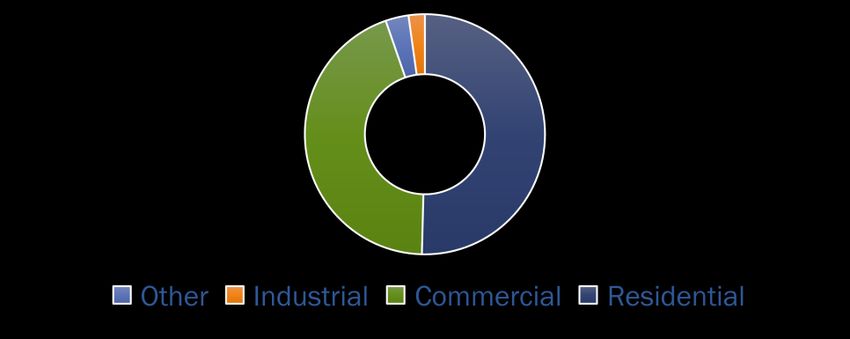
CIT Y OF ATLANTA DEPARTMENT OF FINANCE 2021 FISCAL CONDITION OF THE CIT Y - ROOSEVELT COUNCIL JR., CFO
REVENUE SUMMARY

                  10
R E V E N U E I M P A C T S B Y C AT E G O R Y
PROPERTY TAXES
               Amounts levied on all real, personal, and public utility property within the corporate limits of the City
                                          Property Tax Breakdown                                                                   Revenue Forecasts ($M; FY20 – FY25)
                                                                                                           $235
                                                                                                                218.94
                                                                                                           $225                                                                                  215.00
                                                                                                           $215
                                                                                                           $205                                                                     208.79       202.06
                                                                                                           $195
                                                                                                           $185                                                                    189.63
                                                                                                                                                                                                 189.12
                                                                                                           $175
                                                                                                                                                                     170.48
                                                                                                           $165
                                                                                                                   FY19          FY20      FY21         FY22        FY23         FY24        FY25
                                                                                                                                         High        Medium          Low

                   Growth is reliant on three key underlying factors: housing stock, local price levels,             At approx. 30% of FY19 municipal revenues, the anticipated declines in property
Key Insights

                   and new housing starts (or) foreclosures                                                          taxes represent a major long-term revenue risk

                   The Case-Schiller Index experienced a roughly 30% decrease in housing prices from                 Based on historical comparisons and property assessment cycles, the impact on property
                   peak to trough from 2008-2013                                                                     tax revenues is assumed to lag approx. 3 years

                                                              Key Assumptions
                                                                                                                                                                              % FY19 REVENUE
     •          Impact is delayed by 3 years and is based on the reduction in property values following the 2008 recession                                                    31.5% Property
                                                                                                                                                                               17.7% Licenses & Permits
     •          Treated 2008 housing market decline as “medium” scenario with multiplier applied for high and low alternatives
                                                                                                                                                                               16.8% Sales Tax
                                                                                                                                                                               15.5% Public Utility
                                                                                                                                                                               15.1% Other
  Sources: Fulton County Government                                                                                                                                             3.5% Fines
  Deloitte U.S. Economic Forecast
  Cash Schiller Index
LICENSES & PERMITS REVENUE
               Includes general business (occupation) license tax, various parking and building permits, and occupancy certificates
                                         Licenses & Permits Breakdown (FY19)                                                       Revenue Forecasts ($M; FY20 – FY25)
                                                                                                             $140                                                                                 138.05
                                                                                                                                           122.33                                                 133.25
                                                                                                             $130
                                                                                                                        123.26
                                                                                                             $120                                                                                 120.69

                                                                                                             $110                          100.61
                                                                                                             $100
                                                                                                                                                 93.75
                                                                                                             $90
                                                                                                                    FY19         FY20       FY21         FY22        FY23         FY24        FY25
                                                                                                                                         High         Medium           Low

                    General business license revenue is derived from fixed and variable revenue sources, each of     Forecasted revenues for licenses and permits are particularly sensitive to the duration
Key Insights

                    which are sensitive to employment and GDP indicators                                             of business closure periods, especially building permits

                    Building permits, as well as related electrical, plumbing, HVAC, and other inspection-
                                                                                                                     With a significant percentage of business license revenue pegged to headcount, the recovery
                    related permits, are highly dependent on the health of residential and real-estate
                                                                                                                     rate is closely correlated to employment growth
                    markets

                                                           Key Assumptions
                                                                                                                                                                      % FY19 REVENUE
     •          License and permit revenue driven by macroeconomic GDP growth rates and reduction in real estate starts                                                31.5% Property
     •          License and permit accounts driven by events and real estate development reduced to zero during shut-down period                                      17.7% Licenses & Permits
                                                                                                                                                                       16.8% Sales Tax
                (delayed, not cancelled)
                                                                                                                                                                       15.5% Public Utility
                                                                                                                                                                       15.1% Other
                                                                                                                                                                        3.5% Fines
                Sources: City of Atlanta Dept. of Finance
LOCAL OPTIONS SALES TAX (LOST)
               Taxes imposed on the purchase, sale, rental, storage, use, or consumption of tangible personal property and related services
                               Local Options Sales Tax Breakdown (FY19)                                                              Revenue Forecasts ($M; FY20 – FY25)
                                                                                                        $135
                                                                                                                                                                                                 130.86
                                                                                                        $125                                115.58
                                                                                                                                                                                                 120.53
                                                                                                        $115             116.72

                                                                                                        $105
                                                                                                         $95                                99.41
                                                                                                         $85
                                                                                                                                                 79.24
                                                                                                         $75
                                                                                                                    FY19          FY20      FY21         FY22        FY23        FY24        FY25
                                                                                                                                          High        Medium          Low
                  Across scenarios, FY20 revenue drops steeply, driven primarily by steep shocks to                   In the longer term, the medium and low-risk scenarios are buoyed by a strong boost
Key Insights

                  consumer spending based on business closures                                                        to consumer spending and fixed business investment

                  Around 80% of the revenue stream is concentrated in categories mostly driven by                    In longer term high-risk scenario, LOST revenue recovers slowly due to low consumer
                  consumer spending patterns across goods and services                                               spending, GDP growth, and fixed business investment

                                                             Key Assumptions                                                                                                 % FY19 REVENUE
          •      Distinguished essential and non-essential businesses; nonessentials zeroed out during shutdown                                                               31.5% Property
                                                                                                                                                                              17.7% Licenses & Permits
          •      Applied varying reduction rates for essential goods using relevant multipliers derived from the consumer spending                                           16.8% Sales Tax
                 macrotrend, with sales decline ranging from 0-89% across categories                                                                                          15.5% Public Utility
                                                                                                                                                                              15.1% Other
          •      Longer term recoveries track GDP, consumer spending, personal disposable income, and fixed business investment                                                3.5% Fines
Sources: Deloitte U.S. Economic Forecast, McKinsey Fashion Report, Forbes, Technomic, Utility Drive, National Restaurant Association, IRI Worldwide
PUBLIC UTILITY, ALCOHOLIC BEVERAGES & OTHER
                Taxes for public utilities, motor vehicles & titles, state railroads, insurance premiums, and wholesale/by-the-drink alcoholic beverages
                              Public Utility, Alcoholic Bev’s & Other Breakdown (FY19)                                                                              Revenue Forecasts ($M; FY20 – FY25)
                                                                                                                                  $115                                                                                           111.75
                                                                                                                                                 108.02
                                                                                                                                  $110                                                                                           110.37
                                                                                                                                                                                                                                 106.71
                                                                                                                                  $105
                                                                                                                                  $100
                                                                                                                                    $95
                                                                                                                                                                                 93.90
                                                                                                                                    $90
                                                                                                                                                  FY19          FY20        FY21         FY22        FY23        FY24        FY25
                                                                                  0.4%
                                                                                                                                                                          High        Medium          Low
Key Insights

                      Public Utilities are held constant across scenarios based on longstanding contracts, which                                      Medium and low risk scenarios expect a return to strong GDP and consumer spending
                      minimizes the overall revenue impact                                                                                            on both durable and non-durable goods

                                                                                                                                                      In the high risk scenario, GDP and consumer spending are slower to return to pre-COVID
                      FY20 impact is concentrated in lower per-drink alcohol sales, lower wholesale
                                                                                                                                                      levels due to broader economic fallout, resulting in a longer recovery period
                      purchases, and a sharp decline in vehicle sales

                                                               Key Assumptions                                                                                                                            % FY19 REVENUE
     •            Distinguished essential and non-essential businesses; nonessentials zeroed out during shutdown                                                                                           31.5% Property
                                                                                                                                                                                                           17.7% Licenses & Permits
     •            Utility tax revenue agreements rarely renegotiated, not expected to be revisited in any scenario
                                                                                                                                                                                                           16.8% Sales Tax
     •            Applied varying reduction rates to insurance, alcohol sales, and motor vehicles based on GDP and Consumer                                                                               15.5% Public Utility
                  Spending                                                                                                                                                                                 15.1% Other
                                                                                                                                                                                                            3.5% Fines
               Sources: Deloitte U.S. Economic Forecast, Newsweek, CSP Daily News, City of Atlanta, Deloitte COVID-19 Insurance Impact, MarketWatch
ALL OTHER REVENUES
                              Additional revenue sources that fall outside of the previous categories
                                                          Other Revenues Breakdown (FY19)                                                                                Revenue Forecasts ($M; FY20 – FY25)
                                                                                                                                                  $110   104.96

                                                                                                                                                  $105                                                                                 102.25
                                                                                                                                                  $100                              94.61                                              102.07
                                                                                                                                                   $95
                                                                                                                                                                                                                                          97.07
                                                                                                                                                   $90
                                                                                                                                                   $85                            87.92
                                                                                                                                                   $80
                                                                                                                                                                                          79.57
                                                                                                                                                   $75
                                                                                                                                                         FY19        FY20         FY21            FY22     FY23        FY24         FY25
                                                                                                                                                                               High          Medium         Low

                                    There are >100 miscellaneous subaccounts in this category, so model assumes revenue
                                                                                                                                                           Pilot & Franchise fees are generally considered to be resilient from economic shocks,
Key Insights & Assumptions

                                    will suffer from business closures in the near term and recover in-line with GDP and
                                                                                                                                                           though the model produces a slight reduction in water usage based on less people
                                    general economic conditions in the long term
                                                                                                                                                           traveling and commuting into the city.

                                    Indirect cost recoveries are a function of the size of the overall government. They are                               The remaining revenue streams are sensitive to business closures in the short
                                    held constant in the short term, as the costs are charged on a 2 year lag.                                            term and correlated to consumer spending and overall economic health in the
                                                                                                                                                          recovery period

                                    Hotel tax revenue plummets in the short term as shelter-in-place prevents travel. In                                                                                      % FY19 REVENUE
                                    the long term, this revenue tracks consumer spending patterns.                                                                                                             31.5% Property
                                                                                                                                                                                                               17.7% Licenses & Permits
                                                                                                                                                                                                               16.8% Sales Tax
                                                                                                                                                                                                               15.5% Public Utility
                                                                                                                                                                                                              15.1% Other
                             Sources: Deloitte U.S. Economic Forecast, American Hotel & Lodging Association, Amane Advisors, STR U.S. Hotel Results                                                             3.5% Fines
FINES, FORFEITURES & PENALTIES
                  Revenue comprised primarily of traffic fines and forfeitures
                                      Fines, Forfeitures & Penalties Breakdown (FY19)                                                                      Revenue Forecasts ($M; FY20 – FY25)

                                                                                                                                     $24      24.18
                                                                                                                                                               20.91                                                        23.59

                                                                                                                                     $19

                                                                                                                                     $14                         14.91

                                                                                                                                                                           9.47
                                                                                                                                      $9
                                                                                                                                           FY19       FY20         FY21         FY22         FY23         FY24         FY25
                                                                                                                                                                  High        Medium           Low

                        Fines, fees, and forfeitures have limited reliance on macroeconomic conditions with                                  87% of driving stops during shelter-in-place orders, reducing moving violations and driving-
Key Insights

                        revenue most likely impacted in the short term                                                                       related fees significantly during closure periods

                        Two-thirds of revenues are dependent on personal travel patterns – particularly the                                  The duration of these policy decisions determines the slope and recovery rate of the growth
                        single occupancy vehicle – and are susceptible to declines when driving patterns shift                               curve in this revenue category

                                                                 Key Assumptions
                                                                                                                                                                                                      % FY19 REVENUE
     •              Traffic fines and moving violations are assumed to come to a halt, zeroed out for nonessential trips during the                                                                    31.5% Property
                    shutdown period                                                                                                                                                                    17.7% Licenses & Permits
     •              Court fees are zeroed out during shutdown period, with limited spike among resumption of criminal proceedings due                                                                  16.8% Sales Tax
                                                                                                                                                                                                       15.5% Public Utility
                    to limited court capacity
                                                                                                                                                                                                       15.1% Other
                                                                                                                                                                                                        3.5% Fines
               Sources: Municipal Court of Atlanta, AJC, Georgia April 2nd Executive Order, Atlanta Public Schools, ARC, Brookings
SUMMARY
Summary of Economic Results:

• This analysis developed key assumptions to make forecasts around the uncertainties of the COVID-19 public health crisis and the associated business closures.
  The sooner COVID-19 reaches its peak, the sooner the healthcare crisis can be managed, and the sooner the economy can begin to recover.

         • HIGH: Up to $113M potential decline in overall municipal revenue by FY21 followed by a slow recovery and a secondary hit in FY24 based on property
           value decline, resulting in a net loss of $39M by the end of the five year time horizon

         • MEDIUM: Up to $67M potential decline in overall municipal revenue by FY21 followed by a moderate recovery and a secondary slowdown in FY24 that
           contributes to moderate recovery levels by FY25 up by $6M

         • LOW: Quick recovery creates moderate decline of $10M in FY21 and allows for growth of $26M by the end of FY25

• If the virus peak occurs and can be managed within the originally anticipated business closure deadlines, the economy has the potential to make a more
  immediate bounce-back. However, the longer the economy remains shutdown, the higher unemployment will swing, which will lead to a longer recession and
  slower recovery.

• If the health crisis continues to worsen, public safety costs and the costs of essential services will continue to rise. In a constrained revenue environment, this
  will put downward pressure on the budget.

Potential Next Steps:

          Refine economic assumptions as                         Assess the impact COVID-19 will have                   Position Atlanta for support from the CARES
1         more clarity around outbreak and the
          business closures emerges
                                                      2          on Atlanta’s expenditures and
                                                                 opportunities to relieve pressure
                                                                                                             3          act and assess how stimulus support can
                                                                                                                        impact Atlanta’s general fund
FEDERAL FUNDING
OVERVIEW OF CRF

The CARES Act established the Coronavirus Relief Fund and appropriated $150 billion to the Fund.
Under the CARES Act, the Fund is to be used to make payments for specified uses to States and
certain local governments; the District of Columbia and U.S. Territories (consisting of the
Commonwealth of Puerto Rico, the United States Virgin Islands, Guam, American Samoa, and the
Commonwealth of the Northern Mariana Islands); and Tribal governments.

The CARES Act provides that payments from the Fund may only be used to cover costs that—
are necessary expenditures incurred due to the public health emergency with respect to the
Coronavirus Disease 2019 (COVID–19);
were not accounted for in the budget most recently approved as of March 27, 2020 (the date of
enactment of the CARES Act) for the State or government; and
were incurred during the period that begins on March 1, 2020, and ends on December 30, 2020.

The City of Atlanta received $88M in Coronavirus Relief Funds.
                                                                                                   20
OVERVIEW OF FEMA

Consistent with the national emergency declared for the coronavirus (COVID-19) pandemic on March 13, 2020, FEMA
has provided guidance on the types of emergency protective measures that may be eligible under FEMA’s Public
Assistance Program in order to ensure that resource constraints do not inhibit efforts to respond to this
unprecedented disaster.

FEMA assistance will be provided at a 75 percent federal cost share, if not funded by the HHS/CDC or other federal
agency. These emergency protective measures include, but are not limited to:
•   Management, control and reduction of immediate threats to public health and safety
•   Emergency medical care
•   Medical sheltering
•   Household pet sheltering
•   Purchase and distribution of food, water, medicine and other consumable supplies including PPE
•   Movement of supplies and persons
•   Security and law enforcement
•   Communications of general health and safety information to the public
•   Search and rescue to locate and recover member of the population requiring assistance
•   Reimbursement for local government force account overtime costs
                                                               Source: Coronavirus (COVID-19) Pandemic: Eligible Emergency Protective Measures 3/19/20 www.fema.gov
                                                                                                                                                                      21
O P E R AT I N G B U D G E T
    D E V E LO P M E N T
FY21 BUDGET DEVELOPMENT OBJECTIVES

          Prioritize resources to maintain public safety and service delivery

                Minimize impact of expense reductions on workforce

                     Make prudent use of fund balance reserves

          Establish an orderly pathway back to a balanced budget through
                           savings and efficiency efforts

                                                                                23
FY21 BUDGET INCREASES

Police Raises

Body Cameras

Fire Raises

Office of Inspector General

Benefits Costs

                              24
FY21 OPERATING BUDGET SUMMARY

                                                   Summary of key budget changes
             $720

             $700

             $680
  MILLIONS

             $660

             $640

             $620

             $600
                    FY20 Adopted   Benefit Costs     APD Raises and   AFRD Raises   Inspector General   Reductions   FY21 Proposed
                                                     Body Cameras

                                                                                                                                     25
FY21 BUDGET EXPENSE REDUCTIONS

   Vacancies and attrition

   Overtime

   Contracts and Professional Services

   Supplies

   Non-departmental

                                         26
FY21 BUDGET EXPENSE BREAKOUT

                                 General Fund budget expense breakout
            $350

            $300

            $250
 MILLIONS

            $200

            $150

            $100

            $50

             $0
                   FY18 Actual             FY19 Actual             FY20 Adopted            FY21 Proposed

                    We will continue to implement thoughtful strategies to reduce costs in FY21
                                                                                                           27
FY21 OPERATIONAL AREAS OF FOCUS

   Vacancy Review Board

   Department efficiency plans

   Corrections operational assessment

   OPEB task force

   Back-office functional alignment

                                        28
FY21 PERSONNEL BUDGET PRIORITIES

   Hiring/Backfill approach

   Telework productivity

   Full Time Equivalent counts

   Personnel paper preview

                                   29
HIRING / BACKFILL APPROACH

Effective April 20

Only mission-critical positions are eligible for hire

Supervisor positions can be backfilled with internal candidates on an interim
basis

Non mission-critical hires paused until further notice

  – Exceptions to this policy considered, based on demonstrated operational
    needs, with prior approval obtained from the Chief Operating Officer

                                                                                30
TELEWORK PRODUCTIVITY

                      Workforce telework status                                         Utilization management approaches

                                                                                    •     Assignment Transfer
                                                            34.6%                   •     Targeted Cross-Training
63%                    37%
                                                                                    •     Establishment of Eligibility Roster /
                                                                                          Vacancy Pool

                                                                             2.4%

 Telework Eligible   Mission Critical   Able to telework   Not able to telework

                                                                                                                          31
FULL TIME EQUIVALENT (FTE) COUNTS

   General Fund

  FY21 FTE COUNT                                   UNFUNDED VACANT FTES                                                    FY21 FUNDED FTES

     5611.2                                                    658.0                                                              4953.2

   300

   250

   200
                                             Distribution of Unfunded FTEs
   150

   100

    50

    0
         APD   PRC   EXE   AFR   DPW   JDA   COR   EAM   DCP   DHR   AIM   DOF   LAW   SOL   DOP   PDA   ETH   DCS   AUD    CRB   DOT

                                                                                                                                              32
PERSONNEL PAPER PREVIEW

Implement Police and Fire raises

Abolish unfunded positions

ADOT position transfers

DGCD positions transfers

                                   33
REVENUES
CITY REVENUE BUDGET DEVELOPMENT RESOURCES

           EXAMPLES OF SOME OF THE RESOURCES USED IN PREPARING BUDGETS

                                                                         35
GENERAL FUND REVENUE ASSUMPTIONS

     ▪ For FY21, Property & Sales taxes represent 49% of General Fund revenue.

     ▪ Current year Property taxes are estimated to increase 6.8% from new
       construction and allowable reassessment growth per the City of Atlanta Base
       Freeze Exemption (HB820).

     ▪ Dollar value of one mill is projected at $28.4 million in FY21 compared to $17
       million in FY13.

     ▪ Property tax revenues are not expected to be impacted from effects of COVID-19
       events. Property tax value and subsequent bills are derived from values as of Jan.
       1 of each year, which for this year preceded the COVID-19 event.

     ▪ Sales tax revenue is forecasted to decline by -29% and correlates to the impact
       from the COVID-19 pandemic.

     ▪ Hotel/Motel tax revenue is projected to decline by -27% due to reduction in
       business and leisure travel from mandatory shelter in place order.
                                                                                            36
TAXABLE PROPERTY VALUES
         TAXABLE ASSESSED VALUE (FY 2016 – FY 2020)                                                TAX BASE BY LAND USE (FY 2020)
                                                                                                                                Industrial 2.2%
40.0                                                                      32.4              33.4        Other 3.1%

30.0             25.0               25.6               26.7

20.0                                                                                                Commercial 44.3%                 Residential 50.4%

10.0
  0.0
                 2016               2017              2018               2019               2020
$-billions

         ACTUAL TAXES COLLECTED (FY 2016 – FY 2020)                                                OPERATING MILLAGE RATES (FY 2016 – FY 2020)

                                                                                                    9.00       8.89    8.88         8.84
$230
                                                                                            $221    8.80
                                                                          $218
$220                                                                                                8.60
$210                                                   $205                                         8.40
                                    $197                                                            8.20
$200              $193                                                                              8.00                                          7.85   7.85
$190                                                                                                7.80
                                                                                                    7.60
$180                                                                                                7.40
$170                                                                                                7.20
$-millions        2016              2017               2018               2019              2020               2016    2017         2018          2019   2020

      -----------------------------------------------------------------------------------------
      Source: City of Atlanta Department of Finance, Office of Revenue                                                                                          37
NET TAX DIGEST AND MILLAGE VALUE
$34.0                                                                                                                                                 $33.4
                                                                                                                                      $32.4
$32.0
$30.0
$28.0                                                                                                                         $26.7
$26.0                                                                                                                 $25.6
                                                                                                         $25.0
        $24.0           $23.1
$24.0                                     $22.1
                                                               $21.4                            $22.5
$22.0                                                                               $21.7

$20.0
    2010               2011                 2012                2013                2014        2015       2016        2017    2018      2019          2020

   Year                Assessed Value                                Mill Rate                  CY Property Tax Revenue         Dollar Value of One Mill
   FY20                      $33.4 Billion                                   7.85                 $208.5 Million (Adopted)            $26.7 Million
   FY19                      $32.4 Billion                                   7.85                 $198.1 Million (Audited)            $25.2 Million
   FY18                      $26.7 Billion                                   8.84                 $192.4 Million (Audited)            $21.8 Million
   FY17                      $25.6 Billion                                   8.88                 $187.5 Million (Audited)            $21.1 Million
   FY16                      $25.0 Billion                                   8.89                 $180.9 Million (Audited)            $20.4 Million
   FY15                      $22.5 Billion                                   9.75                 $179.4 Million (Audited)            $18.4 Million
   FY14                      $21.7 Billion                                  10.05                 $174.8 Million (Audited)            $17.4 Million
   FY13                      $21.4 Billion                                  10.24                 $171.7 Million (Audited)            $16.8 Million
   FY12                      $22.1 Billion                                  10.24                 $175.8 Million (Audited)            $17.2 Million
   FY11                      $23.1 Billion                                  10.24                 $189.8 Million (Audited)            $18.5 Million
   FY10                      $24.0 Billion                                  10.24                 $209.5 Million (Audited)            $20.5 Million
    -----------------------------------------------------------------------------------------
    Source: City of Atlanta Department of Finance, Office of Revenue
                                                                                                                                                              38
REVENUE ACTUAL & ANTICIPATIONS OVERVIEW

$750.0                                                $716.7
                                                                              $686.9                   $696.1
                                                                                                                                  $648.6   $673.4
                               $617.5
$650.0   $591.3
                                                                               $664.2
                                                                                                        $685.0                    $645.6

                                                       $633.3                                                                               $619.4
         $585.5                $604.2
$550.0
$450.0
         FY15                   FY16                    FY17                    FY18                    FY19                    FY20         FY 21
         actual                 actual                  actual                  actual                  actual                projected    proposed

          One time/non-recurring revenues
          NOTE: FY 2017 Includes transfer of Building Permit Revenues & fund balance and proceeds from the sale of Underground.
                FY 2018 Includes proceeds from sale of Civic Center.
                FY 2019 Includes proceeds from insurance reimbursement from Cyber attack.
                FY 2020 Includes Cyber attack reimbursements & anticipated reduction in revenues from COVID-19 events.
                FY 2021 Includes proceeds from intrafund & intergovernmental transfers.

                                                                                                                                                      39
REVENUE COMPARISON BY CATEGORY
                                                                           FY2020          FY2021                         % CHANGE
    MAJOR CATEGORY                                          FY2019                                         BUDGET FY21
                                                                          ADOPTED         PROPOSED                         FY21 vs.
                                                            ACTUALS                                          vs. FY20
                                                                          BUDGET           BUDGET                           FY20

  PROPERTY TAXES                                            $218.94        $219.14         $232.11             $12.97      5.92%
  PUBLIC UTILITY, ALCOHOLIC BEVERAGE AND
  OTHER TAXES                                               $108.02        $107.71         $100.63              ($7.08)    -6.57%
  LOCAL OPTION SALES TAX                                    $116.72        $115.43           $82.15            ($33.28)   -28.83%
  LICENSES AND PERMITS                                      $123.26        $121.77         $105.38             ($16.39)    -13.46%
  OTHER REVENUE                                              $18.98           $6.29           $5.49            ($0.80)    -12.72%
  CHARGES FOR CURRENT SERVICES                                 $4.27         $4.56            $3.38            ($1.18)    -25.88%
  FINES/FORFEITURES & PENALTIES                              $24.18         $22.21           $14.43             ($7.78)   -35.03%
  BUILDING RENTALS & CONCESSIONS                              $5.13         $3.73             $4.29             $0.56      15.01%
  INDIRECT COSTS                                             $34.71         $34.31           $34.88             $0.57      1.66%
  HOTEL/MOTEL                                                $21.34         $21.80           $15.99            ($5.81)    -26.65%
  PILOT & FRANCHISE FEES                                     $20.53         $20.68          $20.70              $0.02      0.10%
  INTRA-FUND & INTERGOVERNMENTAL
  TRANSFERS                                                                                 $54.00             $54.00     100.00%
  GRAND TOTAL                                               $696.08        $677.63         $673.43             ($4.20)     -0.62%
  *FY21 Proposed Budget reflects anticipated impact of the Covid-19 pandemic.
                                                                                                                                      40
   FY21 Proposed Budget amount of $54 million includes Intra-fund {$37 million} & Intergovt.{$17 million} transfers.
EASTSIDE TAD SUMMARY

• The Eastside TAD (ETAD) was established in 2003 to extend redevelopment progress from the Westside TAD
  towards eastern Downtown, Sweet Auburn and Old Fourth Ward
• 20+ projects/2 million+ square feet of development has been completed
    ➢ Original 2005 bond was $47.5M and was fully paid off (escrowed) in February 2019
    ➢ $47.5M of new projects are currently committed/in progress
    ➢ Additional tax increment is available for Sweet Auburn corridor
• Tax digest has almost tripled as of 2019 since the base year of 2005.
• Developer incentives are no longer needed to attract investment in much of the area; northeast corner of
  ETAD is adjacent to the Beltline’s Eastside Trail
• Atlanta Public School tax increment will no longer be available to the ETAD beginning with tax year 2019
• $4 to $5 million would be added to General Fund revenue on an ongoing basis if tax increment was returned
• $10 to $15 million would come back to the City as a one-time lump sum
                                                                                                              41
EASTSIDE TAD FINANCIAL POSITION

           TAD                     Taxes   Cash/Investments   Debt Balance   Why the Eastside TAD?
Westside 1992                      $22.5        $69.5            $73.0

Atlantic Station 1999              $23.4        $23.3           $119.7       •   Only TAD with substantial
                                                                                 cash/investment balances, available
Princeton Lakes 2002               $2.1         $5.5             $4.9
                                                                                 for future projects and distributions,
Perry Bolton 2002                  $5.6         $16.1            $14.8           above debt balance
Eastside 2003                      $19.9       $107.1             $0
                                                                             •   One of the earliest TADS created
Atlanta Beltline 2005              $51.8       $113.9           $111.6
                                                                                 having met substantially all original
Campbellton Road 2006              $0.3         $4.7              $0             development goal.
Hollowell/ML King 2006             $0.3         $2.4              $0
                                                                             •   50% of the Tax increment (APS) went
Metropolitan Pkwy 2006             $0.4         $1.8              $0
                                                                                 away with the 2018 Omnibus TAD
Stadium Area 2006                  $0.2         $0.4              $0             Agreement
   Balances as of March 31, 2020
EXPENDITURES
FY2021 TOTAL OPERATING BUDGET

           The City of Atlanta’s Total Proposed FY21 Operating Budget is $2.2B *

      Other funds include                                                  The City’s main
      Group Insurance, E911,                                               operating fund;
      Solid Waste, Fleet                                                   accounts for all general
                                   Other (7 funds)
      Service, Hotel/Motel,          $344.3M                               government functions.
      Rental/Motor Vehicle &            15%                 General Fund
      City Plaza.                                            $673.4M
                                                               30%

The Airport is funded by         Airport
                               $642.4M *
gate fees, concessions &          29%
parking revenues, PFC’s
and CFC’s. Funding uses                              Water & Wastewater
are strictly controlled by                                                 Water & Wastewater is
                                                        $569.7M *
the FAA.                                                    26%            funded by charges for
                                                                           services and the MOST;
                                                                           residual revenue is
                                                                           directed to its capital
   * Pre-COVID-19                                                          program.
                                                                                                      44
GENERAL FUND BUDGET
EXPENDITURE COMPARISON BY MAJOR CATEGORY ($MIL)

                                                  45
GENERAL FUND BUDGET
        EXPENDITURE COMPARISON BY DEPARTMENT ($MIL)

* Board of Ethics & Independent Compliance is now a part of the Office of Inspector General per legislation 19-O-1729.   46
N O N - D E P A R T M E N TA L
    EXPENDITURES
NON-DEPARTMENTAL COMPARISON
                                                  Non-Departmental
                         Restricted                    $94.2M
                         Reserves
                           $4.1M
                                                                      Debt Service
                            5%
                                                                      • Public Safety
                                                                      • Energy Savings
                                                                      • Other Debt (Zoo Atlanta, Downtown Parking, GMA, etc.)
               OPEB & Other           All Other
                                      $22.9M                          OPEB and Other Employee Related Expenses
              Employee Related
                 Expenses                24%                           • OPEB
                  $26.5M                                               • Worker’s Compensation
                                                                       • Unemployment
                    28%
                                                                       All Other
                                 Debt Service                          •   Invest Atlanta        • Water Utility for Grady
                                   $31.2M                              •   Insurance Expenses      Hospital
                                                                       •   Audit/Management Fees • Litigation
Payments to                         33%                                •   Atlanta Land Bank     • Pre-Arrest Diversion
   Other
                                                                      Payments to Other Governments
Governments
                                                                     • Dekalb and Fulton County Taxes
   $9.5M                                                             • Fulton County Animal Control
    10%                                                              • Fire Department - Fulton & Dekalb IGA’s
                                                                       Restricted Reserves
                                                                                                                                48
TRUST FUND
TRUST FUND – TOP 10 PROJECTS

                                            Total
                                       Trust $40.7MM       $11.9MM Tree Removal

                                                          $4.5MM Care & Conserve
                                  Top 10
                                  make up               $3.5MM Covid-19 Corona Virus
                                 79% of the
                                   Total
                                  Balance              $2.3MM Youth Athletics Program

                                                       $2.1MM Parks & Cultural Affairs
                                       Total of 248
                                          Trust        $1.9MM Technology Surcharge
                                        Accounts
                                                          $1.6MM Streetcar O & M

                                                       $1.5MM Jail Administration Fund

                                                       $1.3MM Federal RICO Treasury

                                                          $1.2MM Centers of Hope

                       Balances as of March 31, 2020
                                                                                         50
TRUST FUND BALANCE BY DEPARTMENT

                             Total Trust Fund FY20 Budgeted Balance is $40.7M

                                            $2.2M                         $3.5M
                                                    Finance      Police
                                                      5%          9%
                                                                                  Others    $5.7M
                                                                                   14%

                      Housing, Planning &
                         Development                                                        DWM     $4.8M
                             40%                                                            12%

 $16.1M                                                  Parks, Recreation &
                                                           Cultural Affairs
                                                                 20%

Police
Others
DWM                                                                                 $8.4M
Parks, Recreation & Cultural Affairs
Housing, Planning & Development
Finance
                                                                                                            51
I M PAC T F E E S
IMPACT FEES

                                 Impact Fee Fund Balances as of March, 2020 - $49M

              25,000         $21,637

              20,000
$ Thousands

              15,000
                       $10,601

              10,000
                                                $4,995
                                                                            $4,234
               5,000                                     $1,509                      $2,353
                                       $1,563                            $970
                                                                  $458                        $244   $158 $692

                  -

                                        Unrestricted         Restricted by Ordinance

                                                                                                                 53
FUND BALANCE
FY2019 GENERAL FUND BALANCE

                                     Unrestricted Fund Balance & Restricted Fund Balance
250
                                                                                          ❖Total Fund Balance has grown
                                                                  $200M           $194M
                                                                                           by $100 million since the
200
      25% budget                                                          $179M
                                                                                           beginning of FY2011.
                                                                                          ❖Budgeted reserves and strong
                                             $151M     $153M
150   20% budget          $138M    $142M                                                   cost control were key factors in
                  $126M                                                                    restoring fund balance.
      15%budget
100    $94M                                                                               ❖Unrestricted fund balance
                                                                                           above 20% is available for one-
                                                                                           time, nonrecurring purchases as
 50                                                                                        long as a portion goes toward
                                                                                           reducing any remaining deficit
                                                                                           funds.
  0
       FY11        FY12    FY13      FY14     FY15       FY16      FY17    FY18    FY19

                              Unrestricted           Restricted
                                                                                                                              55
FY2019 CASH DEFICIT FUNDS

       Deficit Funds – Cash basis                 2018     2019
       E911                                        2.3M       0
       Internal Service Fund – Fleet Services      2.0M       0
       Internal Service Fund - Group Insurance     7.7M    21.6M
       Solid Waste Service                       29.2M     38.8M
       Total                                     $41.8M   $69.1M

                                                                   56
DEBT AND INVESTMENTS
INVESTMENT PORTFOLIO OVERVIEW

  Portfolio Objectives
                                                         Portfolio Yield
                                    2.000%
                                    1.800%
        Safety                      1.600%
                                    1.400%
                                    1.200%
                                    1.000%
                                    0.800%

Liquidity        Yield   $2.65B     0.600%
                                    0.400%
                                    0.200%
                          3Q 2020   0.000%
                                             YTD3Q2018         YTD3Q2019   YTD3Q2020

                                                            Net Increase

                                                         $110.0 M
                                                     Compared to 3Q 2019

                                                                               58
DEBT PORTFOLIO OVERVIEW

                           4%                                 General       General Fund   &   Tax Allocation     Dept of      Dept of
                                 5%                          Obligation           Other           Districts      Aviation     Watershed      Net Increase

                                                                                                                                          $271.5 K
                                       5%         Q3 FY20    $273,900          $375,988          $323,960       $2,824,078   $3,046,339
                                                  Q3 FY19     299,095            411,713          373,300        2,327,560    3,161,083

45%           $6.8 B                                         ($25,195)
                                                              (8.42%)
                                                                               ($35,725)
                                                                                (8.68%)
                                                                                                 ($49,340)
                                                                                                 (13.22%)
                                                                                                                $496,518
                                                                                                                 21.33%
                                                                                                                             ($114,744)
                                                                                                                              (3.63%)
                                                                                                                                           Outstanding Debt

                 3Q 2020
           Outstanding Long-Term
                   Debt

                                      41%                      0%                          $101.8 M                           $140.0 M
                                                            Variable Rate                  Total NPV Savings                    Energy Savings
                                                                Debt                       On Refunded Debt                      Performance
                                                                                              during FY20                         Contracts
      General Obligation               General Fund
      Tax Allocation Districts         Aviation
      Water & Wasterwater

                                                                                                                                                              59
ATLANTA CREDIT RATINGS

                                                   CITY OF ATLANTA MUNICIPAL BOND RATINGS

                                                                    Standard &
                                                    Moody’s                                Fitch
                                                                      Poor’s
General Obligation Bonds                              Aa1               AA+                AA+
Water and Wastewater Revenue Bonds                    Aa2                AA-                AA-

Airport Revenue Bonds - Senior Lien GARBs             Aa3                AA-                AA-

Airport Revenue Bonds- PFC/Subordinate
                                                      Aa3                AA-                AA-
Lien GARBs
Airport Revenue Bonds Senior Lien
                                                       A2                 A                  A
Customer Facility Charge

   Note: The Moody's rating agency recently announced that it may downgrade bonds supported by car rental fees as well as hotel/motel
   taxes in the future.

                                                                                                                                        60
QUESTIONS
    &
 ANSWERS
You can also read