COMPANY PRESENTATION - Nov 2019 - Minor International

Page created by Jim Valdez
 
CONTINUE READING
COMPANY PRESENTATION - Nov 2019 - Minor International
COMPANY PRESENTATION – Nov 2019
COMPANY PRESENTATION - Nov 2019 - Minor International
Forward Looking Statement
Statements included or incorporated in these materials that use the words "believe", "anticipate", "estimate", "target", or "hope", or that otherwise
relate to objectives, strategies, plans, intentions, beliefs or expectations or that have been constructed as statements as to future performance or
events, are "forward-looking statements" within the meaning are not guarantees of future performance and involve risks and uncertainties that could
cause actual results to differ materially from historical results or those anticipated at the time the forward-looking statements are made. MINT
undertakes no obligation to publicly update or revise any forward-looking statement, whether as a result of new information, future events or
otherwise. MINT makes no representation whatsoever about the opinion or statements of any analyst or other third party. MINT does not monitor or
control the content of third party opinions or statements and does not endorse or accept any responsibility for the content or the use of any such
opinion or statement.

                                                                                                                                                        2
COMPANY PRESENTATION - Nov 2019 - Minor International
AGENDA
 Highlights &
 Performance Recap
 Minor Hotels
 Minor Food
 Minor Lifestyle
 Corporate Information
 & Five-Year Strategy

                         Anantara Iko Mauritius
COMPANY PRESENTATION - Nov 2019 - Minor International
HIGHLIGHTS &
PERFORMANCE RECAP
COMPANY PRESENTATION - Nov 2019 - Minor International
Highlights & Outlook

                        HIGHLIGHTS                                             OUTLOOK

                                                        Strong 4Q19 Outlook:
                                                        • Recovery of Minor Hotels’ Thailand, Middle East &
   • 3Q19 CORE NPAT +39% / LFL NPAT +67%                  Africa portfolio
   • 9M19 CORE NPAT +9% / LFL NPAT +17%                 • NHH’s momentum continued
                                                        • Sales activities of residential sales & recovery of
                                                          Anantara Vacation Club

                                                        • The acquisition of Bonchon will provide upside growth
   • Strategic asset rotation resulting in successful
                                                          for Minor Food
     deleverage plan
                                                        • The transaction is accretive from day one, with
   • Interest bearing debt declined by 10% to THB 112
                                                          potential to leverage on Minor Food’s platform &
     billion at the end of 3Q19
                                                          operations
   • D/E ratio declined to 1.35x at the end of 3Q19
                                                        • Minor Food’s transformation is underway

                                                                                                                  5
COMPANY PRESENTATION - Nov 2019 - Minor International
Investment in Bonchon
Bonchon is an international restaurant brand which is reputable for its Korean-style fried chicken and other Korean-inspired dishes. MINT
announced the investment in the existing outlets of Bonchon in Thailand, and is in discussion with the master franchise holder for the rights to
expand the brand further in the country.
                        BONCHON AT A GLANCE                                                              STORE LOCATION
                                                                           • Bonchon today has 44 stores, with another 2 to be opened by the end
  • The first Bonchon in Thailand opened its door in 2011 and, given its     of 2019.
    popularity, has been expanding rapidly ever since.

  • With over 300 branches, Bonchon has established its footprint in 9
    countries: Thailand, Philippines, Kuwait, Singapore, Bahrain,
    Vietnam, USA, Cambodia and Myanmar.                                                                                   Nakhon Ratchasima: 1 store
                                                                                     Airport: 4 stores
  • Bonchon in each country caters specifically to the local market’s
    taste and lifestyle with unique menus and flexible store format.

                    THE INVESTMENT IN BONCHON                                                                                Greater Bangkok: 38 stores

  • MINT made the investment in Chicken Time, which operates over                                                    Pattaya: 1 store
    40 outlets of equity-owned Bonchon stores in Thailand.
  • The investment amount is THB 2 billion for 100% in Chicken Time.
  • MINT is in the process of discussing with the holder of master
    franchise rights to acquire the rights to further expand Bonchon
    outlets in Thailand.

                                                                                                                                        *As of October 2019
                                                                                                                                                              6
COMPANY PRESENTATION - Nov 2019 - Minor International
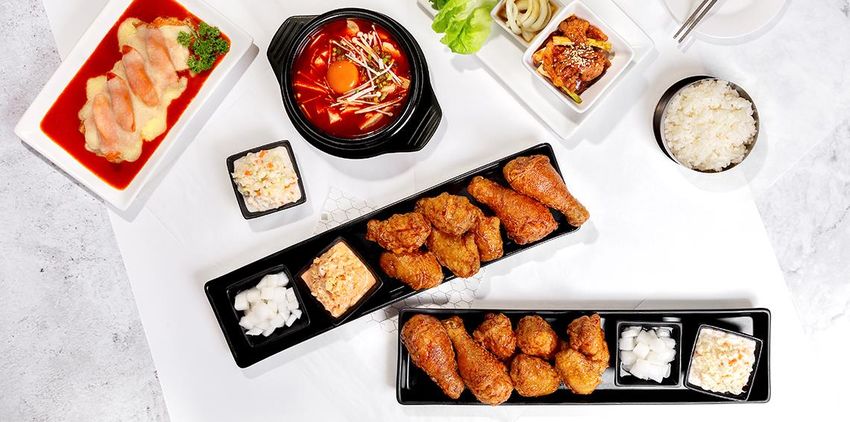
Investment Rationales
The investment in Bonchon is the opportunity for Minor Food to capture the fast-growing chicken market and the sizable Asian food market. The
provincial Thailand is still an untapped market for the brand, while delivery market continues to offer growth potential, both of which Bonchon can
leverage on Minor Food’s operating platform.
                        SIZABLE & HIGH GROWTH CONCEPT                                                           SIGNIFICANT OUTLET OPPORTUNITY
                                Market Size (THB billion)                                                              No of Outlets in Thailand
           +229%                                         2008   2018                                                           518
               24                                                                              416

                                    +196%                                                                 292
                                                                       +104%                                                                                          150-200*
                                        10              +53%
          7                                                                9
                                                            6                                                          56              109         62
                                3                   4                  4                                                                                       44

           Chicken               Burger                 Pizza          Ice Cream               TPC        SW           SZ      DQ       BK         TCC     Bonchon

  Source: Euromonitor & company estimate                                                      Data as at end of 3Q19                     * Bonchon’s estimated addressable outlets

               HIGH GROWTH POTENTIAL OF DELIVERY MARKET                                                     SUPERIOR PERFORMANCE & SCALABILITY
                                Market Size (THB billion)
                                                                                           • Bonchon’s best-in-class operational matrix:
                                                                10% CAGR
                                                                                   111
                             10% CAGR                                                             ‒ Payback period of less than one year for store openings
                                                          84
                                             75
                                       67                                                         ‒ Store EBITDA margin significantly higher than Minor Food’s
         52       56       60
                                                                                           • Ability to leverage on Minor Food’s operating platform to
                                                                                             accelerate growth trajectory, both in terms of physical outlet and
                                                                                             delivery service
       2013      2014     2015        2016   2017        2018                      2021F
  Source: Euromonitor & company estimate
                                                                                                                                                                                     7
COMPANY PRESENTATION - Nov 2019 - Minor International
Comparables
Both transaction comparables and trading comparables of F&B companies have averaged between 10 – 13x in the past.

                       TRANSACTION COMPARABLES                                                   TRADING COMPARABLES - THAILAND
  EV/EBITDA (x)                                                                EV/EBITDA (x)
     15         14.8                                  14.0                                         14.8
                            12.3                                 Average           15                                     14.0
                                                                                                                                                                Average
                                         11.0                     13.0x                                                                                          12.7x
     10                                                                             10                                                            9.2

      5                                                                              5

      0                                                                              0
           Coffee Bean &   OldTown   KFC Thailand   MAP Boga                                       MINT                    MK                     Zen
              Tea Leaf      Berhad     Thailand     Adiperkasa

                                                                                                      TRADING COMPARABLES - SEA
                                                                           EV/EBITDA (x)
                                                                                      17.2
                                                                              15
                                                                                                    12.8
                                                                                                                                                                Average
                                                                                                                                                        10.3     10.6x
                                                                              10
                                                                                                                 7.6          8.1          7.3
                                                                               5

                                                                               0                                    PT
                                                                                     Jollibee   Shakey's Pizza
                                                                                                         PT Sarimelati Kencana
                                                                                                                Sarimelati Max's Group Berjaya Food     Jumbo
                                                                                                                Kencana

                                                                                                                                                                          8
COMPANY PRESENTATION - Nov 2019 - Minor International
3Q19 Performance Recap
In 3Q19, core revenue and NPAT increased by 86% and 39% y-y, respectively, primarily from the consolidation of NH Hotel Group (NHH). Driven by
MINT’s timely strategic initiatives with its investment in NH Hotel Group and the sale and leaseback of three Tivoli hotels in Portugal, MINT was able
to report robust performance despite the softness of MINT’s organic businesses, which were impacted by external challenges, including global
uncertainties, continued appreciation of the Thai Baht and subdued domestic consumption demand.
                                                        REVENUE                                                        3Q19 REVENUE CONTRIBUTION
  THB million                                                                   +86% y-y
                                                                                            +4,779      34,277            Minor Lifestyle
                                            +14,592                  +131        29,497                                        4%                Minor Food
    30,000
                                                        -150                                                                                        19%
    20,000       15,889

    10,000                      -965

                                                                                                                  Minor Hotels
          0                                                                                                          77%
                 3Q18       Minor Hotels     NHH      Minor Food     Minor      3Q19 Core   Non-core     3Q19
                Revenue      Pre-NHH                                Lifestyle                Items     Reported                             * Excludes non-core items

                                                       NET PROFIT                                                     3Q19 NET PROFIT CONTRIBUTION
  THB million                                                                   +39% y-y
                                                                                            +3,143      4,560                                   Minor Food
     4,000                                                                                                                                         15%
     3,000
     2,000                                   +836                                 1,417
                  1,020
     1,000                                              -143          -20
                                 -275
          0                                                                                                        Minor Hotels
                  3Q18      Minor Hotels     NHH      Minor Food     Minor      3Q19 Core   Non-core     3Q19         85%
                  NPAT       Pre-NHH                                Lifestyle                Items     Reported                             * Excludes non-core items
* Non-core items are detailed on page 47.                                                                                                                               9
COMPANY PRESENTATION - Nov 2019 - Minor International
9M19 Performance Recap
In 9M19, MINT’s core revenue almost doubled primarily from the consolidation of NHH. Core NPAT increased at a lower rate of 9% y-y, because of
NHH’s first quarter low season, FX headwinds and MINT’s organic operations.

                                                          REVENUE                                                        9M19 REVENUE CONTRIBUTION
THB million                                                                            +91% y-y
                                                                                                           94,762           Minor Lifestyle
 100,000                                                   +43,365     +191    +358     89,739    +5,023
                                                                                                                                 4%                  Minor Food
   80,000                                                                                                                                               20%
   60,000      47,095                  46,974
   40,000                   -121                 -1,149
   20,000
         0                                                                                                          Minor Hotels
               9M18    Non-core 9M18 Core        Minor       NHH       Minor    Minor 9M19 Core Non-core  9M19         76%
              Reported  Items                    Hotels                Food    Lifestyle         Items   Reported
                                                Pre-NHH                                                                                         * Excludes non-core items

                                                          NET PROFIT                                                    9M19 NET PROFIT CONTRIBUTION
THB million                                                                            +9% y-y                                Minor Lifestyle
                                                                                                  +2,778   6,929                   1%
                                                                                                                                                      Minor Food
   6,000
                                                            +1,129                                                                                       23%
               3,944                   3,824                                             4,151
   4,000                                                               -296
                           -121                                                 -44
                                                 -461
   2,000

        0
               9M18    Non-core 9M18 Core        Minor       NHH       Minor    Minor 9M19 Core Non-core  9M19       Minor Hotels
              Reported  Items                    Hotels                Food    Lifestyle         Items   Reported       76%
                                                Pre-NHH                                                                                         * Excludes non-core items
* Non-core items are detailed on page 47.                                                                                                                                   10
FX Headwinds & Lease Payment
In 3Q19, MINT’s financial performance was adversely impacted by the strengthening of the Thai Baht and the additional lease payment because of
the sale-and-lease-back transaction of the 3 Tivoli assets. Excluding such impact, MINT’s like-for-like (LFL) NPAT would have increased by 67% in
3Q19 and 17% in 9M19.

                                                                         3Q19 LFL NPAT
                      THB million                                                     +67% y-y                           +39% y-y
                        2,000                       +832                                1,707
                         1,500                                   -124      -21                                            1,417
                                      1,020                                                           -213       -77
                         1,000
                           500
                              0
                                      3Q18     Minor Hotels Minor Food    Minor        3Q19 @       FX Impact   Leases    3Q19
                                      NPAT                               Lifestyle   Constant FX                          Core
                                                                                     & excl Lease

                                                                         9M19 LFL NPAT
                     THB million                                                      +17% y-y                           +9% y-y
                         5,000                      +939
                                                                                        4,432
                                      3,824                                                                               4,151
                         4,000                                   -287      -44                        -204       -77
                         3,000
                         2,000
                         1,000
                             0
                                    3Q18 NPAT Minor Hotels Minor Food     Minor        3Q19 @       FX Impact   Leases    3Q19
                                                                         Lifestyle   Constant FX                          Core
                                                                                     & excl Lease

                     * Non-core items are detailed on page 47.                                                                                  11
International Presence
With solid diversification strategy, MINT’s footprint was in 63 countries at the end of 9M19 across its hospitality and restaurant businesses.

              Minor Hotels
              Minor Food
              Combination

                 REVENUE CONTRIBUTION

100%
           13%
 75%                                         International
                     61%             72%
                             75%
 50%                                         Thailand
           87%
 25%
                     39%             28%
                             25%
  0%
          2008      2018*    9M19*   2023F
 * Excludes non-core items
                                                                                                                                                 12
MINOR HOTELS

               Anantara Angkor
Minor Hotels – Financial Highlights
Revenue, EBITDA and NPAT of Minor Hotels improved significantly in 9M19 y-y, primarily as a result of the consolidation of NHH since October
2018. In the midst of weak operating environment and external challenges, Minor Hotels’ international expansion and accretive M&A strategies
have differentiated the group from its peers in terms of growth and performance.

  THB million                                                                       +152% y-y                   +162% y-y
                                                                                                                  68,257                            +43,365   68,257
                                                    24,535                 24,408
                                                                21,230                 22,619
                                                                                                      26,042                26,042
                   8,929      8,121       8,992
   Revenue                                                                                                                             -1,149

                                                                                    +100% y-y                   +100% y-y
                                                                                                                  12,785                            +7,382    12,785
                                                     5,907                  5,282                                           6,383
                                                                                       4,417            6,383
                   2,245                  2,213                  3,085                                                                  -980
    EBITDA                    1,926

  EBITDA          25.1%       23.7%      24.6%       24.1%      14.4%       21.6%      19.5%           24.5%      18.7%
  Margin

                                                                                     +86% y-y                   +27% y-y
                                                                                                                 3,165                              +1,129    3,165
                                                     1,810                                              2,497               2,497
                                                                            1,825
                   1,141                                                               1,212
     NPAT                      705         651                                                                                           -461
                                                                  128
  Net             12.8%       8.7%        7.2%       7.4%        0.6%       7.5%        5.4%            9.6%      4.6%
  Margin

                                                                                                        9M18      9M19      9M18     Minor Hotels     NHH     9M19
                  1Q18        2Q18       3Q18        4Q18       1Q19        2Q19       3Q19                                           Pre-NHH
* The financials above reflect performance from operation, and therefore exclude non-core items as detailed on page 47.                                                14
Minor Hotels – Organic Performance
Organically (excluding NHH performance), 9M19 revenue of Minor Hotels declined by 4%, from owned hotels, management letting rights (MLR)
portfolio in Australia and mixed-use business, although managed hotels reported revenue increase. Consequently, 9M19 EBITDA and NPAT declined
by 16% and 18% respectively, from the lower flow-through of the owned hotels, MLR and real estate operations, as well as FX headwinds.

 THB million                    -11% y-y                        -4% y-y                                                          9M19 KEY HIGHLIGHTS
                                                   25,598       24,449           Owned hotels                         • Revenue (excluding NHH) declined by 5% y-y, as a result of:
                    8,907                                                        (Minor Hotels pre-NHH)                  ‒ Soft performance of Thailand hotels, especially in the
                                  7,942
                                                                                                                           provinces, and
                                                                                 23%                                     ‒ The adverse impact of the strengthening of the THB on
  Revenue                                                                        of 9M19 Minor Hotels’
                                                                                                                           overseas owned portfolio, despite the RevPar growth of
                                                                                 revenue
                                                                                                                           10% in local currencies for the 9M19 period, together with
                                                                                                                           the tragedy in Sri Lanka.
                                -26% y-y                        -16% y-y
                                                   6,065
                                                                 5,085
                                                                                 Management letting rights • Revenue in THB term declined by 11% y-y, because of:
                    2,129
                                 1,577                                           6%                           ‒ AUD RevPar down by 5%, pressured by both occupancy
                                                                                 of 9M19 Minor Hotels’          and room rate, and
   EBITDA                                                                                                     ‒ Weakening of AUD by 10% during the period.
                                                                                 revenue
 EBITDA            23.9%         19.9%             23.7%         20.8%
 Margin
                                                                                 Management contracts                 • Revenue (excl NHH) increased by 12% y-y, primarily
                                                                                                                        attributable to improving performance of hotels in the Middle
                                -31% y-y
                                                    2,523
                                                                -18% y-y         1%                                     East and the Maldives, together with contribution of newly
                     891                                                         of 9M19 Minor Hotels’
                                                                 2,062                                                  added hotels.
                                   616                                           revenue
    NPAT                                                                         Mixed-use business                   • Revenue declined by 8% y-y, from:
                                                                                                                         ‒ The decline in sales of Anantara Vacation Club earlier in
 Net               10.0%          7.8%              9.9%          8.4%           5%                                        the year, although 3Q19 recorded strong turnaround, and
 Margin                                                                          of 9M19 Minor Hotels’
                                                                                 revenue                                 ‒ Timing mismatch of the residential sales, while 4Q19 looks
                    3Q18          3Q19             9M18          9M19                                                      promising.
* The financials above reflect performance from operation, and therefore exclude non-core items as detailed on page 47.                                                                 15
Minor Hotels – NH Hotel Group Performance
NH Hotel Group reported recurring EBITDA of EUR 209 million in 9M19, an increase of 13% y-y as a result of sound revenue growth (+6%) and
continuous cost control. NHH reiterates on its full-year 2019 EBITDA & recurring NPAT guidance of EUR 285 million and approx. EUR 100 million
respectively (excluding IFRS 16 and IAS 29 accounting impacts and Tivoli integration).
 EUR million                +8% y-y                   +6% y-y           Consolidation - THB million                               9M19 KEY HIGHLIGHTS

                                          1,190
                                                       1,257                    43,808                                   • 9M19 revenue growth of 6%
                              436
                  404                                                                                                       ‒ Organic RevPar up 4.6% (Occupancy flat; ADR +4.6%)
                                                                                                           Revenue
  Revenue                                                                                                                   ‒ Strong growth in Europe of +3.5%. Additional
                                                                     443                                                      revenue from new hotels & transfer of Tivoli portfolio
                           +11% y-y                  +13% y-y
                                                                                7,770      Accounting
                                                                                                                     • 9M19 recurring EBITDA growth of 13%, with margin
                              78                       209
                                            185                                  360                                   improvement of 1.0 p.p.
  Recurring       70                                                                       Standard        Recurring
   EBITDA                                                                         +        Difference                   ‒ Effective cost control with 35% EBITDA conversion
                                                                     318        7,340                      EBITDA
                                                                                                                          rate. Parameter changes explain 49% of the increase
 EBITDA          17.4%      17.9%          15.6%      16.6%         71.6%       17.6%
 Margin                                                                                                                   of total operating costs and 41% of lease payments
                           +30% y-y                  +57% y-y                              Acquisition                   • 9M19 recurring NPAT increase of 57%
                              28                        70                      - 1,207    Related
  Recurring        22                        45
                                                                                           Expenses
                                                                                                                            ‒ Business improvement
    NPAT                                                              -26        1,103                                      ‒ Lower financial costs, from full redemption of
  NPAT            5.3%       6.4%           3.7%        5.6%          NM         2.5%                                         convertible bond (June 2018) and partial early
  Margin
                            -3% y-y                  -21% y-y                                              NPAT               redemption of 2023 bond (4Q18)
                   29         28             93                                 - 1,207    Acquisition                   • 9M19 reported NPAT decline of 21%, due to lower
  Reported                                               74                                Related                         contribution (-EUR 45 million) of non-recurring activities
    NPAT                                                                        1,236      Expenses
                                                                     -26                                                   (sale & leaseback of NH Collection Amsterdam Barbizon
                                                                                                                           Palace Hotel in 1Q18)
                 3Q18        3Q19          9M18        9M19          9M18       9M19
                              excl IFRS 16                 excl IFRS 16                                                  Leverage • Net financial debt position of EUR 190 million
Note:   (1) As per NHH’s report, the numbers include hyperinflation accounting effect (IAS 29) (implemented since 3Q 2018) but excludes IFRS 16,
        (2) Recurring NPAT exclude mainly net capital gains from asset rotation, and
        (3) In THB consolidation, acquisition-related expenses include expenses related to fair value adjustment and interest expenses on the financing of the acquisition.             16
Minor Hotels – International Presence
In recent years, MINT has implemented a solid diversification strategy. With the investment in NHH, MINT operates hotels and spas under a
combination of investment, joint-venture and management business models in 55 countries.

       Investment

       Management
       Combination

       New Destinations in Pipeline

       Hubs

                 REVENUE CONTRIBUTION
100%       6%
 75%                                          International
                     78%     88%      89%
 50%                                          Thailand
          94%
 25%
                     22%     12%      11%
  0%
          2008      2018*    9M19*    2023F
 * Excludes non-core items

                                                                                                                                        17
Minor Hotels Portfolio
In terms of business model, owned and leased business is the most important to Minor Hotels, with 87% revenue contribution. In terms of
geography, Europe is the major contributor with 66% of Minor Hotels’ revenue, and about 60% of NPAT. For the full year, Europe contribution is
expected to decline as Thailand and Maldives enter high season in the forth quarter.
         System-wide Room Contribution                                          System-wide Room Contribution
                 By Ownership                                                           By Geography
                  MLR                                                                   Middle East & Asia
                  9%                                                                       Africa 6%  10%
                                  Owned                                            Oceania
                                   25%                                               9%
        Managed
         19%
                      76,967                                                 Americas            76,967
                                                                               14%
                      Rooms                                                                      Rooms
        JV 3%
                                   Leased                                                                    Europe
                                    44%                                                                       61%

           9M19 Revenue Contribution                    9M19 Revenue Contribution                              9M19 NPAT Contribution
                  By Business                                 By Geography                                         By Geography

                      Mixed-use                                         Others                                          Others
                MLR                                          Maldives & 8%     Thailand
                         5%                               Middle East 2%                                                 7%      Thailand
                 6%                                                              12%
         Managed                                                                                          Maldives &               13%
                                                     Australia & New
           2%                                          Zealand 6%                                         Middle East
                                                                                                             17%
                       THB                             Americas
                      68,257                              6%
                                                                                                          Americas
                      million                                                                               3%
                                  Owned &                                                                                              Europe
                                                                                        Europe
                                   Leased                                                66%                                            60%
                                    87%
                                                                                                                                                18
Owned & Leased Hotels
                 Owned &
                            With the acquisition of NHH, owned & leased hotels is the major revenue contributor. 3Q19 organic RevPar excluding FX
     9M19
                  Leased    impact of owned & leased hotels grew by 2%, driven by overseas hotels. System-wide RevPar of owned & leased portfolio
                   87%
  Minor Hotels
   Revenue
                            declined by 39%, from the dilution of ADR with the consolidation of different room type mix of NHH, and the strengthening
                            of the Thai Baht. Revenue of owned & leased hotels more than tripled in 3Q19, primarily from the consolidation of NH Hotel
                            Group.
                           NUMBER OF HOTEL ROOMS                                                                   ADR
  No of                                                          +657% y-y         THB                                              Organic excl FX System-wide
 Rooms                                                                                                                                 +5% y-y        -39% y-y
 20,000                                           52,978   53,262 53,448          8,000 7,314
 60,000                                  52,969                                                                            7,072
                                                                                                                                                 6,465
 15,000                                                                                                   6,152                      5,920
                                                                                  6,000           5,556
 10,000                                                                                                                                   4,109
             7,063    7,063      7,063                                                                            3,985        3,748                   3,763
                                                                                  4,000
  5,000
      0                                                                           2,000
            1Q18      2Q18       3Q18    4Q18     1Q19     2Q19     3Q19                  1Q18    2Q18     3Q18   4Q18      1Q19       2Q19          3Q19

                                 OCCUPANCY                                                                        REVPAR
   90%                                                          System-wide       THB                                              Organic excl FX System-wide
                                                                    Flat                                                              +2% y-y        -39% y-y
                                                                                 6,000
   80%                           74%                        74%      74%
                                                                                          4,400           4,533            4,313                 4,574
   70%                64%                          65%                           4,000            3,568                              3,997
                                          62%                        71%                                                                     3,053
             60%                                                                                                  2,743
                                                            68%                                                                2,444                   2,773
   60%
                                                   61%                           2,000
                                                                  Organic
   50%                                                            -3% y-y
   40%                                                                               0
            1Q18      2Q18       3Q18    4Q18     1Q19     2Q19     3Q19                  1Q18    2Q18    3Q18    4Q18       1Q19      2Q19          3Q19
                                                                                                                                                                  19
Owned Hotels – Thailand
                  Thailand
                     11%            Thailand continues to be an important market for Minor Hotels. RevPar trend of hotels in Thailand was soft in 3Q19,
NHH                    Overseas
74%        9M19        excl NHH     amidst the low season. Performance of Bangkok hotels continued to hold up relative to hotels in the provinces. Minor
        Owned Hotels     15%
            Revenue                 Hotels continues to believe that Thailand will remain an attractive destination for tourism with its diverse attractions,
                                    well-developed infrastructure and strategic location.

                                     THAILAND                                                                             3Q19 KEY HIGHLIGHTS
 RevPar Growth                                                         Organic
 (y-y)     +14%            +1%      Flat       -2%           -6%         Flat      -5%                   • International tourist arrivals into Thailand grew by 7% in 3Q19,
    THB                                                                                                    driven by recovery of tourists from China, new market; i.e. India, and
   8,000      7,652                          6,701         7,303                                           the traditional markets of Japan and Korea.
                  6,393                                        5,994                         Thailand
   6,000                  5,377 5,361              5,074               5,367     5,180
                                     4,164                                 3,891     3,937               • Minor Hotels’ number of room nights sold declined by 4% y-y in
   4,000                     3,875
               84%                  78%        76%           82%         73%        76%
                                                                                                           3Q19. As a result, organic RevPar of Minor Hotels’ owned Thailand
                             72%
   2,000                                                                                                   portfolio declined by 5% in 3Q19 compared to 3Q18.
        0
               1Q18        2Q18     3Q18      4Q18          1Q19        2Q19       3Q19
                                                                                                         • RevPar of Bangkok hotels was flat in 3Q19 compared to 3Q18.
                             % Occupancy               ADR                RevPar                           (Occ -1%, ADR +1%).
                                                                                             Bangkok
                      9M19 ORGANIC REVPAR GROWTH (THB)                                                   • RevPar of Bangkok hotels in 3Q19 was driven by the St. Regis Hotel
                                                                                                           and AVANI Bangkok Riverside.
         THAILAND HOTELS
      REVENUE CONTRIBUTION
                                                   9%
                                                                                                         • Performance of hotels in the provinces remained challenging with
                          Bangkok            -2%        Flat       -9% -7% -10%                            RevPar decline of 10% in 3Q19 (Occ -2%, ADR -7%).
                                             1Q      2Q 3Q         1Q 2Q 3Q
                            44%                                                              Thailand
Provinces
                                                                                             Provinces   • Positive RevPar growth of Anantara Golden Triangle, AVANI Samui
  56%                                                                                                      and Anantara Layan Phuket helped partially mitigate the RevPar
                                               Bangkok                 Provinces                           decline of other hotels.

                                                                                                                                                                                20
Owned Hotels – Overseas (Excl NHH)
                    Thailand
                       11%              RevPar of owned overseas hotels (excl NHH) declined by 6% in 3Q19, solely from the strengthening of the THB.
NHH                      Overseas
74%          9M19        excl NHH
                                        Excluding FX impact, organic RevPar of owned overseas hotels increased by 7%. Selective asset refreshments and
          Owned Hotels     15%          ongoing sales & marketing efforts helped Minor Hotels to continue to report positive momentum despite the
            Revenue
                                        challenging macro backdrop in its key markets.

                                   OVERSEAS EXCL NHH                                                                                            3Q19 KEY HIGHLIGHTS
 RevPar Growth                                                              Organic
 (y-y)      +14%             +6%       +12%         +5%             -3%      +10%        -6%                               • Portugal portfolio’s RevPar was down 8% in THB (+3% in EUR),
     THB                                                                                                                     with the weakening of the EUR by 11% during the quarter.
           6,902                      6,823        5,977      6,249                    6,602             Portugal
                                                                           5,780
    6,000                  5,690                                                                                           • With the occupancy already in the 80’s, the increase in RevPar in
                                          4,715                                           4,426
    4,000
                              3,380                   3,185                    3,724                                         EUR was driven primarily by rate.
                   3,098                69%                       3,009                  67%
                              59%                   53%                       64%
                  45%                                           48%
    2,000                                                                                                                  • Brazil’s RevPar declined by 4% in THB (+3% in BRL) with the
           0                                                                                             Brazil              weakening of the Brazilian real by 7%.
                1Q18        2Q18       3Q18*        4Q18        1Q19         2Q19       3Q19                               • The BRL RevPar growth was driven by Tivoli Sao Paulo Mofarrej.
                         % Occupancy                  ADR                   RevPar

                      9M19 ORGANIC REVPAR GROWTH (THB)                                                                     • RevPar of the Maldives portfolio increased by 1% in THB (+9% in
 OVERSEAS HOTEL (EXCL NHH)                         IN LOCAL CURRENCIES (3Q)                                                  USD) with the weakening of the USD by 7%.
  REVENUE CONTRIBUTION                         +3%        +3%        +9%                       +32%
                                                                                                         Maldives
                                                                                                                           • The RevPar growth continued to be from the successful focus on
                                                           18%              19%                                              rate increase.
 Others                    Portugal
  29%                       34%
                                              8%                                       7% 8%
                                                                                                                           • RevPar of the African portfolio increased by 3% in THB (+32% in
                                       Flat    -8% -3%         -4% Flat        1%               3%
                                                                                                                             local currencies).
 Africa                                1Q 2Q 3Q*       1Q 2Q 3Q           1Q 2Q 3Q      1Q 2Q 3Q         Africa
 13%                Brazil                                                                                                 • Hotels in Zambia were the drivers of the RevPar growth, with over
           Maldives 13%
            11%                         Portugal           Brazil         Maldives       Africa                              30% growth rate for the two hotels in local currency.
* For comparison purposes, to be in line with the operations, the three Tivoli properties under the sales and lease back transaction has been reclassified to be under NHH in 3Q18 and are no longer in Minor
  Hotels’ owned overseas portfolio.                                                                                                                                                                             21
Owned & Leased Hotels – NH Hotel Group
                    Thailand
                       11%              NHH was the largest contributor to the owned & leased hotel portfolio in 9M19. 9M19 RevPar of NHH increased by 4%,
NHH                      Overseas
74%          9M19        excl NHH       driven by all key markets (despite the negative trade fair calendar of Central Europe in 3Q19). The RevPar increase in
          Owned Hotels     15%
            Revenue     MLR             9M19 was primarily from ADR (all regions reported ADR increases except LatAm with outstanding RevPar growth in
                                        Spain).

                      NH HOTEL GROUP – ORGANIC REVPAR                                                                                          3Q19 KEY HIGHLIGHTS
 RevPar               +2% y-y                                         +4% y-y                                             • Both Madrid and Barcelona achieved double-digit RevPar growth
                                                                                                        Spain               due to favorable fair and congress calendar.
  EUR                                              EUR
  120         98           100                     120
                                                             98             101                                           • Milan continued to perform well with positive trade fair calendar.
                   73             75                               70             73
   80                                               80
                                                                                                        Italy             • Performance in Rome was weaker due to lower demand of
   40           75%             75%                 40         72%              72%                                         business groups.

      0                                               0                                                                   • Recovery continued in Brussels with higher number of events
               3Q18           3Q19                            9M18           9M19
                                                                                                                          • Amsterdam was slightly pressured by lower business group
                         % Occupancy                ADR                 RevPar                          Benelux
                                                                                                                            events.
                      9M19 ORGANIC REVPAR GROWTH (EUR)                                                                    • Congress center hotels’ RevPar continued to be positive.
NHH REVENUE CONTRIBUTION      10%                                                                                         • Operations in Germany were weaker by the unfavorable trade fair
         Latin                                                                                          Central
        America          7%7%                       6%6%    5%                                                              calendar in the third quarter.
          7%     Spain               5% 4%   4%                                                         Europe
                 27%                             2%                                                                       • Additionally Frankfurt negatively affected by higher supply.
Central                           1%       1%           -5% 0.2%-9%
Europe
 23%                     1Q 2Q 3Q 1Q 2Q 3Q 1Q2Q 3Q 1Q 2Q3Q 1Q 2Q 3Q                                                       • Mexico saw positive RevPar from higher demand and increase in
                                                                                                        Latin               room rate.
Benelux                  Italy                                                                          America
                         19%
                                                                                                                          • Argentina impacted by hyperinflation and Colombia by currency
 23%                                  Spain      Italy      Benelux    Central         Latin
                                                                       Europe        America                                depreciation.
 Note: NHH’s organic stats disclosed by MINT and are different than NHH’s public disclosure as MINT’s version is organic (one-year in operation) whereas NHH’s is LFL (24 months full cycle of operations)   22
NHH Integration & Synergies Update
Potential synergies have been identified and will be proposed to NHH’s board for approval, after which the plan will be announced. Both MINT &
NHH are already working together on the integration, examples are.

            TIVOLI INTEGRATION & HUB STREAMLINING                                                       CROSS-EXPANSION
 Successful transfer of hotels in Portugal & Brazil to be under NHH     Leverage on both parties’ strengths to expand the hotel portfolio.
 management, in order to leverage on NHH’s strong operating
 platform:
                                                                                   NHH’s relationship
   • 3 hotels in Lisbon being leased & managed by NHH                                                                   Anantara’s brand
   • 9 hotels in Portugal under the management of NHH
                                                                                     with real estate
                                                                                   investors / owners
                                                                                                             +             strength
   • 2 hotels in Brazil with NHH’s support on operational process and
     reviews

 Handover of NH Cape Town The Lord Charles in South Africa to be
 under the operational oversight of Minor Hotels’ Africa hub.
                                                                        Anantara Villa Padierna Palace             Anantara will soon début in
                                                                        Benahavis Marbella Resort in Spain         Ireland with the rebranding of
                                                                        opened its doors in July 2019.             The Marker Hotel in Dublin.

                                                                                                                                                    23
Asset-Light Businesses
       MLR
Managed 6%
                                 MINT’s asset light businesses include management letting rights (MLR) of serviced-suites in Australia and New Zealand and
  2%                             hotel management contracts. RevPar of MLR declined because of the weak macro environment and the strengthening of the
              9M19
           Minor Hotels          THB. As a result, MLR revenue declined by 11% in 3Q19. For managed hotels, system-wide RevPar declined from change of
            Revenue
                                 hotel mix with the addition of the NHH portfolio, together with the strengthening of the THB. However, revenue of managed
                                 hotels increased by 11% from the new openings.
                            MANAGEMENT LETTING RIGHTS                                                                      MANAGED HOTELS
                               NO OF HOTEL ROOMS                                                                          NO OF HOTEL ROOMS
   No of                                                                      +6% y-y        No of                                                                    +194% y-y
  Rooms                                                                                      Rooms
                                               6,935     7,000     6,989       7,043                                                                                   14,450
  7,000      6,511                   6,618                                                   15,000                                   13,311     13,284      13,408
                           6,512
  6,000                                                                                      10,000
                                                                                                        4,745     4,750     4,919
  5,000                                                                                       5,000

  4,000                                                                                          0
              1Q18         2Q18      3Q18      4Q18      1Q19      2Q19        3Q19                     1Q18      2Q18      3Q18       4Q18      1Q19         2Q19      3Q19

                                           REVPAR                                                                                   REVPAR
  THB                                                                                  AUD    THB                                                         Organic excl FX System-wide
 5,000                                                                     THB         170                                                                   -1% y-y        -16% y-y
                                                                         -17% y-y            6,000
 4,000      3,624                  3,480     3,411     3,188                                          4,170                                    4,306
                      3,052                                                2,895
                                                                 2,673                 150   4,000                        3,413                             3,425     3,377
 3,000                                                                                                          3,144                3,119             2,882               2,865
             148                              145                                                                                                                2,744
 2,000                              144
                                                       142                  138        130   2,000
 1,000                    126                                              AUD
                                                                 121     -5% y-y
     0                                                                                 110       0
             1Q18         2Q18      3Q18     4Q18      1Q19      2Q19      3Q19                       1Q18      2Q18      3Q18       4Q18        1Q19         2Q19      3Q19
                                                                                                                                                                                    24
Hotel Expansion Pipeline
                                                    2019F                                  2020F                                               2021F                                     2022F-2024F
                                      • Marbella, Spain             132 rms   • Ubud, Bali, Indonesia*         71 rms             • Milan, Italy               185 rms            • Frankfurt, Germany          428 rms
                                      • Desaru, Malaysia            103 rms   • Dublin, Ireland                187 rms            • Santander, Spain            64 rms            • Monterrey, Mexico           120 rms
HOTEL INVESTMENT & LEASE

                                      • Merida , Mexico             120 rms   • Khao Lak, Thailand            328 rms             • Alicante, Spain             63 rms            • Frankfurt, Germany          375 rms
                                      • A Coruna, Spain              92 rms   • Fares Island, Maldives*       200 rms             • Milan, Italy               100 rms
                                      • Mannheim, Germany           225 rms   • Cancun, Mexico                140 rms             • Hamburg, Germany           261 rms
                                      • Leipzig, Germany            197 rms   • Hannover, Germany              89 rms             • Hamburg, Germany           136 rms
                                      • Mexico City, Mexico         105 rms
                                                                              • Amsterdam, Netherlands        650 rms
                                      • Munich, Germany             173 rms
                                      • Antwerp, Belgium            180 rms
                                      • Rome, Italy                  42 rms
                                      • Warangi, Serengeti
                                        National Park, Tanzania*     12 rms
                                         11 Hotels / 1,381 Rooms                 7 Hotels / 1,665 Rooms                               6 Hotels / 809 Rooms                           3 Hotels / 923 Rooms
                                                                                                           27 Hotels / 4,778 Rooms
                              * Note: Joint-ventured properties
                                      • Le Chaland, Mauritius       164 rms   • Bang Krachao, Thailand         62 rms             • Phi Phi Island, Thailand   107 rms            • Accra, Ghana                155 rms
                                      • Tozeur, Tunisia              93 rms   • Libo Country, China           173 rms             • Nanjing, China             120 rms            • Chengdu, China              150 rms
                                      • Bangkok, Thailand           382 rms   • Ras Al Khaimah, UAE           174 rms             • Busan, Korea               570 rms            • Sharjah, UAE                233 rms
                                      • Adelaide, Australia                   • Krabi, Thailand                                   • Savanne, Mauritius                            • Riyadh, Saudi Arabia        163 rms
MANAGEMENT CONTRACTS / MLRS

                                                                     78 rms                                    83 rms                                          156 rms
                                      • Angkor, Cambodia             80 rms   • Nha Trang, Vietnam            273 rms             • Ras Al Khaimah, UAE        225 rms            • Jeddah, Saudi Arabia        328 rms
                                      • Busan, South Korea          289 rms   • Dubai, UAE                    264 rms             • Dubai, UAE                 528 rms            • Sifah, Oman                 300 rms
                                      • Victoria, Australia         170 rms   • Muscat, Oman                  162 rms             • Fortaleza, Brazil          130 rms            • Kota Kinabalu, Malaysia     386 rms
                                      • Wellington, New Zealand     226 rms   • Queensland, Australia          50 rms             • Hangzhou, China            166 rms            • Yangon, Myanmar             250 rms
                                      • Krabi, Thailand             178 rms   • Chengdu, China                201 rms             • Phuket, Thailand           500 rms            • Cam Ranh, Vietnam           595 rms
                                      • Dubai, UAE                  360 rms   • Bahia, Brazil                  50 rms             • Lima, Peru                 164 rms
                                                                                                                                                                                  • Ho Chi Minh City, Vietnam   217 rms
                                      • Beirut, Lebanon             110 rms   • Chengdu, China                197 rms             • Iquique, Chile             135 rms            • Yangon, Myanmar             221 rms
                                      • Gold Coast, Australia        76 rms   • Hangzhou, China               132 rms             • Lima, Peru                 265 rms            • Guadalajara, Mexico         120 rms
                                      • Valencia, Spain              47 rms   • Murano, Italy              104+38 rms             • Santiago, Chile            146 rms            • Aguascalientes, Mexico      105 rms
                                      • Santiago, Chile              85 rms   • Feira de Santana, Brazil      207 rms    Others   • Hangzhou, China             54 rms
                                                                                                                                                                                  • Mexico City, Mexico         144 rms
                                      • Porto, Portugal              79 rms   • London, UK                    190 rms
                                                                                                                                                                                  • Panama, Panama               83 rms
                                      • Andorra la Vella, Andorra    60 rms                                                                                              Others   • Zhuhai, China               100 rms
                                      • Laikipia, Kenya               8 rms
                                         17 Hotels / 2,485 Rooms                 16 Hotels / 2,360 Rooms                             14 Hotels / 3,266 Rooms                       16 Hotels / 3,550 Rooms
                                                                                                           63 Hotels / 11,661 Rooms                                                                                   25
                              ** Hotels already opened in 9M19
Mixed-Use Business
  Mixed-use
     5%                      Mixed-use business comprises residential development and Anantara Vacation Club. In addition to the current projects,
                             MINT has a pipeline of branded residences for sale in order to ensure the continuity of revenue stream in the coming years.
            9M19
         Minor Hotels        Anantara Vacation Club provides stable revenue growth driven by membership growth. In 3Q19, mixed-use revenue declined
          Revenue
                             by 10% y-y, as the increase in revenue of Anantara Vacation Club of 9% only partially offset the decline in residential sales
                             during the quarter from timing mismatch of the sales. Minor Hotels expects to have some residential sales activities in 4Q19.
                           RESIDENTIAL DEVELOPMENT                                                            ANANTARA VACATION CLUB
                               CURRENT PROJECTS                                                                GROWING MEMBERSHIP
Layan Residences by                                                      Launched    Growth (y-y) +28%       +15%       +27%           +21%         +18%
                              15 luxury pool villas         100%-owned
Anantara, Phuket                                                           2015        No. of
                                                                                     Members                                                        13,884       Others
                                                                                                                                       12,347
Avadina Hills by                                                         Launched     12,000                           10,193                        27%         Malaysia
                              16 luxury pool villas           50% JV
Anantara, Phuket                                                           2018                              8,000                                  7%           Hong Kong
                                                                                                    6,928
                                                                                       8,000                                                        8%8%         Singapore
                                                                         Launched                                                                     11%
The Estates Samui             14 luxury pool villas         100%-owned                 4,000                                                                     Thailand
                                                                           2006                                                                      39%
                                                                                           0                                                                     China
Anantara Chiang Mai           44 units in 7-storey                       Launched
Serviced Suites              condominium building             50% JV       2016                     2015      2016      2017           2018         9M19
                                                                                                INVENTORY TO ACCOMMODATE GROWING MEMBERS
                        181 keys for rent & 6 penthouses                 Launched
Torres Rani, Maputo                                           49% JV                 No. of Units
                         for sale; 21-storey office tower                  2015                                                    7 Destinations:           >12 Destinations
                                                                                                                                  Queenstown, Bali,             > 500
                                                                                        500                                        Sanya, Samui,
                                       PIPELINE                                                                                   Phuket, Bangkok
                                                                                        400                                          Chiang Mai
Anantara Desaru                                                          To launch
Residences, Malaysia          20 residential villas           60% JV       2020         300
                                                                                                                                229           238
                                                                                        200                 160      186
Anantara Ubud                                                            To launch                  137
Residences, Indonesia         15 residential villas           50% JV       2020         100
                                                                         To launch         0
Silom Office                           NA                     40% JV       2023                     2015    2016     2017       2018       3Q19                 2023F
                                                                                                                                                                                26
MINOR FOOD
Swensen’s High Fiber / Low Calories Ice Cream
Minor Food – Financial Highlights
9M19 revenue of Minor Food grew by 1% y-y, primarily because of the outlet expansion, which offset the slowdown of the overall same-store-sales
from the weak macro backdrop. EBITDA and net profit declined y-y by 9% and 24% respectively. Despite improved profitability of the China hub,
overall margins were under pressure, which resulted from the contraction of same-store-sales, together with investment and expenses in growing
sales and strengthening of digital capabilities in Thailand.
 THB million                                                     -3% y-y             +1% y-y                                        KEY HIGHLIGHTS
                                                                            17,728 17,919                                    • The Pizza Company, Burger King, The Coffee Club and
                                                 6,367                                            Total-system-sales
               6,085 5,806      5,836 5,756                                                                                    Riverside reported positive total-system-sales growth as
                                                          5,865 5,686
                                                                                                  growth of                    the brands continued to selectively open new outlets.
  Revenue
                                                                                                  4.3%                       • Total-system-sales growth was positive throughout the
                                                                                                  in 9M19                      first nine months, driven by outlet expansion of China
                                                                 -23% y-y            -9% y-y
                                                                                                                               and Thailand hubs.
                                                                             2,938
                                                                                       2,680
               1,123                             1,103
                        903      911                       879      698
                                          710                                                     Outlet expansion           • The drivers of outlet expansion during the past 12
  EBITDA                                                                                          6%                           months continued to be The Pizza Company, Dairy
                                                                                                  in 9M19                      Queen, Burger King, The Coffee Club and Riverside.
 EBITDA        18.5% 15.6% 15.6% 12.3% 17.3% 15.0% 12.3%                    16.6% 15.0%
 Margin
                                                                 -41% y-y            -24% y-y
                                                                             1,248                                           • China hub reported positive SSSG in 9M19 (driven by
                548                                475                                 951                                     1H19), but it was not sufficient to offset the negative
                                 350
                                                                                                  Same-store-sales
                         350             273               269
                                                                                                                               same-store-sales growth of Thailand and Australia hubs
   NPAT                                                             207                           growth of
                                                                                                                               which continued to face challenging macro conditions.
                                                                                                  -3.8%                      • Minor Food will continue to strengthen its multi-brand
 Net           9.0%     6.0%     6.0%    4.7%    7.5%     4.6%     3.6%      7.0%      5.3%
 Margin                                                                                           in 9M19                      portfolio through product innovations and accessibility,
                                                                                                                               especially through delivery.
               1Q18    2Q18     3Q18 4Q18 1Q19            2Q19     3Q19      9M18 9M19

* The financials above reflect performance from operation, and therefore exclude non-core items in as detailed on page 47.                                                                28
Minor Food – International Presence
MINT operates three restaurant hubs: Thailand, China and Australia. MINT’s restaurant presence is now in 26 countries across the region, operating
owned, franchised and a combination of both business models. MINT continues to look for opportunities to expand, especially in these existing
markets.

            Owned
            Franchised
            Combination

            Hubs

                REVENUE CONTRIBUTION

100%
          19%
                    35%      37%     40%
75%
                                             International
50%
          81%                                Thailand
                    65%      63%     60%
25%

 0%
         2008      2018*     9M19*   2023F
 * Excludes non-core items

                                                                                                                                                 29
Minor Food – Operational Performance
3Q19 total-system-sales of the restaurant business grew by 3.7%, driven by selective outlet expansion of 6% y-y, primarily in China, Thailand and
developing hubs. Same-store-sales declined by 3.7% in 3Q19, as a result of slow consumption and weak macro backdrop across all major hubs.

                                SSS & TSS GROWTH                                                   RESTAURANT OUTLETS BY GEOGRAPHY
                                                                                         International                                4,462
                   Same-Store-Sales Growth           Total-System-Sales Growth           Thailand
                                                                                                                    +6% y-y            37%
   10%
                                                                                                            2,270    2,297
                                                                                                             34%     34%
                                                                                        1,043                                          63%
                                                        5.3%
                                                                                         33%                 66%     66%
    5%                                                             3.8%          3.7%    67%
                                             2.8%                                       2008                2018     3Q19             2023F
                                  0.7%
                                                                                                   RESTAURANT OUTLETS BY OWNERSHIP
    0%                 -0.7%
           -1.7%                                                                          Franchised                                   4,462
                                                                                          Owned
                        -3.1%
           -1.8%                  -3.8%                 -4.0%      -3.6%    -3.7%                                                      51%
                                             -4.3%                                                                  +6% y-y
                                                                                                            2,270    2,297
   -5%
           1Q18         2Q18      3Q18       4Q18       1Q19       2Q19      3Q19                            49%      50%
                                                                                        1,043                                        59%49%
                                                                                         38%
                                                                                                              53%
                                                                                                             51%     50%
                                                                                                                     50%
                                                                                         62% 82%
 No. of
           2,085        2,130     2,174      2,270      2,254      2,268     2,297      2008                 2018    3Q19              2023F
 Outlets

                                                                                                                                                30
Thailand Hub
                 Thailand   Revenue from domestic operations accounted for over 60% of total restaurant revenue in 9M19. Amidst the challenging
                   63%      economic environment, Minor Food started to see some improvements in its same-store-sales performance with
     9M19
   Minor Food               continued effort on product innovations, promotional campaigns and delivery initiatives.
    Revenue

                     THAILAND’S SSS & TSS GROWTH                                                        KEY HIGHLIGHTS
                                                                          • Same-store-sales: Thailand’s SSS declined by 5.0% in 3Q19, an improving
        Same-Store-Sales Growth        Total-System-Sales Growth
                                                                            trend q-q for the third consecutive quarter:
 10%                                                                           ‒ In terms of brands, Burger King has seen significant recovery, with
                                                                                 same-store-sales growth of +9% in Sept;
                                                                               ‒ Bangkok has seen notable m-m improvement in same-store-sales
  5%                                                                             trend, attributable to the focus on delivery.
                                                                          • Total-system-sales:
  0%                                                                          ‒ Thailand hub selectively expanded its network of outlets, especially the
                                                                                 franchised outlets of The Pizza Company and Dairy Queen;
                                                                              ‒ With outlet expansion of 7% in 3Q19, Thailand’s TSSG was 2.1%.
  -5%
                                                                          • 2019 Strategies:
                                                                              ‒ Focus on customer accessibility, both through physical and digital
                                                                                channels;
 -10%
          1Q18       2Q18     3Q18   4Q18     1Q19     2Q19        3Q19       ‒ Continue with product innovations, ensuring that the brands remain
                                                                                relevant for customers; and
                                                                              ‒ Leverage on digital technology, including areas of operations, customer
                                                                                service and ordering, loyalty and e-payment and big data analytics.
                                                                                                                                                           31
Thailand Hub – Delivery
With the marketplace expanding from dine-ins to delivery services, Thailand hub has focused its efforts on both its own delivery platform and third-
party aggregators.

                                                                                                                                                   32
Thailand Hub – Product Innovation
In order to maintain its position with products that are on top of mind of customers, Minor Food continues to create excitement through product
innovations for all of its brands.

    The Pizza Company’s Cheesy Shrimp Pizza             Burger King’s Cheesy Truffle Fries                Dairy Queen’s Super Sundae

           Sizzler’s Cold-Pressed Juice                    Sizzler’s Plant-Based Menu                        Swensen’s Bingsu Cake

                                                                                                                                              33
China Hub
                              China hub is expected to remain one of MINT’s growth drivers as MINT is confident in the strong growth prospect of the
            9M19              country, supported by growing middle class and increased urbanization trend. Riverside continues to be the main driver of
 China    Minor Food          China hub. In 9M19, net profit of China hub more than doubled y-y, from the effective cost control.
  15%      Revenue

                        CHINA’S SSS & TSS GROWTH                                                            KEY HIGHLIGHTS

            Same-Store-Sales Growth         Total-System-Sales Growth          • Same-store-sales: China’s SSSG declined by about 2% in 3Q19, primarily
                                                                                 from lower traffic amidst the slowing economy.
   25%
                                                                               • Total-system-sales: With the continued outlet expansion of 17%, the TSSG
   20%                                                                           was 9.3% in 3Q19.

   15%                                                                         • 3Q19 Update: Riverside launched its loyalty program in August 2019, with
                                                                                 the focus on driving traffic to the stores and leverage on CRM.
   10%
                                                                               • 2019 Strategies:
    5%
                                                                                  ‒ Continue to expand Riverside outlets, with the aim to dominate the
    0%                                                                              grilled fish segment in Beijing and Shanghai and surrounding areas (Tier
                                                                                    2);
    -5%
                                                                                  ‒ Improve customer experience for Riverside brand, both through store
   -10%                                                                             uplift and food traceability programs; and
            1Q18       2Q18      3Q18    4Q18    1Q19      2Q19     3Q19
                                                                                  ‒ Invest in system for efficiency and focus on CRM and loyalty program to
                                                                                    increase sales.

                                                                                                                                                               34
China Hub – Building Customer Loyalty
Riverside’s will further build customers’ loyalty through digital loyalty program and food traceability.

                  Digital Loyalty Program                                                               Food Traceability

   • Digital loyalty program was launched on WeChat.          • As part of Riverside’s marketing plan, China hub is building public awareness on its fish
   • Riverside is able to recruit 200,000 new members           quality through various channels, including TV news coverage and printed ad.
     per month.                                               • Riverside is the first grilled fish brand in the market to provide farm to table traceable ‘live’
                                                                fish, providing customers with the highest level of food safety and raw ingredient
                                                                traceability.

                                                                                                                                                                    35
Australia Hub
Australia                       In 9M19, Australia hub’s revenue contributed 11% of total restaurant business. Although revenue increased in AUD term,
  11%                           revenue in THB term declined by 7% because of the weakening of the AUD. Australia hub was able to maintain profitability
              9M19
            Minor Food          in 9M19, despite the contraction of both same-store-sales and total-system-sales.
             Revenue

                         AUSTRALIA’S SSS & TSS GROWTH                                                          KEY HIGHLIGHTS

                                                                                  • Same-store-sales: Australia’s SSS declined by 1.9% in 3Q19, as Australia's
              Same-Store-Sales Growth          Total-System-Sales Growth
                                                                                    economy slowed to its most sluggish pace since 2009.

 5.0%                                                                             • Total-system-sales: The trend of TSSG improved to -1.2%, supported by the
                                                                                    expansion of The Coffee Club International and Nomad’s strong coffee
                                                                                    volume sold through Aldi supermarket.
 0.0%
                                                                                  • 2019 Strategies:
                                                                                      ‒ Grow The Coffee Club business in Australia through:
 -5.0%                                                                                    o brand relevance, especially through delivery business
                                                                                              (partnership with UberEats and potentially other aggregators),
                                                                                              and
-10.0%                                                                                    o differentiation through hero products and loyalty program;
                                                                                      ‒ Drive international expansion of The Coffee Club brand in both existing
                                                                                        and new markets, where the main driver continues to be Thailand; and
-15.0%
             1Q18        2Q18      3Q18    4Q18     1Q19       2Q19        3Q19
                                                                                      ‒ Expand coffee roasting business through all channels:
                                                                                          o retail channel through The Coffee Club and white label business,
                                                                                              and
                                                                                          o wholesale channel through supermarkets.

                                                                                                                                                                  36
Australia Hub – Domestic Operations
Australia hub focuses on product innovation and loyalty program, as well as delivery through partnership with Uber Eats with the target to improve
traffic.

                        Loyalty Programs & App                                    Product Innovation                   Delivery Partnership

                                                                                                                                                 37
Minor Food – 4Q19 Priorities
Amidst today’s rapidly changing competitive landscape, Minor Food has identified key priorities to be implemented for the rest of the year. In
addition, the acquisitions will bring in additional revenues and NPAT which will enhance Minor Food’s growth trajectory in the long term.

                DRIVING SSSG                               DIVERSIFIED EXPANSION                          FOCUSING ON PROFITABILITY

                      1
              Focus on delivery                                 Physical Stores                                          1

                                                       Selective expansion through new                  Upgrading facilities / relocation to
                      2                               channels : Transportation hubs, new                     higher traffic areas
                                                         smaller-scale communities &
              Drive local menus
                                                                  marketplace

                      3
           Increase day-part traffic                                Digital                                              2

                                                                                                         Driving digital transformation to
                                                        Growth through both own app /
                                                                                                               increase productivity
                      4                               platform and third-party aggregators
               Grow occasions

       In addition to the efforts to improve the operational performance above, the investment in Bonchon will also become another
                                                  growth driver of Minor Food going forward.

                                                                                                                                               38
MINOR LIFESTYLE
Minor Lifestyle – Financial Highlights
9M19 revenue of Minor Lifestyle was up 11%, driven primarily by retail trading business. EBITDA and NPAT declined by 9% and 56% respectively
because of higher proportion of the lower margin sales with discounts and promotions campaigns of retail trading business and lower operating
leverage of the contract manufacturing business.

                                                          +12% y-y           +11% y-y                                  KEY HIGHLIGHTS
 THB million
                                                                                        Retail trading               • 9M19 revenue from retail trading increased by
                                                                              3,563
                                     1,234 1,251 1,120 1,192         3,205                                             14%, mainly from Anello, OVS, Radley, Bossini,
               1,130   1,014 1,062                                                      80%
                                                                                        of 9M19 Minor Lifestyle        Charles & Keith Bodum, Henckels and Joseph
                                                                                        revenue                        Joseph.
  Revenue

                                                                                        Contract manufacturing
                                                          -17% y-y           -9% y-y                                 • 9M19 revenue from contract manufacturing
                                                                                        20%                            increased by 1%, impacted by the slow retail
                                                                     221
                                                                               201      of 9M19 Minor Lifestyle        environment.
                 72     83            85     84
                               67                   62                                  revenue
                                                             56
  EBITDA
                                                                                                                     SSS & TSS GROWTH
 EBITDA        6.3%    8.2%   6.3%   6.9%   6.7%   5.5%    4.7%      6.9%      5.6%
 Margin                                                                                            19.4%                                                     20.1%
                                                                                                                                                                  TSSG
                                                                             -56% y-y                        12.4%                                 11.4%
                                      51                              79                                                                  8.0%
                                                                                                   3.1%                 3.9%     2.4%                        6.1%
                30     30                    31                                                                                                    1.3%             SSSG
                               19                                               35                           -2.5%                        -1.3%
   NPAT                                             6        -2                                                                  -8.3%
                                                                                                                       -8.1%
 Net           2.7%    3.0%   1.8%   4.1%   2.4%   0.5%     NM       2.5%      1.0%
 Margin                                                                                             1Q18    2Q18       3Q18      4Q18     1Q19     2Q19      3Q19
               1Q18    2Q18 3Q18 4Q18 1Q19 2Q19 3Q19                 9M18 9M19          No. of Shops 416     429        452      490       486      496      486

                                                                                                                                                                           40
Corporate Information
   & Five-Year Plan
CAPEX & Balance Sheet Strength
CAPEX plans include committed CAPEX of projects in the pipeline. With the successful asset rotation strategy, interest bearing debt to equity ratio
declined to 1.35x at the end of 3Q19, very close to MINT’s internal policy target of 1.3x. MINT and its senior unsecured debentures have “A” rating
by TRIS. Going forward, source of fund for the committed CAPEX requirement will primarily be internal cash flow and debt financing.

                                      CAPEX PLANS                                                                              LEVERAGE RATIOS
                                                                                              X
  THB million                                                                         X       1.8
   100,000
    30,000                                                                           6.0      1.6
                                                                                              1.4                                                                 1.35   1.30x Internal
    25,000                                                                           5.0      1.2                                                                               Policy
                                                                                                                                                                  1.21
                                                                                              1.0
    20,000                                                                           4.0      0.8
                                                                                                        1Q18      2Q18     3Q18     4Q18      1Q19    2Q19       3Q19    YE19
    15,000                                                                           3.0                                                                                Target
                                                                                                      Interest Bearing Debt to Equity           Net Interest Bearing Debt to Equity
    10,000                                                                           2.0
                                                                                                                             BACK-UP FINANCING
     5,000                                                                           1.0      THB million                               Note: Cash on hand as at end of
                                                                                                  200,000                                     3Q19 is THB 11,987 million
          0                                                                          0.0          150,000                Equity
                 2018      2019F       2020F       2021F      2022F       2023F                                          82,765
                                                                                                  100,000                                              Equity*
                  Minor Food             Minor Hotels            Minor Lifestyle                                          Debt                          9,928
                                                                                                   50,000                112,085                        Debt
                            EBITDA coverage on committed CAPEX                                                                                         59,298
                                                                                                         0
                                                                                                             Outstanding Borrowing & Equity      Un-Utilized Facility
   * 2018 CAPEX includes investments in Benihana, Riverside, Food Theory and NH Hotel Group       * Assume 100% conversion of MINT-W6
                                                                                                                                                                                      42
Strengthening of Balance Sheet
MINT is prudent on the management of its leverage level and focuses on consistently improve the quality of its balance sheet. Many initiatives have
been implemented over the past year in order to ensure strong balance sheet position.

    Term Out of Loans for      • The average maturity of the loans has been extended to over 6 years.
      NHH Acquisition          • All-in interest rate is below 3%.
         Completed
                               • All fundings have been swapped into Euros.

                               • The proceeds from the successful asset rotation strategy of the sale-and-lease-back transaction of 3 Tivoli properties have
   Partial Loan Repayment        been used to partially repay debt.
     from Asset Rotation
                               • MINT’s interest bearing debt declined from THB 125 billion at the end of 2Q19 to THB 112 billion at the end of 3Q19.
            Strategy
                               • As a result, D/E ratio declined from 1.55x at the end of 2Q19 to 1.35x at the end of 3Q19

                               • The definition of “interest bearing debt” in the calculation of debt covenant has been amended to exclude the lease
  Amendment of Covenant
                                 liabilities, in anticipation of the IFRS 16, which will become effective 2020.
       Calculation
                               • Such definition is applicable to all creditors – financial institutions and bondholders.

                               • The recent favorable account treatment of perpetual bonds is being validated by The Federation of Accounting Professions
      Perpetual Bond             for at least until the end of 2022.
        Treatment
                               • The formal validation is expected to be before end of 2019.

                                                                                                                                                               43
MINT’s Five-Year Strategy

                Revenue Growth                                        NPAT Growth
                                                                                                                                  ROIC = 12%
   2023           > 10% CAGR                                            15-20%
   Goals
                                          Employer of Choice                                    Sustainable Business

                                                           Investments,
             Winning Brand         Value Capture &                               Innovation &               Empowered                  Sustainable
                                                          Partnerships &
               Portfolio             Productivity                                   Digital                People & Team               Framework
                                                            Acquisitions

                                 Brands & value chains                           Ensure                                               Good Corporate
                                     monetization                            1   commitment             Superior    Sustainable        Governance
                                                                                                        workforce   leadership
  Growth                         Margin enhancement                          2      Set clear targets                              People      Customers
   Pillars                       through integration
                                 & shared operations                             Leverage
                                                                             3   ecosystem
                                  Capital optimization                           partners                                         Partners Environment
                                    with asset right
                                                                                                            Engaging work
                                 strategy & mixed-use                            Promote digital                                    Social Responsibility
                                        business                             4                               environment
                                                                                 culture                                                  Mindset

                                                                                                                                                            44
Five-Year Aspiration

                                                                                    2023F
                                                                  2023
                                                                                    •   > 630 hotels
    3Q19                                                                            •   > 250 residences built
    •   529 hotels                                                                  •   > 500 vacation club units
    •   132 residences built to date                   2018                         •   > 4,400 restaurants
    •   238 vacation club units                  REVENUE THB 78.5 bn
                                                                                    •   > 600 retail shops & POS
    •   2,297 restaurants
    •   486 retail shops & POS                                                          (>46,000 sq.m.)
        (31,704 sq.m.)

                                         2009
                                   REVENUE THB 17.2 bn                   2009
                                                                         • 30 hotels
                                                                         • 1,112 restaurants
                                                                         • 292 retail shops & POS
                                                                           (14,275 sq.m.)

                                                                                                                    45
APPENDIX

Al Najada Doha Hotel Apartments by Oaks
Non-Core Items
                    Amount
        Period                        Business Unit                                     Non-recurring Items
                 (THB million)
                 4,743 revenue
                                       Minor Hotels      Gain from Tivoli asset sales
                 3,512 net profit
                  35 revenue
                                       Minor Hotels      Non-recurring revenue and expenses of NH
        3Q19      -1 net profit
                       -46             Minor Hotels      Foreign exchange loss on unmatched USD Cross-Currency Swap
                                      Minor Hotels /     Expenses and provisions related to Corbin & King, Ribs & Rumps, certain
                      -322
                                       Minor Food        brands in Singapore hub
                                      Minor Hotels /
                   -48 pre-tax
                                    Minor Food / Minor   Loss from retirement benefit
                  -38 post-tax
                                         Lifestyle
        2Q19
                   62 revenue
                                       Minor Hotels      Capital gain from asset rotation of NH Hotel Group
                  44 net profit
                      -320             Minor Hotels      Foreign exchange loss on unmatched USD Cross-Currency Swap
                       50              Minor Food        Gain from the divestment of Bread Talk Thailand
                   132 pre-tax
        1Q19                           Minor Hotels      Capital gain from asset rotation of NH Hotel Group
                   91 post-tax
                      -191             Minor Hotels      Foreign exchange loss on unmatched USD Cross-Currency Swap
                       708             Minor Hotels      Gain on fair value adjustment of investment in NH Hotel Group
                      -800             Minor Hotels      Loss from changing status of investment in NH Hotel Group
                       -96             Minor Hotels      Impairment charge of investment in Oaks Gladstone
        4Q18       -280 pre-tax
                                       Minor Hotels      Impairment of investment in Rani (Mozambique)
                  -232 post-tax
                      -125             Minor Food        Impairment of investment in GrabThai in UK
                       -87             Minor Hotels      Foreign exchange loss on unmatched USD Cross-Currency Swap
                                                                                                                                   47
You can also read