Q3 FY19 Noteholder Presentation
←
→
Page content transcription
If your browser does not render page correctly, please read the page content below
Q3 FY19
Three months ended 30 June 2019

Noteholder Presentation
27 AUGUST 2019
Q3 F Y1 9 NOTEHOLD E R PRESE NTAT IO N

Disclaimer

This presentation and any other presentation (the “Presentation”) has been prepared by Selecta Group B.V. (the “Company” and together with its subsidiaries, “we,” “us” or the “Group”) solely for informational purposes and
has not been independently verified. The Company reserves the right to amend or replace this Presentation at any time. This Presentation is valid only as of its date, and the Company undertakes no obligation to update the
information in this Presentation to reflect subsequent events or conditions. This Presentation may not be redistributed or reproduced in whole or in part without the consent of the Company. Any copyrights that may derive
from this Presentation shall remain the sole property of the Company.

These materials do not constitute or form part of, and should not be construed as, any offer for sale or subscription of, or solicitation of any offer to buy or subscribe for any securities of the Company in any jurisdiction.

No representation, warranty or undertaking, express or implied, is made as to, and no reliance should be placed on, the fairness, accuracy, completeness or correctness of the information or the opinions contained in this
Presentation. The Company, or any of its affiliates, advisors or representatives, shall have no liability whatsoever (in negligence or otherwise) for any loss howsoever arising from any use of the Presentation or its contents. The
information contained in the Presentation does not constitute investment advice.

The market and industry data and forecasts included in this Presentation were obtained from internal surveys, estimates, experts and studies, where appropriate, as well as external market research, publicly available
information and industry publications. The Company and its affiliates, directors, officers, advisors and employees have not independently verified the accuracy of any such market and industry data and forecasts and make no
representations or warranties in relation thereto. Such data and forecasts are included herein for information purposes only and no reliance should be placed on, the fairness, accuracy, completeness or correctness of the
information in this Presentation, the opinions expressed herein or any other statement made or purported to be made in connection with the Company or the Group, for any purpose whatsoever. No responsibility, obligation or
liability is or will be accepted by the Company or its affiliates or their respective directors, officers, employees, agents or advisers in relation to this Presentation. To the fullest extent permissible by law, such persons disclaim
all and any responsibility or liability, whether arising in tort, contract or otherwise which they might otherwise have in respect of this Presentation.

Third-party industry publications, studies and surveys generally state that the data contained therein have been obtained from sources believed to be reliable, but that there is no guarantee of the accuracy or completeness of
such data. While the Company believes that such publications, studies and surveys have been prepared by a reputable source, the Company has not independently verified such data. In addition, certain of the industry and
market position data referred to in the information in this Presentation has come from the Company's own internal research and estimates, and their underlying methodology and assumptions may not have not been verified by
any independent source for accuracy or completeness and are subject to change without notice. Accordingly, undue reliance should not be placed on any of the industry or market position data contained in this Presentation.

This Presentation includes “forward-looking statements” that involve risks, uncertainties and other factors, many of which are outside of the Company’s control and could cause actual results to differ materially from the
results discussed in the forward-looking statements. Forward-looking statements include statements concerning the Company’s plans, objectives, goals, future events, performance or other information that is not historical
information. All statements other than statements of historical fact referred to in this Presentation are forward-looking statements. Forward-looking statements give the Company's or the Group's current expectations and
projections relating to its financial condition, results of operations, plans, objectives, future performance and business. These statements may include, without limitation, any statements preceded by, followed by or including
words such as "target," "believe," "expect," "aim," "intend," "may," "anticipate," "estimate," "plan," "project," "will," "can have," "likely," "should," "would," "could" and other words and terms of similar meaning or the negative
thereof. Such forward-looking statements, as well as those included in any other material, are subject to known and unknown risks, uncertainties and assumptions about the Company, its present and future business strategies,
trends in its operating industry and the environment in which it will operate in the future, future capital expenditure and acquisitions. In light of these risks, uncertainties and assumptions, the events in the forward-looking
statements may not occur or the Company's or the Group's actual results, performance or achievements might be materially different from the expected results, performance or achievements expressed or implied by such
forward-looking statements. None of the Company, its affiliates or their respective directors, officers, employees, agents or advisers undertake to publicly update or revise forward-looking statements to reflect subsequent
events or circumstances after the date made, except as required by law.

This Presentation contains financial information regarding the businesses and assets of the Company and the Group. Such financial information may not have been audited, reviewed or verified by any independent accounting
firm. Certain financial data included in this Presentation consists of “non-IFRS financial measures.” These non-IFRS financial measures, as defined by the Company, may not be comparable to similarly titled measures as
presented by other companies, nor should they be considered as an alternative to the historical financial results or other indicators of the Company’s financial position based on IFRS. Even though the non-IFRS financial
measures are used by management to assess the Company’s financial position, financial results and liquidity and these types of measures are commonly used by investors, they have important limitations as analytical tools, and
you should not consider them in isolation or as substitutes for analysis of the Company’s financial position or results of operations as reported under IFRS. The inclusion of financial information in this Presentation should not be
regarded as a representation or warranty by the Company, or any of its affiliates, advisors or representatives or any other person as to the accuracy or completeness of such information’s portrayal of the financial condition or
results of operations of the Group and should not be relied upon when making an investment decision.

This Presentation does not constitute or contain any investment, legal, accounting, regulatory, taxation or other advice.

Due to rounding, numbers presented through out this and other documents may not add up precisely to the totals provided and percentages may not precisely reflect the absolute figures.

                                                                                                                                                                                                                                             2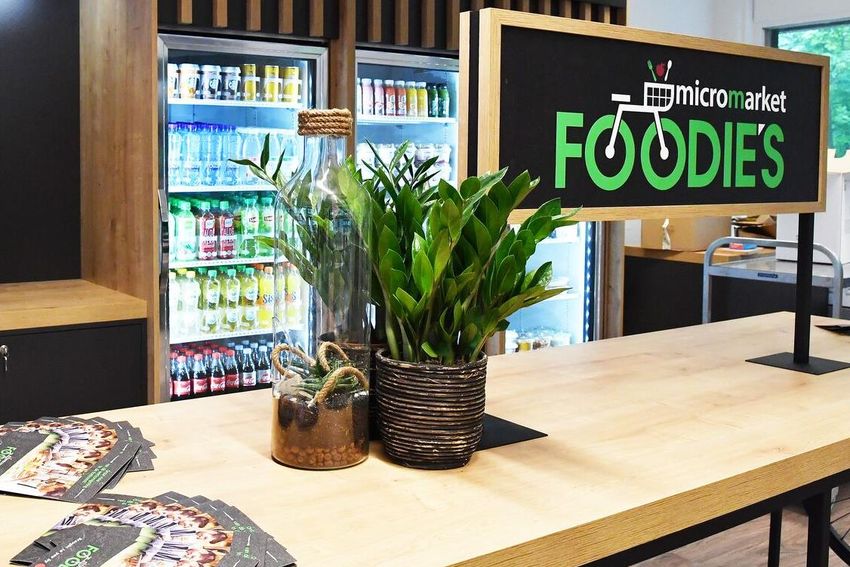
Presenters
David Flochel   Gabriel Pirona

    CEO             CFO
Agenda
01 – Q3 Highlights

02 – Selecta Today

03 – Strategic Initiatives

04 – Q3 Financials

05 – FY19 Outlook

01
Q3 Highlights

Q3 F Y1 9 NOTEHOLD E R PRESE NTAT IO N

01   Q3 Highlights
        Another strong quarter

                                   Financial highlights

     • Revenue1
     Continued strong growth driven by organic performance (organic
     growth up 4.1% YoY in Q3 FY19 vs 3.4% YoY growth in Q3 FY18,
                                                                                                                                          €405.3m, up 6.3% vs Q3 FY18
                                                                                                                                                                                     ✓
     excluding turnaround markets of France and UK)

     Revenue for LTM June 2019: €1,593.2m

     • Adjusted EBITDA1
     Adjusted EBITDA milestone reached: €270.2m LTM June 2019
                                                                                                                                          €68.1m, up 15.3% vs Q3 FY18
                                                                                                                                                                                     ✓
     Progress driven by synergy programme benefits, while continuing
     to invest in growth initiatives

     • Adjusted EBITDA1 less net capex
     Continued strong performance of EBITDA less capex
                                                                                                                                          €29.4m, up 13.3% vs Q3 FY18
                                                                                                                                                                                     ✓
     Adjusted EBITDA less net capex for LTM June 2019: €132.2m

           1   At constant foreign currency rates (constant foreign currency rates applied: CHF/EUR 1.15; SEK/EUR 9.65; GBP/EUR 0.88). 2018 figures are pro forma

                                                                                                                                                                                                         6
Q3 F Y1 9 NOTEHOLD E R PRESE NTAT IO N

01        Q3 Achievements
           Delivering on our strategy

                    Strategic priorities        Q3 progress
                                           •   Strong customer retention rates maintained
                                           •   Continued growth in new business pipeline
     01       Sales Excellence             •   Benefit from employee engagement programmes
                                           •   Organic portfolio growth delivered

                                           •   Central pricing / category management programme underway
     02         Pricing / SMD              •   Emphasis on technology and data driven approach to support pricing strategy

                 Operational               •   Continued focused on increasing route density resulting in improved operational efficiencies
     03
                 Excellence                •   Synergy programme remains on target

                Technology &
 04                                        •   Continued roll-out of cashless technology driving higher average transaction value (ATV)
                 Innovation                •   Completed public segment roll-out of telemetry where technically possible

                   Asset                   •   Continued disciplined approach to capex
 05                                        •   Focus on machine park – refurbishment programme and active re-siting
                 Management                •   Leveraging capex-free model to reduce annual depreciation charge

                                           •   Continued focus on accretive bolt-on M&A to leverage and increase route density
     06               M&A                  •   Remain on track to reach target of 3-5% of sales per annum through acquisitions in the
                                               medium term

                                           •   Introduced employee survey (across 10,000 employees) with plans to implement tailored action
                                               plans per team based on results
     07             People                 •   Continued focus and investment in people strategy, including employee training programmes with
                                               focus on sales and operational teams

                                                                                                                                                    7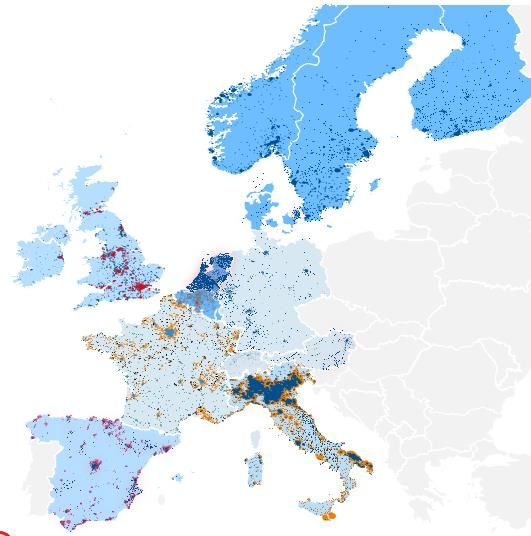
02
Selecta Today

Q3 F Y1 9 NOTEHOLD E R PRESE NTAT IO N

02   Leading Route Based Unattended Self Service Coffee and
     Convenience Food Provider in Europe

           Leading route based Food & Beverages provider with installed                                                                                   What we sell
           base of c. 476k machines serviced by unique logistics network                                                                                  % of FY18 revenue3

                                                                                                                                                                 10%                              Coffee & hot drinks (owned and partner premium brands)

                                                                                                                                                                                                  Impulse (diverse range of snacks, cold drinks, healthy
           Operations in 16 countries covering c.95% of European GDP and                                                                                  30%
                                                                                                                                                                                                  options, fresh food)
           c.78% of the population                                                                                                                                             60%

                                                                                                                                                                                                  Trade2 (ingredients and equipment)

           #1 or #2 position in 10 markets1
                                                                                                                                                                                                        Global Premium coffee partnerships

          Poised for organic growth and accretive M&A in a highly                                                                                         Where we sell it
          fragmented market                                                                                                                               % of FY18 revenue3

                                                                                                                                                                                                  Workplace & Private Segment
                                                                                                                                                               16%                                Vending and office coffee services for private businesses
                                                                                                                                                                                                  serving employees
          Serving over 10 million consumers daily via more than 3,800                                                                                                          49%                On-the-Go & Public
          routes (as of 30 June 2019)                                                                                                                                                             Tailored coffee and snacking offering in Public locations
                                                                                                                                                            35%                                   (train stations, petrol stations and airports) and Semi Public
                                                                                                                                                                                                  (Hospitals, public schools, entertainment venues)

                                                                                                                                                                                                  Trade
                                                                                                                                                                                                  Full suite of service and products to customers, including the
          Diversified product offering including snacks, healthy options,                                                                                                                         sale of coffee, ingredients and machines as well as third-
          cold drinks and fresh food and strong partnerships with global                                                                                                                          party technical services
          premium coffee brands Starbucks and Lavazza

     1Market data as of 2017 for Switzerland, Sweden, France, the United Kingdom, Italy, Netherlands and Spain markets; estimated market data (based on internal estimates) as of 2017 for Belgium, Finland and Norway
     2Includes sale of machines to leasing partners, other goods and 3rd party servicing (mainly technical services)
     3 Revenue at constant currency and figures are pro forma

                                                                                                                                                                                                                                                                   9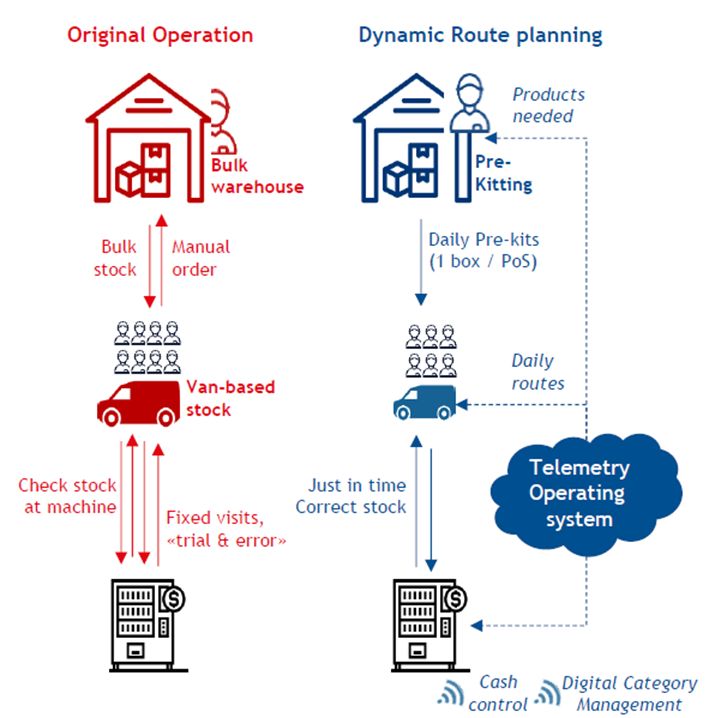
Q3 F Y1 9 NOTEHOLD E R PRESE NTAT IO N

02   Our Route-Based Model
      Scale Driven Business Model Creating Attractive Economics

                                                                                                                                                  1
                                                                                                                                   Procurement of Machines
                                                                                                                                       and Merchandise

                                                           Coffee Roaster,                           Technical                    • Selecta procures machines and
                                                                                  Operated                                          spare parts from machine
                                                            Cold Drinks &                           Warehouse &                     manufacturers and merchandise
                                                                                Points of Sale
                                                           Snacks Suppliers                       Finishing Centre                  from FMCG companies
                                                                                                                                  • Company procures centrally
                                                                                                                                    and locally

                                                                                                                                                  2
                                                                                                                                            Installation
                                                            Product                                                               • A technician delivers and
                                                                                                                                    installs the machine
                                                                                                                                    at customer’s site
                      3                                                                                                           • All relevant technology is set
                                                                                                  Installation                      up and functioning and the
           Filling and Cleaning
                                            Merchandiser          Cleaning                        Maintenance        Technician     concept is configured for the
       • Merchandisers visit machines                                                                                               customer’s requirements
         regularly to refill and clean                                Refills                    Replacement
       • Data is used to optimise the                                                               Repairs
         product range within a given                                                                                                             4
         machines and telemetry ensures
         visits are only scheduled when                                                                                             Maintenance and Repair
         machine actually needs refilling
                                                                                Customer sites                                    • Technicians visit machines to
                                                                                                                                    repair them or perform regular
                                                                                                                                    maintenance
                                                                                                                                  • Technicians increasingly use
                                                                                                                                    telemetry data to ensure quick
                                                                                                                                    and timely visits as soon as
                                                                                                                                    needed

                                                    •   Scale brings high density of sites
                                                    •   Enhances dynamic route planning
                                                    •   Drives efficient and high quality customer service
                                                    •   Benchmarking with and learning from leading route-based businesses

                                                                                                                                                                       10
Q3 F Y1 9 NOTEHOLD E R PRESE NTAT IO N
02 Unique Route-Based Model with High Density on the Last Mile
European Density Map Leading Route Density
• Selecta’s route-based operation
represents a distinct competitive
advantage on the last mile and
beyond
~3,800+
Routes
• Own granular depot structure
• High route density, managed
with dedicated planning teams
~4 500
• Privileged access into customer Route Merchandisers
building
• Enables less employees and lower cost
to service
~1 400
Route Technicians
• Leading density creates high entry
barriers, and provides attractive unit
economics for growth and bolt-on
acquisitions
>6 900
• High customer intimacy, with access Vehicles
to customer buildings and c.19,398
high-visibility public points of sale
Centralised planning
and tech support
~150 Planners
Note: Data as of 2018
Source: Company information
11Q3 F Y1 9 NOTEHOLD E R PRESE NTAT IO N
02 Recent Business Transformation Enabled by Focused Execution
A rich history underpinned by a recent accelerated transformation following acquisition by KKR in 2015
Culture focused on delivery of transformation milestones to deliver above market growth
Q3 2018 Q1 2019 Q3 2019
• Start of integration in France • Strong sales and EBITDA growth vs • Further strong sales and EBITDA growth vs prior
• Awarded “Outstanding supplier prior year year driven by organic growth FY’19
of the year” by Shell • Awarded “Best Coffee Supplier” by • S&P revised outlook rating to Stable from Negative
Custice in Sweden • Awarded Out.of.Home award in the Netherlands
for hot drinks, ‘On the Move’ category (June 2019)
• Acquisition of Express Vending • Continued strong sales and EBITDA growth
• 16 countries in Europe with 460,000 points of sale vs prior year
• Renewal of Nestle Starbucks contract – On the Go • Awarded Operational Excellence Prize by
FY’18 Award for hot drinks,
• Expansion of MicroMarkets outside Italy MEDEF in France
‘On the Move’ category.
• Sale of Custom Pack as non core The Netherlands,
June 2019
Q4 2018 Q2 2019
AUG ’18
Q3 contract wins, extensions
and installations
• Euro Garages
• Amsterdam UMC
Acquisition FEB ’18 • Repsol
by • Cinemas PathéGaumont
FY’17 • Madrid Barajas Airport
SEP ’17 • Texaco
FY’16
• Coco Cola
2015 • Volvo
• Welcome Break
Two new premium
partnerships
12Q3 F Y1 9 NOTEHOLD E R PRESE NTAT IO N
02 Favourable Consumer Trends Driving Future Market Growth
Positive Underlying Trends and Drivers Addressable market development1
Forecast CAGR CAGR
(€ in billions)
12-17 17-22
Unattended Self
47.1 Service Retail Market
(0.8%) 1.5%
• Supportive macro conditions driving consumer 2.5
Macro- spending growth, particularly out-of-home Food & 40.5
Beverages Private Vending (Workplace)
economic 36.4 2.3 11.3 4.8% 4.4%
Conditions • Increase in workforce driving growth in convenience 2.4 Public Vending (On-the-Go)
‘At Workplace’ 9.1
Convenience Food Services
7.2
Packaged Food
Canteens (Excluding Lunch)
18.2 1.6% 3.1%
15.7
14.5
• Premium coffee growth in coffee On-the-Go, driving 2.6 1.9% 3.3%
2.0 2.2
Premiumi- price above inflation
sation • Mix shift towards healthy products driving prices up 12.5
10.3 11.1 1.5% 2.3%
in snacks and cold drinks
2012A 2017A 2022E
(€ in billions)
19.0
• Shift towards convenience, preferences for fast and
Coffee
local consumption 16.0
Towards 14.0
• With increase in mobility, consumers prefer
Convenience
convenience formats while spending more time (and
money) on-the-go
2012A 2017A 2022E
Source: OC&C analysis, Euromonitor
1 Market size excludes capsules data as it is not available over time
1303 Strategic Initiatives
Q3 F Y1 9 NOTEHOLD E R PRESE NTAT IO N

02   Our Strategic Initiatives Driving Growth and Returns
       Key Pillars Underpin Recent Track Record and Continuing Robust Top-line Growth

                                                  Key Actions

                Sales                         •   Review / train / upgrade of sales teams
     01       Excellence                      •   Accelerate new wins and maximise retention

                                              •   Category management
           Pricing / Category
     02       Management
                                              •   Pricing initiatives across portfolio
                                              •   Premium formats roll-out

                                              •   Optimise route management (density, cost to serve,
              Operational
     03       Excellence
                                                  customer satisfaction)
                                              •   Synergies (SG&A, procurement, operations)

                                              •   Accelerated roll out of cashless and telemetry
            Technology &
     04      Innovation
                                              •   New concepts: MicroMarkets, premium coffee concepts
                                              •   Roadmap of further innovations

                                              •   Extend point of sale lifecycle through active refurbishment
            Asset/Portfolio
     05      Management
                                              •   Active re-siting of underperforming points of sale
                                              •   Increase of off balance sheet portfolio financing

                                              •   M&A function with a track record of highly disciplined
     06           M&A                             execution

                                              •   Strong culture of excellence and focus on customer
     07         People                            satisfaction
                                              •   Ongoing investment in training programmes

                                                                                                                                                     15
Q3 F Y1 9 NOTEHOLD E R PRESE NTAT IO N
03 Focused Drivers of Organic Growth Sales Excellence
Continued progress in Q3 FY19
Strong Customer Retention Rates Robust Pipeline4 (€m)
% retention rates1 Net sales
95.8 95.9
129 129 130 130
26 20 21
27
94.4 28 29
23 26
93.6
80 75 82 80
Mar '18 2,3 Sep '18 2,3 Mar '19 Jun '19 Sep-18 Dec-18 Mar-19 Jun-19
Negotiation Agreed Signed
• Retention rates maintained • Pipeline remains strong, with new opportunities replacing large
volumes of new business moving to installation in Q3,
• Levels now expected to stabilise at current high rates following demonstrating the effectiveness of our growth acceleration
successful customer retention programmes and improved initiatives
operational performance
• Growth in all three new business stages during Q3, in particular for
• Q3 FY19 clients retained: Agreed opportunities
• Nordea Bank • BASF
• Swedish Government • General Electric • Increased number of dedicated new business hunters and account
• Decathlon • EPFL Lausanne managers to maintain a strong pipeline into Q4 and beyond
• Ladisa • BASF
• Proctor and Gamble • Mercadona • Q3 FY19 notable wins, extensions and installations include:
• Sodexo
• Euro Garages • Madrid Barajas Airport
• Amsterdam UMC • Texaco
• Repsol • Coco Cola
• Cinemas PathéGaumont • Volvo
• SBB Swiss Railways • Welcome Break
1 LTM to end of month, includes Roaster, but excludes Express Vending
2 Incudes estimates for pre-acquisition, Pelican Rouge losses
3 H1 losses have been annualised for legacy Pelican Rouge entities
4 Expressed in net sales (i.e. excluding vending fees), at constant scope and constant currency
16Q3 F Y1 9 NOTEHOLD E R PRESE NTAT IO N
03 Focused Drivers of Organic Growth Sales Excellence
Continued progress in Q3 FY19
Continued Net Growth1 Like-for-Like Portfolio Growth2,3,4
% growth rates Number of machines (‘000)
Mar '18 Sep '18 Mar '19 Jun '19
7.8%
6.0%
6.1% 476
5.8% -4.2%
-5.6% 462 464
-6.4% 460
-4.1%
-4.2%
-5.6%
-6.4%
Gains ARO Losses ARO Net growth Q2 FY18 Q4 FY18 Q2 FY19 Q3 FY19
• Continued benefit from investment in employee training delivering further net growth
• Significant net growth achieved in Q3 across almost all markets and net growth expected to continue in Q4
• Significant driver of growth coming from agreement with Coca Cola to operate network of 6,500 machines in UK on a long term basis
• Capex light agreement leverages Selecta’s network density in the UK market
• Further organic portfolio growth bringing total machine park at end Q3 FY19 to c. 476,000
• Installation of machines in Madrid Airport following contract signed in Q2 FY19
• Proactive machine park management and continuation of strong retention rates results in acceleration of portfolio net growth
1 LTM to end of month
2 Express Vending machines were added in all periods for comparison purposes
3 Portfolio adjusted for the one-time disposal of Nespresso machines in France and specific portfolio management in Italy’s OCS channel (reduction of < 1.5€ SMD machines)
4 Q3 FY19 includes addition of 6,500 machines in UK following contract agreement
17Q3 F Y1 9 NOTEHOLD E R PRESE NTAT IO N
03 Pricing / SMD – Significant Opportunity Pricing / SMD
Clear Program Leading to Early Results
Dedicated Programme Sales1/Machine2/Day (€)
Significant Opportunity 11.31 11.33
Dedicated Programme Lead
Category
Category
Management B2B2C B2B
Management
Coffee / Hot Pricing Pricing
Impulse
Drinks
Right product in More premium Increase consumer Increase prices to
right machine coffee prices at machine B2B customer
Programme expected to delivery more than €10m benefit in FY19
Q3 FY18 Q3 FY19
• Central Programme Coordination – chaired by CEO and supported by SMEs
• Analytical approach – Emphasis on analytics supporting decision making and assessment of impact
• Execution & Tracking – Detailed execution and tracking of delivery
• Advanced opportunities via Big Data/Telemetry – now equipped to better monitor and analyse sales data and unlock pricing
capabilities such as dynamic pricing
• Recent category management activities – include optimisation of range performance and conversion to premium coffee
• Recent Pricing activities – include upselling, price differentiation, and systematic regular price increases
1 Revenue is before payment of vending fees and Excludes Express Vending in both quarters
2 Operated machines in On-the-go and Workplace channels (excluding water machines and trade)
18Q3 F Y1 9 NOTEHOLD E R PRESE NTAT IO N
03 Operational Excellence – Synergies Operational Excellence
Estimated €75m of Synergies Across Procurement, SG&A and Operations
Overview of Phase of Phase of Saving Savings
Cost Synergy Categories Implementation Realisation Expected
1
• Procurement synergies
• Ingredients
• Bought-in goods, disposables,
packaging and spares
Procurement • Indirect procurement –
€30m
significant share from
alignment of prices
2
• In-sourcing coffee production
1
• Consolidation of country HQs and
Group HQ
2
• Optimization of overhead and
SG&A corporate cost €13m
• Staff costs, office leases,
logistics and professional
fees, etc.
•
1 Increase in density
• Depot optimization
• Merchandiser and technician
networks
Operations €33m
• Telemetry
•
2 Best Practice transfer
Total
Further potential synergies upside
currently under assessment by
€75m¹
management
Synergy initiatives led by an integration team Full realisation of synergies by end of calendar year
reporting to Board of Directors 2020 with strong margin uplift potential
Source: Company information
¹ Total sum may differs due to rounding. Synergies programme as of Sep-17 based on cost base as of Mar-17.
19Q3 F Y1 9 NOTEHOLD E R PRESE NTAT IO N
03 Aims to Set Industry Standard for Innovation Technology &
Innovation
Focus on Leveraging Latest Technologies to Enhance Offering
Cashless Payment Systems Telemetry
• Seamless check-out experience and
removal of “blockers” (e.g., coin • Telemetry further enhances benefits of route based
availability, change) model
• Fully connected machines enabling dynamic real time
• Reduced price sensitivity and increased refill planning and remote monitoring
average basket value
• Increased operational efficiencies, reduced downtime and
• Based on economies of scale: costs, improved availability, real time performance data
Partnerships, unit economics, capabilities and better service
• Cuts merchandiser time by up to c.60%
• Public roll-out programme completed
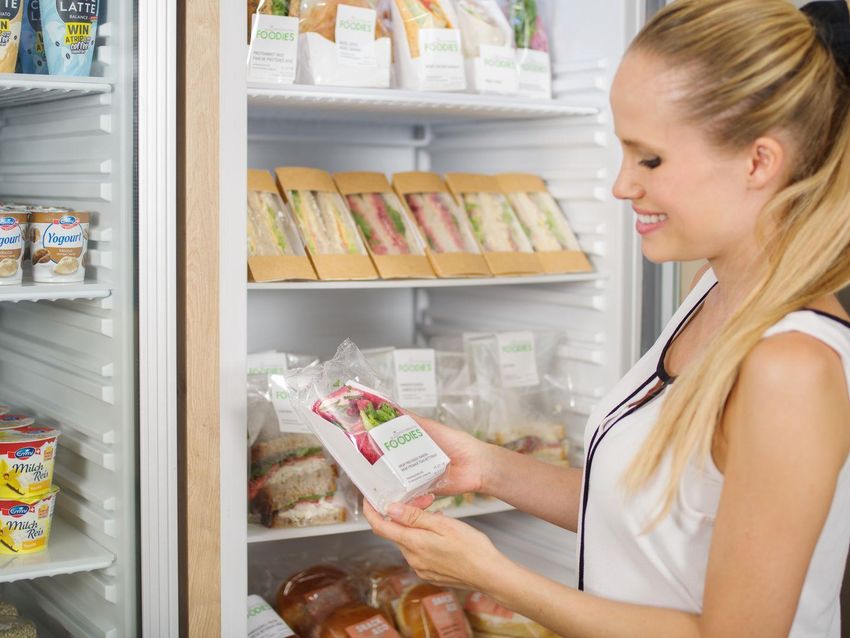
FOODIE’S MicroMarkets
• 24/7 digital self-service stores for the Workplace
• Unique product that meets new customer and consumer
trends
• MicroMarkets generate 2-3x sales vs vending profitability
and have lower capex requirements
20Q3 F Y1 9 NOTEHOLD E R PRESE NTAT IO N
03 Investing Efficiently to Grow the Points of Sale Asset Management
Stable Maintenance Capex Requirements with Disciplined Capex for Growth
Maintenance Capex Model Programme Leading to Reduction of
Gross Maintenance Capex Required
Current Portfolio Maintenance Capex
Lifecyle expansion
Third-Party Owned
~100k No Capex Associated with Use of equipment over Active machine relocation
Customer-owned machines three cycles thanks to
~22% refurbishment programme
~€4m used
machines
disposal
Gross Capex
~€20m funded
through
Net Capex finance leases
New Machines
Selecta Owned
Cash
€76m Capex c.€11m reduction in capex requirement
~360k
~78%
Refurbish
€24m
Free cash flow Depreciation
+ €10m p.a. - €1.6 million p.a.
Total
~460k €100m €96m €76m
(Illustrative for 460k portfolio and €1.5bn revenue level)
c.€100m Maintenance Capex vis-a-vis Maintenance Depreciation of €108m
(including an Economic Life Adjustment of €15m)
21Q3 F Y1 9 NOTEHOLD E R PRESE NTAT IO N
03 Selecta is a Natural Consolidator in an Extremely Fragmented Environment M&A
Strict M&A Criteria & Sizeable Target Pipeline
Fragmented Market Offers Opportunities Natural Consolidator With Proven Track Record
Market share1,2 (%)
• Selecta well positioned as major consolidator in a highly
18 82 1st fragmented market
• We estimate there are over 10,000 companies across Europe
which offer attractive synergies
24 76 1st
• Route-based model similar to leading European and North
American businesses
11 89 1st • Leading scale positions us as “an acquiror of choice” with
significant potential for synergies
3
10 90 • Clear acquisition strategy to add 3-5% of sales per annum
1st
through acquisitions through well defined target types:
• Bolt-on acquisitions with overlapping operations
delivering immediate cost synergies
9 91 2nd
• Bolt-on acquisitions with some overlapping operations
synergies primarily in purchasing and some back office
12 88 2nd • Bolt-on acquisition with no or limited overlap,
geographical expansion within existing countries
• Strong execution capabilities with proven track record of
7 93 1st integrating bolt-on acquisition to enhance market position
2 98 4th
Selecta Competition On track to achieve M&A growth targets
# denotes market share
Source: OC&C analysis
1 Market share in 2017A including capsules. Where 2017 figures are not available, individual revenues are assumed to have grown at market rate.
2 Selecta market share includes Pelican Rouge.
3 UK market share includes Express Vending and excludes HoReCa 22Q3 F Y1 9 NOTEHOLD E R PRESE NTAT IO N
03 Investment case
The Opportunity
01 Selecta business proposition offering unmatched convenience to B2B customers and B2C consumers
02 Well positioned to take advantage of premium coffee and out-of-home consumption growth
03 #1 in European unattended self service retail with strong market position
04 Leading the innovation and technological development in our digital industry
05 Unique route-based business model with high density on the last mile
06
06 Scale driven
Scale driven business
business model
model creating
creating attractive
attractive economics
economics with
with genuine
genuine barriers
barriers to
to entry
entry
07 Attractive financial profile with good organic growth, profitability and cash conversion momentum
08 Natural consolidator in highly fragmented market
09 Experiencedexecutive
Experienced executivemanagement
management team
team with
with strong
strong local
local and
and international
international expertise
expertise
2304 Q3 Financials
Q3 F Y1 9 NOTEHOLD E R PRESE NTAT IO N

03     Key Financials – A Strong Basis for Future Growth

        Revenue Growth (€m)1                                                                            Adjusted EBITDA (€m)1
                + 6.3%                                                                                      + 15.3%                    68.1
                                         405.3

                                                                                                                                                                                                        Strong Revenue Growth
          381.2

                                                                                                          59.1

                                                                                                                                                                                                       Attractive and Improving
         Q3   FY183                    Q3 FY19                                                          Q3 FY18                       Q3 FY19                                                          Adjusted EBITDA Margins
                                                                              % Margin                   15.5%                        16.8%

                 + 6.1%                                                                                      + 14.9%
                                                                                                                                    270.2

                                        1,593.2                                                                                                                                                                Strong Cash Flow
         1,508.7
                                                                                                                                                                                                                  Conversion
                                                                                                        235.2

                                                                                                                                                                                                         Momentum in Business
     LTM June   FY182             LTM June       FY192                                           LTM June FY18                 LTM June FY19                                                                Acceleration
                                                                              % Margin                 15.6%                        17.0%

                1   At constant foreign currency rates. Constant foreign currency rates applied: CHF/EUR 1.15; SEK/EUR 9.65; GBP/EUR 0.88
                2   2017 & 2018 are proforma amalgamation of Selecta, Pelican Rouge, Italy Argenta and exclude disposed subsidiaries (Custompack).
                3   Q4 2017 and Q4 2018 for comparability are based on gross revenue reported before harmonisation of vending fees presentation; from 2018 revenue includes the effect of vending fees harmonisation.
                                                                                                                                                                                                                                                   25
Q3 F Y1 9 NOTEHOLD E R PRESE NTAT IO N
04 P&L Summary
Q3 FY19
Revenue
• +6.7% reported, +6.3% to €405.3m at constant currency1 (CC) At Actual Rates At constant currency1
• Revenue growth driven by Trade business and portfolio expansion, €m
Q3 Q3 Variance Q3 Q3 Variance
alongside €15.5m contribution from acquisitions FY19 FY182 % FY19 FY182 %
• Performance partially offset by ongoing turnaround in France Revenue 403.6 378.1 6.7% 405.3 381.1 6.3%
Net sales
Vending fees (45.8) (40.4) 13.5% (45.7) (40.5) 13.0%
• +5.9% reported, +5.5% to €359.5m at CC
Adjusted EBITDA Net sales 357.8 337.7 5.9% 359.5 340.7 5.5%
• +15.8% reported, +15.3% to €68.1m (CC) reflecting good progress
allowing investment in growth. This was driven by: Materials and
(128.2) (127.1) 1.7% (129.0) (127.7) (1.5%)
consumables used
• €6.1m synergy savings delivered in the quarter
• €3.1m contribution from acquisitions Gross Profit 229.6 211.7 8.5% 230.6 213.6 8.0%
• €2.4m from growth in Trade and portfolio expansion
One-off adjustments % margin on net sales 64.2% 62.7% 64.1% 62.7%
• €(21.0)m (CC) primarily due to: Adjusted employee
(109.8) (105.0) 4.6% (110.2) (105.9) 4.0%
costs
• Ongoing integration in France
• M&A and corporate activities Other operating
(52.1) (48.2) (8.1)% (52.2) (48.6) (7.6)%
expenses
• Continued harmonisation of technology (telemetry and
cashless installations) across existing machine park as part of
Adjusted EBITDA 67.7 58.5 15.8% 68.1 59.1 15.3%
integration programme
• Phasing out of one-off adjustments as integration and
corporate activities come to an end, expected to decrease % margin on net sales 18.9% 17.3% 18.9% 17.3%
from FY20
One-offs adjustments (21.1) (12.7) 66.0% (21.0) (12.6) 66.2%
Reported EBITDA 46.6 45.8 1.9% 47.1 46.4 1.4%
% margin on net sales 13.0% 13.5% 13.1% 13.6%
1 Constant foreign currency rates applied: CHF/EUR 1.15; SEK/EUR 9.65; GBP/EUR 0.88
2 2018 figures are pro forma
26Q3 F Y1 9 NOTEHOLD E R PRESE NTAT IO N
04 Revenue & EBITDA - Year on Year Strong Momentum
Q3 FY19 & Q3 FY18
+ 6.7%
Revenue1
(€ in millions)
15.5 405.3
9.6
381.2 -1.4 0.4
379.7
Q3 FY18 Reported Working Days Q3 FY19 Baseline SMD Trade / M&A Q3 FY19
Portfolio Growth
+ 15.8%
Adjusted EBITDA1
(€ in millions) 6.1 -2.0
68.1
3.1
2.4
59.1 -0.9 0.3
58.2
Q3 FY18 Reported Working Days Q3 FY19 Baseline SMD Trade / M&A Synergies Investment in Growth Q3 FY19
•
Portfolio Growth
1 At constant foreign currency rates. Constant foreign currency rates applied: CHF/EUR 1.15; SEK/EUR 9.65; GBP/EUR 0.88
1 At constant foreign currency rates. Constant foreign currency rates applied: CHF/EUR 1.15; SEK/EUR 9.65; GBP/EUR 0.88
27Q3 F Y1 9 NOTEHOLD E R PRESE NTAT IO N
04 Results by Region at Constant Rates1
Q3 FY19
South, UK and Ireland
Revenue by segment1,2 (€m)
• Approx. 38% of total revenue
• Revenue up 12.7% vs prior year, as UK has returned to growth following
Coca Cola contract win
-0.9
• Continued dynamic activity in Spain, with further portfolio growth coming
from Madrid Airport installation
• Adjusted EBITDA increased by 20.4%, driven by new network operating
agreement in the UK
Central
• Approx. 35% of total revenue
• Revenue fell 0.6% vs prior year and adjusted EBITDA fell by 15.7% due to
ongoing turnaround in France. Excluding France, revenue grew by 3.2% and
EBITDA by 1.5%
• Consistent good growth delivered in Germany and Switzerland
Adjusted EBITDA by segment1 (€m)
• Austria, the only fully telemetry-enabled country, continued to grow
strongly
North
-3.2
• Approx. 27% of total revenue
• Revenue up 7.8% vs prior year, with exceptional performance achieved in
Norway and very strong results in Belgium
• Adjusted EBITDA increased by 30.5% reflecting particularly strong
performances in Nordics and Belgium
Corporate
• Lean corporate structure supports period on period cost efficiencies
1 Constant foreign currency rates applied: CHF/EUR 1.15; SEK/EUR 9.65; GBP/EUR 0.88
2 Revenue is before payment of vending fees
28Q3 F Y1 9 NOTEHOLD E R PRESE NTAT IO N
04 Liquidity at 30 June 2019
Q3 FY19
Liquidity summary At actual rates (unless otherwise stated)
• Cash & cash equivalents of €77.8m at 30 June 2019 €m June 2019
• Liquidity summary
Cash & cash equivalents 77.8
• Senior secure notes of €1,315.1m
• €765m senior secured 5.875% Factoring facilities 1.1
• €325m senior secured floating rate notes 5.375% Reverse factoring facilities 8.9
• CHF250m senior secured 5.875% Revolving credit facility 106.9
Senior notes 1,315.1
• Revolving credit facility: €106.9m drawn at 30 June 2019 to Accrued interest 18.9
finance acquisitions
Finance leases 40.6
• Group available liquidity1 €120.9m
Other finance debt 14.4
Total senior debt 1,506.0
Net senior debt 1,428.2
Adjusted EBITDA last 12 months2 270.2
Leverage ratio
Leverage ratio excluding exit run rate synergies 5.3x
Available liquidity1 120.9
• Pro-forma leverage ratio of 4.9x based on €75m synergy
programme
€m June 2019
Adjusted EBITDA last 12 months2 270.2
Pro-forma leverage ratio based on €75m synergy programme (including
4.9x
full synergy programme)
1 Includes cash & cash equivalents and unused revolving credit facility
2 LTM adjusted EBITDA at constant currency, on the proforma scope
29Q3 F Y1 9 NOTEHOLD E R PRESE NTAT IO N
04 Cash Flow Statement at Actual Rates
Year to June 2019
Cash generation highlights Cash flow statement at actual rates
• YoY improvement of free cash flow (FCF), from €(40.1)m in June YTD LTM YTD
2018 to €(23.5)m in June 2019, driven by strong EBITDA delivery €m
FY19 FY19 FY18
• Sharp improvement of FCF on a LTM basis: EBITDA 145.7 195.2 129.1
• €65.7m LTM June 2019 vs €7.3m LTM June 2018 (Profit) / loss on disposals (11.0) (15.5) (6.0)
• Underpinned by a €49.3m YoY improvement in working
Cash changes from other operating activities (3.2) (6.4) (2.5)
capital performance - €10.2 LTM June 2019 vs €(39.1)m LTM
June 2018 Change in working capital and provisions (59.8) 10.2 (89.4)
Net cash from operating activities 71.7 183.5 31.3
Cash capex net of proceeds (112.8) (144.6) (77.6)
EBTIDA less net capex (constant rates)1
Finance lease payments (9.2) (15.4) (14.0)
€m Q3 FY19 Q3 FY18 Variance %
Other investing movements 0.1 0.5 0.8
Adjusted EBTIDA 68.1 59.1 15.3 Proceeds from sale of subsidiaries and other proceeds 26.7 41.8 19.4
Net Capex2 38.7 33.2 16.7
Net cash used in investing activities excluding M&A (95.2) (117.8) (71.4)
EBITDA less Net Capex 29.4 25.9 13.3 Free cash flow (23.5) 65.7 (40.1)
Acquisition of subsidiary net of cash acquired (20.7) (82.5) (30.5)
• Significant improvement in structural cash generation Free cash flow including acquisition (44.2) (16.8) (70.6)
Proceeds/ repayment of loans and borrowings 47.3 92.6 141.9
• Q3 Adjusted EBITDA less net capex improved by 13.3% vs the prior
year despite consistent investment in future growth (talent Proceeds (repayment) from factoring (1.7) (8.0) (5.9)
capability, machine portfolio, technology)
Interest paid and other financing costs (90.2) (100.7) (37.5)
• Despite stronger growth than last year, the Group is still delivering
positive growth in EBITDA less net capex Financing related financing costs paid (2.0) (6.0) (51.6)
Other (0.4) (2.8) 6.8
Net cash used in financing activities (47.0) (25.0) 53.6
Total net cash flow (91.3) (41.8) (16.9)
1 Constant foreign currency rates applied: CHF/EUR 1.15; SEK/EUR 9.65; GBP/EUR 0.88
2 Net capital expenditures is defined as capital expenditures less net book value of disposal of vending equipment
30Q3 F Y1 9 NOTEHOLD E R PRESE NTAT IO N
05 Outlook for FY 2019
Guidance
FY191 guidance updated
Revenue growth €1,615 – €1,635m +5.8% - 7.1%
Adjusted EBITDA €270m - €275m +9.4% - 11.5%
Free Cash Flow €70m – €80m +26.7% - 44.8%
1 Constant foreign currency rates applied: CHF/EUR 1.15; SEK/EUR 9.65; GBP/EUR 0.88
31You can also read