Executing Strategy to Drive Significant Shareholder Value - March 2021

Page created by Alberto Townsend
 
CONTINUE READING
Executing Strategy to Drive Significant Shareholder Value - March 2021
Executing Strategy to Drive
Significant Shareholder Value
March 2021
Executing Strategy to Drive Significant Shareholder Value - March 2021
Cautionary Statement Regarding Forward-Looking Information

This presentation contains "forward-looking statements" within the meaning of the Private Securities Litigation Reform Act of 1995. Words such as "believes,"
"anticipates," "plans," "may," "intends," "will," "should," "expects," and similar expressions are intended to identify forward-looking statements. Forward-looking
statements include, but are not limited to, comments about Kohl's future financial plans, capital generation, management and deployment strategies, adequacy
of capital resources and the competitive environment. Such statements are subject to certain risks and uncertainties, which could cause Kohl's actual results to
differ materially from those anticipated by the forward looking statements. These risks and uncertainties include, but are not limited to, those described in Item
1A in Kohl's Annual Report on Form 10-K, and in Item 1A of Part II in the Company's Quarterly Report on Form 10-Q for the quarter ended May 2, 2020, which are
expressly incorporated herein by reference, and other factors as may periodically be described in Kohl's filings with the SEC. Any number of risks and
uncertainties could cause actual results to differ materially from those Kohl’s expresses in its forward-looking statements, including the short and long-term
impact of COVID-19 on the economy and the pace of recovery thereafter. Forward-looking statements speak as of the date they are made, and Kohl’s
undertakes no obligation to update them.

Non-GAAP Financial Measures

In addition, this presentation contains non-GAAP financial measures, including adjusted operating income, free cash flow, adjusted ROI, and leverage ratio.
Reconciliations of all non-GAAP measures to the most directly comparable GAAP measures are included in the Appendix of this presentation.

                                                                                                                                                                      2
Executing Strategy to Drive Significant Shareholder Value - March 2021
Important Shareholder Information and Where You Can Find It

Kohl’s has filed a preliminary proxy statement and form of BLUE proxy card with the SEC in connection with the solicitation of proxies for Kohl’s 2021 Annual
Meeting of shareholders (the “Preliminary Proxy Statement” and such meeting the “2021 Annual Meeting”). Kohl’s, its directors and certain of its executive
officers will be participants in the solicitation of proxies from shareholders in respect of the 2021 Annual Meeting. Information regarding the names of Kohl’s
directors and executive officers and their respective interests in Kohl’s by security holdings or otherwise is set forth in the Preliminary Proxy Statement. To the
extent holdings of such participants in Kohl’s securities have changed since the amounts described in the Preliminary Proxy Statement, such changes have
been reflected on Initial Statements of Beneficial Ownership on Form 3 or Statements of Change in Ownership on Form 4 filed with the SEC or will be filed
within the time period specified by Section 16 of the Securities Exchange Act of 1934, as amended, and the regulations thereunder. Details concerning the
nominees of Kohl’s Board of Directors for election at the 2021 Annual Meeting are included in the Preliminary Proxy Statement. BEFORE MAKING ANY VOTING
DECISION, INVESTORS AND SHAREHOLDERS OF KOHL’S ARE URGED TO READ ALL RELEVANT DOCUMENTS FILED WITH OR FURNISHED TO THE SEC,
INCLUDING KOHL’S DEFINITIVE PROXY STATEMENT TO BE FILED IN CONNECTION WITH THE 2021 ANNUAL MEETING, ANY SUPPLEMENTS THERETO
AND THE ACCOMPANYING BLUE PROXY CARD BECAUSE THEY WILL CONTAIN IMPORTANT INFORMATION. Investors and shareholders will be able to
obtain a copy of the Preliminary Proxy Statement and other documents filed by Kohl’s free of charge from the SEC’s website, www.sec.gov. Copies will also be
available at no charge on the Kohl’s website at investors.kohls.com.

                                                                                                                                                                      3
Executing Strategy to Drive Significant Shareholder Value - March 2021
Executive Summary
Well Positioned        • Kohl’s has strengthened its financial and competitive position during period of profound change in the retail industry
in Retail Industry     • Broader retail industry facing margin pressures from increased digital penetration and cost inflation
That Is Undergoing
Profound Change        • Kohl’s continues to actively and thoughtfully invest in strengthening its foundation to differentiate itself and support future growth

                       • Kohl’s introduced a strategic framework in October 2020 that is focused on creating long-term shareholder value
Compelling
Strategy               • Strategy is focused on driving top line growth and expanding operating margin to 7% to 8%
to Drive Significant
and Sustainable        • Already making significant progress with recent results exceeding expectations and announcement of key strategic partnerships
Shareholder Value      • Kohl’s game-changing partnership with Sephora will drive significant beauty sales and new customer acquisition beginning in 2021

                       • Kohl’s Board has and will continue to serve as agents of change, focused on ensuring improved performance and creating
                         shareholder value
Strong, Diverse        • Kohl’s Board formulated an orderly succession for a new CEO with extensive industry expertise in 2018 and provided oversight for
Board with the           the development of the Company’s new strategic plan as well as targeted investment in the Company’s omnichannel and digital
Right Skills             capabilities
and Experience         • Kohl’s Board has extensive retail and digital leadership experience

                       • Six new directors have been added since 2016

                                                                                                                                                                  4
Executing Strategy to Drive Significant Shareholder Value - March 2021
Retail apparel industry has been
undergoing profound change
 Industry Evolution and                                      Significant Industry Sales                                                                  Store Closures and Bankruptcies
 Consumer-Driven Trends                                      Shift to Digital 1
                                                                                                              2.5x+
                                                                                                                                                         • 67,750 retail store closings since 2010 2
                                                                                                      ease d
                                                                                                  incr
                                                                                            ation
                                                                                                                                                 26.3%
                                                                                        netr                                                             • Another 100,000 expected by 2025 2
 • Shift to Digital Shopping: Significant industry                             igital pe                         21.9%
                                                                                                                                         23.3%
                                                                              D                          19.9%

   disruption with customers’ rapid adoption of                                                   16.1%
                                                                                                          17.8%                                          • Growing list of retail bankruptcies
                                                                                         14.3%
                                                                                12.5%
   digital shopping                                          9.8%
                                                                      11%

 • Investments in Omnichannel: To support new                2010A    2011A     2012A    2013A    2014A   2015A   2016A         2017A    2018A   2019A

   shopping preferences, retailers invested                  Digital Apparel Sales as a % of Total Apparel Sales in U.S.
   heavily to build new capabilities (e.g. digital,
   mobile, store fulfillment)

                                                             Broad retail industry
 • Cost Headwinds: Wage inflation and higher                 EBIT Margin contraction 2
   costs to fulfill digitally placed orders
                                                                         -4
                                                                           30                     2010                2019
                                                                                bp                                                         -100
                                                                                  s                                                             bps

 • Heightened Focus on Value: Consumers are                     14.4%                                              -4
                                                                                                                     10
                                                                                                                          bp
   placing increased importance on value                                                                                    s           12.2%11.2%
                                                                            10.1%       10.2% 11.1%            9.6%
                                                                                                                      5.5%
 • Trend Towards Casualization: Consumers
   adopting more active and casual lifestyles                        Specialty          Off-Price Retail        Dept. Stores               Branded
                                                                                        (Relatively isolated
                                                                                      from eCommerce risk)

                                                                         Average EBIT Margin (Sales-Weighted)

           Source: 1.) eMarketer, 2.) Wall Street research                                                                                                                                             5
Executing Strategy to Drive Significant Shareholder Value - March 2021
Kohl’s leadership actively responded to industry
challenges by investing for future success

 Shift to Digital                   Investments in                                                       Heightened                         Trend towards
 Shopping                           Omnichannel                        Cost Headwinds                    Focus on Value                     Casualization
• Invested in building digital,    • Kohl’s invested in technology    • To help offset cost             • Kohl’s has built an industry     • Kohl’s pivoted strategy to
  mobile, and personalization        and omnichannel capabilities       headwinds, focused on             leading loyalty program that       expand Active business in
  capabilities to support shift      to support digital growth          operational excellence to         is a key value differentiator      2013 and nearly doubled
  in consumer preferences                                               reduce costs by more than                                            sales to 20% of business by
                                   • Investment in fulfillment          $250 million during 2017        • Leaned into Kohl’s Cash and        2019
• Supported more than 500%           network to support digital         to 2019                           growing its iconic status with
  growth in digital sales since      demand, including building                                           customers                        • Introduced Under Armour in
  2010, as penetration               four new fulfillment centers     • Corporate restructuring         • Grew loyalty program to            2017 and expanded
  increased from 4% in 2010 to                                          actions in 2020 reduced           30M members (who spend             assortment of Nike and
  40% in 2020                      • Transformed stores as a            annualized costs by more          2x more than non-loyalty           Adidas, as well as increased
                                     omnichannel hub to fulfill         than $100 million                 customers) following 2014          space in stores given its high
• Enhanced mobile capabilities       more than 40% of digital                                             launch and enhanced Kohl’s         productivity
  support 75% of digital traffic     sales (e.g. ship from store,     • Upfront investments taken to      Rewards in 2020
  and more than 50% of digital       BOPUS, BOSS, Store Drive           build capabilities to improve                                      • New strategy further pivots
  sales                              Up)                                long-term efficiency and to     • Kohl’s Card, our private label     toward active and casual
                                                                        strengthen foundation (e.g.       credit card has highest sales      lifestyle with goal of Active
• Developed world-class            • Elevate the store                  technology, store                 penetration in retail sector       growing to 30% of sales
  shopping App that has 16           experience: ease, shopability,     productivity)                     and provides more
  million users                      brand portfolio and                                                  opportunities for customers
                                     innovative services (e.g.                                            to save (highest tier Kohl’s
                                     Amazon Returns)                                                      Card customers spend 10x
                                                                                                          more than non-loyalty
                                                                                                          customers)

                                                                                                                                                                              6
Executing Strategy to Drive Significant Shareholder Value - March 2021
Kohl’s has built a powerful foundation
                                             Customers                                                                      Digital

                                                                                                                             40%                   Digital sales
                                                                                                                                                   penetration in 2020
                                              65M        Active Customers

                                                                                                                              1.6B                 Website visits
                                                                                                                                                   in 2020

                                              30M        Loyalty Members
                                                                                                                               18%                 Kohl’s App user
                                                                                                                                                   growth in Q4 2020

                                              29M        Kohl’s Charge
                                                         Card holders
                                                                            Stores
                                                                                                                                                 GR                  $5.9B
                                                                               90%                          95%                            17%
                                                                                                                                               CA
                                                                                                                                                     $4B
                                                                                                                                                             $4.5B
                                                                                 of stores             of Kohl’s stores                    $3.6B
                                                                             generated $1M+ in           are off-mall               $3B
                                                                              4-wall cash flow                              $2.7B

                                             Accessible and
                                             Aspirational Brand
                                             Portfolio
                                                                               1,162                        80%              2015   2016    2017      2018    2019    2020

                                                                                 stores in           of Americans live               Digital Sales Growth
                                                                               49 states at          within 15 miles of a
                                                                              year end 2020             Kohl’s store

                                                                               43%                          10%
                                                                              of digital sales       higher digital sales
                                                                             fulfilled by stores         in markets
                                                                                    In 2020              with stores

                                                                                         600M
                                                                                             store visits

    * All figures are 2019 except as noted                                                                                                                                   7
Executing Strategy to Drive Significant Shareholder Value - March 2021
Agile, accountable & inclusive culture
 We are evolving how we work                                                                     Kohl’s is committed to
 to accelerate our path forward                                                                  ESG Leadership

                                                                                                                             Excellence Award
                                                                                                                                 Recipient
                                                                                                                                   2020

 • Kohl’s management, led by CEO Michelle Gass, is committed to fostering a diverse,             • Kohl’s ESG journey began more than a
   equitable, and inclusive environment for the Company’s associates, customers and                decade ago
   suppliers.
                                                                                                 • Kohl’s is committed to the environment and has
 • A diversity and inclusion framework was established in 2020, which includes a number of         established 2025 goals related to climate
   key initiatives across three pillars: Our People, Our Customers, and Our Communities.           change, waste and recycling, and sustainable
                                                                                                   sourcing.
 • Committed to strong culture (ethics, governance, talent acquisition and associate
   development, Business Resource Groups)                                                        • The Company’s ESG efforts have earned
                                                                                                   frequent recognition
 • Kohl’s and Kohl’s Cares have donated nearly $785 million since program inception benefiting
   various national and hometown organizations

                                                                                                                                                    8
Executing Strategy to Drive Significant Shareholder Value - March 2021
Our Strategy

The most trusted retailer of choice
for the active and casual lifestyle
                                                                                               Expand                    Disciplined                  Strong
                                                                                              Operating                    Capital                 Organizational
                               Drive Top Line Growth                                           Margin                   Management                     Core

Destination for                                            Differentiated                                                                        Agile,
Active & Casual                  Leading with              Omni-channel                 Operating Margin            Maintain Strong              Accountable &
Lifestyle                        Loyalty & Value           Experience                   Goal of 7% to 8%            Balance Sheet                Inclusive Culture
• Expand Active and Outdoor      • Best-in-class loyalty   • Healthy store base in      • End-to-end supply chain   • Sustain Investment Grade   • Innovative and adaptive
                                                             evolving landscape           transformation              rating                       learning approach
• Reignite growth in Women’s     • Drive productivity
                                   through deeper          • Modernize the store        • SG&A efficiency through   • Solid cash flow            • Focused on diversity
• Build a sizable Beauty           engagement                experience                   store labor, marketing,     generation                   and inclusion
  business                                                                                and technology
                                 • Deliver personalized    • Continue digital growth                                • Committed to returning     • ESG stewardship
• Drive category productivity      experiences                                          • Operational excellence      capital to shareholders
  and inventory turn                                       • Further enhance omni-
                                                             channel capabilities
• Capture market share from
  retail industry disruption

                                                  Creating Long-term Shareholder Value
                                                     Return to growth                            Expand operating margin

                      Solid cash flow generation                          Maintain strong balance sheet                 Return capital to shareholders
                                                                                                                                                                             9
Executing Strategy to Drive Significant Shareholder Value - March 2021
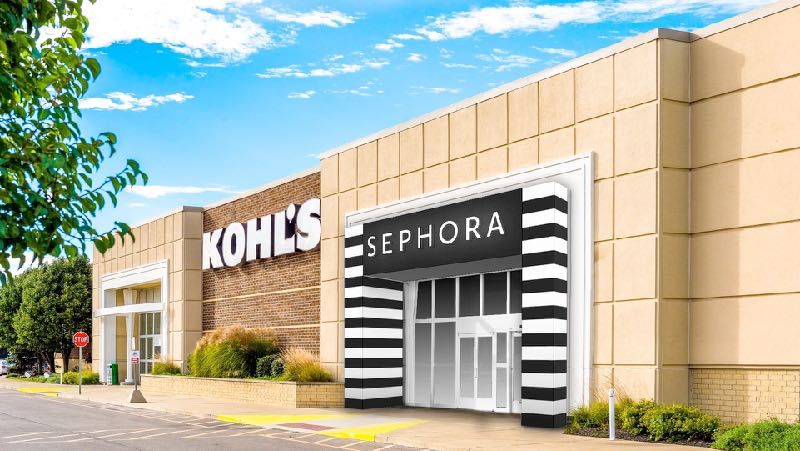
Our strategy is producing results
 Q3 2020 and Q4 2020 Earnings
 Results Exceeded Expectations                                                                                     We believe the rollout of Sephora shop-in-shops and new brands
                                                                                                                  (incl Calvin Klein) are big wins that can drive top-line performance
 • Sales showed continued sequential improvement during                                                                  (and help attract new brands, creating a virtuous circle).
   pandemic                                                                                                                                     - Citi, March 2, 2021

 • Gross Margin trend has improved in Q3 2020 and Q4
   2020, benefiting from disciplined inventory management                                                           With additional details provided on the path to 7.0%-8.0% EBIT
   and optimizing pricing and promotional strategies;                                                                 margins by 2023 and numerous top-line initiatives underway
   inventory turnover was a 5 year high in Q3 2020 and 10                                                           including the women’s apparel revamp, expansion of active and
   year high in Q4 2020                                                                                             outdoor, as well as the August 1st launch of Sephora, we remain
                                                                                                                   constructive on shares and credit management for improving the
 • Expenses: Q3 2020 and Q4 2020 SG&A expenses declined                                                              company's cost structure, pricing optimization strategy, and
   8% including and 10% excluding COVID-19 expenses                                                                               approach to customer engagement.

 • Strong cash flow of $1.3 billion and free cash flow of $908                                                               - Deutsche Bank, March 2, 2021
   million for full year 2020

 • Further solidified financial position ending the year with                                                       We came away from KSS's 4Q EPS call with a greater level of
   $2.3 billion of cash                                                                                          confidence in management's medium-term outlook. Recall, Cowen's
                                                                                                                  upgrade thesis is predicated on increasing relevance with younger
 • Resuming capital allocation strategy in 2021: reinstating                                                       shoppers through active, beauty, and women's reset, leveraging
   dividend, planning share repurchases, and employing                                                                stores as hubs, and upside to Street's conservative outlook.
   liability management strategies, including debt repurchases                                                                              - Cowen, March 3, 2021

         * Free Cash Flow is a non-GAAP financial measure. For reference, the reconciliation can be found in the appendix.                                                               10
Driving top line growth

 Grow Active to                         Beauty Growth                             Reignite                                Extend Casual
 30% of Sales                           with Sephora                              Women’s Growth                          Lifestyle to Home
 • Fuel growth with key national        • Highly complementary strategic          • New organization structure and        • Expand soft home category
   brands, Nike, Under Armour and         partnership to establish Kohl’s as        leadership to drive improved            (e.g. Koolaburra by Ugg, Sonoma)
   Adidas                                 a leading beauty destination              performance
                                                                                                                          • Expand underdeveloped
 • Expand Active space by at least      • Comprehensive digital launch            • Significant portfolio reinvention       categories (e.g. decor, kid’s
   20% in 2021                            August 2021                               with exit of 10 downtrending brands     bedroom, storage)

 • Drive athleisure through launch of   • Launch in 200 stores Fall 2021          • Refresh and differentiate a more      • Lean into healthy home
   FLX, our new private brand, Calvin     and expand to at least 850 stores         focused portfolio of private brands     (e.g. sleep and cookware)
   Klein basics and loungewear, and       by 2023                                   (e.g. Sonoma, So, LC Lauren
   expand assortment of Champion                                                    Conrad)
                                        • Assortment will include 100+
 • Grow outdoor through expansion of      emerging and established brands         • Distort denim opportunity
   Lands’ End and launch of Eddie         emulating freestanding Sephora            (e.g. Levi’s, key private brands)
   Bauer                                  store
                                                                                  • Improving merchandising and
                                        • Expected to drive significant traffic     clarity through significant choice
                                          and acquisition of new younger            count reduction and building depth
                                          customer

                                                                                                                                                               11
Driving top line growth
                                                                                    Investing in Omni-channel

  Loyalty Members are                               Transforming the Role                                      Enhance Digital Capabilities
  More Productive                                   of the Store                                               to Drive Growth
 • Recently launched Kohl’s Rewards loyalty         • Modernizing the store experience through refresh        • Continue to invest in the evolution of the digital
   program, adding new features, enhancing            program and category reflow to highlight outsized         experience (e.g. Kohls.com, App)
   personalization and simplifying rewards in         growth businesses
   Kohl’s Cash                                                                                                • Expanding digital brand portfolio (e.g. Fanatics,
                                                    • Simplified and edited shopping experience through         Sephora, Lands’ End, Eddie Bauer)
 • Kohl’s Cash: Iconic and differentiated loyalty     fixture de-densification (standard to small strategy)
   device that provides a fly-wheel effect on       • Inspired solutions and product storytelling through     • New e-commerce fulfillment center opening in 2021
   customer return visits                             continued investments in merchandising (e.g.              will be significantly more productive
 • Kohl’s Card: Provides more opportunities for       expanding the learnings from the Outfit Bar concept)
   customers to save                                • Evolve existing omni experiences: BOPUS/BOSS,
                                                      Store Drive Up, Amazon Returns
                                                    • Continue to pursue innovation and discovery
30 million loyalty members spend 2x                   (e.g. Curated by Kohl’s, emerging brands)
more than non-loyalty members and
  highest tier Kohl’s Card members                                          Omni-customer is 4x more productive than
 (“Most Valuable Customer”) spend                                           store-only shopper and 6x more productive
10x more than non-loyalty members                                                   than digital-only customer

                                                                                                                                                                     12
We are confident in our ability to expand
operating margin to 7% to 8% by 2023
                                                                Gross Margin                                                SG&A
                                                                     ~36% Goal                                           Expense Rate
                                                                                                                        ~27% to ~28% Goal
                                                           +20 to +40 basis points
                                                                  increase                                            +70 to +150 basis points
                                                                                                                           improvement           7.0% to 8.0%

              6.1%
                                               Inventory                              Digital                                 Stores
                                               management                             penetration /
                                                                                      cost of shipping                        Marketing
                                               Sourcing
                                                                                                                              Technology
                                               Pricing / Promo
                                               optimization                                                                   Corporate

                                               Supply chain                                                                   Wage inflation
                                               transformation

          FY 2019                                                  Gross Margin                                                    SG&A             FY 2023
       Adj. Operating
          Margin *

    * Adjusted Operating Margin is a non-GAAP financial measure. For reference, the reconciliation can be found in the Appendix.                                13
Focused on expanding gross margin
through four key initiatives
• Targeting 20 basis points to 40 basis points improvement in gross margin to ~36.0% as compared to 35.7% in 2019
• Merchandise margin improvement will more than offset cost of shipping headwind at digital sales penetration of 40% of sales

 Inventory                                                                         Optimizing Price /                       Supply Chain
 Management                               Sourcing                                 Promotion Strategies                     Transformation

 • Increase inventory turnover: Goal of   • Reduce product costs: Goal of          • Simplifying pricing: Reducing          • Optimal inventory deployment:
   at least 4.0x                            lowering costs of proprietary brands     number of general promotional            Leveraging real-time demand insight
                                            by $125M to $175M by 2022                offers and stackable offers, while       and improving supply chain visibility to
 • De-densification strategy: Executing                                              increasing usage of price-led events     allocate goods closer to demand,
   standard to small initiative across    • Enable centralized sourcing              to offer more value everyday             resulting in increased sell-through and
   balance of chain in 2021 to improve                                                                                        inventory turn
   customer experience as we lean into    • Insource direct factory negotiations   • Optimizing promotions: Increasing
   more productive categories. Key                                                   deployment of targeted and             • Minimize fulfillment costs: Manage
   driver of improved gross margin and    • Reduce reliance on 3rd part agents       personalized offers (e.g. > 50%) and     fulfillment costs lower (e.g. new EFC 6)
   inventory turn in 2017-2018 (500                                                  introduction of real-time offers to      and further leverage stores to drive
   stores).                                                                          drive customer behavior                  customer pickup and get closer to the
                                                                                                                              customer
 • Improving clarity: Reducing choice                                              • Better insight: Continued investment
                                                                                                                            • Enhancing sourcing engine: Optimize
   count through brand portfolio                                                     in consumer data and analytics to
                                                                                                                              units per carton, proximity to
   transformation and building depth                                                 drive offer efficiency
                                                                                                                              customer, and markdown and stock
                                                                                                                              out avoidance
 • Better inventory allocation:
   Leveraging technology to drive                                                                                           • Demand shaping: Creating better
   dynamic inventory allocation leading                                                                                       connections between digital customer
   to higher regular sell through and                                                                                         demand and local/regional supply, to
   reduced clearance levels                                                                                                   fulfill orders more profitably

                                                                                                                                                                         14
Focused on lowering our SG&A
expense rate through four key areas
• Targeting 70 basis points to 150 basis points improvement in SG&A expense rate to ~27% to ~28% from 28.6% in 2019
• SG&A expense initiatives to more than offset ongoing wage inflation assumed at rate experienced in recent years

 Transform                                 Lower Marketing
 Store Labor                               Expense Rate                             Technology Efficiency                    Corporate Cost Actions

 • Increase self service: Goal to grow     • Reduce spend rate: Goal of             • More efficient future: Leveraging      • 2020 organizational restructuring
   self service (e.g. checkout, returns,     marketing to sales rate of 4.0%          tech investments made in recent          actions: Annualized expense savings
   and order pickup) to more than 25%        or below                                 years to support future growth and       of more than $100 million
   of total in-store transactions                                                     drive improved profitability
                                           • Increase marketing ROI: Shifting                                                • Ongoing focus on efficiency: Will
 • Localized operating hours:                more of spend towards digital and      • Rebalancing technology staffing:         continue to leverage operational
   Improving cost efficiency by              improving response from existing         Shifted to a more balanced internal      excellence discipline to seek cost
   operating with localized hours            channels like direct mail (e.g.          versus external model                    efficiencies across the business
                                             targeting, personalization)
 • Improve store fulfillment efficiency:                                            • Evolving technology vision:            • Reduced management layers and
   Leveraging technology to improve        • In-house capabilities: Driving           Increased discipline around              streamlined processes to more fully
   associate productivity (e.g. finding      significant efficiency with in-house     investments and greater agility will     empower our teams
   and picking orders)                       digital marketing capabilities           be key contributors to improved
                                                                                      ROIC
                                           • Leveraging technology: Accelerating
                                             use of machine learning algorithms
                                             to drive customer productivity
                                             through behavior and product
                                             preferences insight

                                                                                                                                                                     15
We have a history of investing in our business
and generating strong free cash flow
 Capex ($ in millions)                                                     Solid Free Cash Flow ($ in millions)                                    Adjusted ROI

     Base Capital
     Omnichannel                                                                            $1,403
     Store Strategies
     Technology                  $855
                                                                                                                                                    14.0%         14.0%         13.4%
    $672                                                                    $881                                               $908
                  $578
                                                                                                              $700

                                                 $334                                                                                                                                         4.9%

     2017          2018            2019           2020                       2017              2018             2019             2020                 2017         2018          2019         2020

• Remain committed to investing in the business                          • Focused on driving free cash flow                                      • Investments have been focused on driving
• More than $2.0 billion cumulative Capex during                                                                                                    technology and omni-channel initiatives
                                                                         • $3.0 billion cumulative free cash flow generated
  2017-2019, of which ~70% supported our omni-                             from 2017 through 2019                                                 • Stores have been upgraded and digital
  channel strategy                                                                                                                                  capabilities have been enhanced
                                                                         • Strong free cash flow generation of $908 million
• Reduced Capex in 2020 due to COVID-19                                    during 2020 pandemic                                                   • Expectation that adjusted ROI will return to prior
  pandemic                                                                                                                                          year high levels with achievement of 7% to 8%
• 2021 Capex expected to be in range of $550 to                                                                                                     operating margin
  $600 million with installation of 200 Sephora at                                                                                                • 2020 Adjusted ROI was significantly impacted
  Kohl's and new digital fulfillment center being                                                                                                   by the COVID-19 pandemic
  key drivers

            * Free Cash Flow and Adjusted ROI are non-GAAP financial measures. For reference, the reconciliations can be found in the Appendix.                                                          16
Committed to balanced capital allocation strategy with
long-term objective of maintaining Investment Grade rating
 Dividend ($ in millions)                                                 Share Repurchases ($ in millions)                                          Long-term Debt ($ in millions)

                                                                                                              $470                                    $2,797
                                 $423
               $400
  $368                                                                                       $396                                                                                             $2,451
                                                                           $306
                                                                                                                                                                        $1,861   $1,856

                                                  $108
                                                                                                                                 $8
   2017          2018             2019             2020                     2017              2018             2019              2020                    2017             2018    2019          2020

• Long-term commitment to paying a dividend                             • Thoughtful execution of share repurchases over                            • Modest pre-COVID-19 debt structure (2.5x
                                                                          time, including reducing share count by more                                leverage at year-end 2019) in relation to cash
• Prior to pandemic-driven suspension in 2020,                            than 50% since 2007                                                         flow generation
  distributed $3.2 billion in dividends from
  inception in 2011                                                     • Repurchased shares valued at $1.1 billion from                            • Reduced debt by over $940 million in 2018-2019
                                                                          2017 to 2019
• Reinstated a $0.25 per share quarterly dividend                                                                                                   • Sought capital in early 2020 to manage the
  payable on March 31, 2021                                             • Program suspended in 2020 due to COVID-19                                   uncertainty related to the COVID-19 pandemic
                                                                          pandemic
• Committed to growing our dividend over time                                                                                                       • Employing liability management strategies in
                                                                        • Plan to resume share repurchase program in                                  2021 to improve leverage ratio, including debt
                                                                          2021: $200 million to $300 million                                          repurchases

          * Leverage ratio refers to adjusted debt to adjusted EBITDAR and is a non-GAAP financial measure. For reference, the reconciliation can be found in the Appendix.                            17
Our strong Board has the right skills
and highly relevant experience
Significant Board experience in key executive roles
 • Of the 12 Board members, five are current or former CEOs of public companies

Established Board leadership in retail or consumer-facing industries
 • Board includes members who are leaders across a variety of industries, with all 12
   directors having retail or consumer-facing industry experience

Right Board in place focused on improving performance and creating
shareholder value
 • Board actively supported the development of the Company’s new strategic plan,
   announced in October 2020, with the goal of accelerating revenue growth and
   enhancing long-term profitability

Highly Engaged and Active
 • Board formulated an orderly succession for a new CEO with extensive industry
   expertise in 2018
 • Board provided oversight for significant, targeted investment in company’s
   omnichannel and digital capabilities to strengthen competitive positioning
                                                                                    18

                                                                                         18
Kohl’s has a strong and diverse Board of Directors
                                                                                   Board Refreshment

                                                                                           50%          New Board
                                                                                                        Members
                                                                                                            Directors

                                                                                            +6
                                                                                                            Departed
  Michael Bender      Peter Boneparth    Steven A. Burd        Yael Cosset
                                                                                            Directors
                                                                                             Added
                                                                                                             -4

                                                                                   2016                                  2021

                                                                                   Gender / Ethnic Diversity

  H. Charles Floyd     Michelle Gass     Robbin Mitchell      Jonas Prising                                             42%
                                                                                                                        5/12
                                                                                    30%

                                                                                    3/10

  John E. Schlifske   Adrianne Shapira    Frank V. Sica    Stephanie A. Streeter   2016                                  2021

                                                                                                                        19

                                                                                                                                19
Kohl’s Board of Directors are serving
as agents of positive change
   Adrianne                       Michelle                                                           Thoughtful Board Composition with
    Shapira
                    2017
                                 Gass (CEO)
                                                   2019
                                                               Yael Cosset
                                                                                  2021               Correct Set of Skills and Experience
  added to the                  added to the                   added to the
     Board                         Board                          Board
                                                                                                                                            S&P 500

                                                                                               Independence                      92%         86%
                  H. Charles                      Michael                         Robbin                                       Above Avg.

     2016        Floyd added       2018        Bender added       2020        Mitchell added
                 to the Board                   to the Board                   to the Board    Tenure (Years)                      9           9
                                                                                                                                 In Line

                                                                                               Age                                59          63
                                                                                                                               Below Avg.
 • Refreshed the Board and thoughtfully added skills needed to drive strategy change
                                                                                               Gender Diversity (% Women)        33%         29%
                                                                                                                               Above Avg.

 • Appointment of Michelle Gass as CEO in 2018 to drive fundamental change across
   the organization
                                                                                                       6 new Board Members added since 2016
 • Supporting the development of the Company’s new strategic plan, announced
   in October 2020, with the goal of accelerating revenue growth and enhancing
   long-term profitability                                                                       No Director sits on more than two outside Boards

 • Providing oversight of significant, targeted investment in our omnichannel and
   e-commerce capabilities to strengthen our competitive positioning                              Seven of 12 Directors are current or former CEOs,
                                                                                                         CFOs, COOs of public companies

                                                                                                                                                      20
Strong board with relevant and complementary skill sets
    Skill or Expertise                           Bender Boneparth   Burd   Cosset   Floyd   Gass   Mitchell   Prising   Schlifske   Shapira   Sica   Streeter

          Current or Former Public
          Company CEO

          Senior Leadership Experience

          Public Company Board
          Experience (other than Kohl’s)

          Board Diversity (Gender or
          Racial/Ethnic Diversity)

          Retail or Consumer-Facing
          Industries

          Finance, Accounting or
          Financial Reporting
          Experience

          Technology, E-Commerce or
          Digital Experience

          Marketing, Public Relations or
          Brand Management
          Experience

          Operations Management
          Experience

          Human Capital, Culture or
          Compensation Experience

          - Four current or former retail CEOs

                                                                                                                                                                21
Kohl’s Board outmatches Investor Group’s
nominees in key skills
                                                                Investor
                                                      Kohl’s     Group
                                                      Board    Nominees

    Public Company Board Experience                    12         5

    Current or Former Public Company CEO                5          1       Kohl’s Board has broader
                                                                           and deeper experience …
    Retail or Consumer-Facing Industries               12         8
                                                                           … while the Activist
    Finance, Accounting or Financial Reporting
    Experience                                         10         4        Investors’ slate has
                                                                           overseen significant value
    Technology, E-Commerce or Digital Experience       10         3        destruction, including 9
                                                                           companies which filed for
    Marketing, Public Relations or Brand Management                        bankruptcy
    Experience                                         10         4

    Operations Management Experience                   10         3

                                                                                                   22

                                                                                                        22
The Activist Investors’ actions to date raise concerns
about their real long term interest in Kohl’s

        We engaged constructively                         We reject the Activist
        to find common ground                             Investors' short-termism
           The Company engaged in multiple discussions       The Activist Investors presented no ideas which
           with the Activist Investors and responded to      the company was not already pursuing or had
           several information requests                      considered and rejected

                     Calls with Kohl’s Investor              The Activist Investors are focused on financial
           10+       Relations team
                                                             engineering at the expense of sustainable
                                                             operating and financial success

                                                             The Activist Investors are pushing for a larger
                     Meetings with Kohl’s
              4      Management
                                                             short-term cash payout at a time when
                                                             maintaining financial discipline is critical

                                                             The Activist Investors are advancing a proxy
                     Discussions with Kohl’s                 contest for control of Kohl's that threatens to
              7      Directors                               disrupt Kohl's strong business momentum

                We will continue to engage on matters that can increase shareholder
               value, but reject the Activist Investors’ efforts to take control of Kohl’s

                                                                                                               23

                                                                                                                    23
Appendix

           24
Sale-Leaseback Considerations
As an investment grade rated company, sale-leaseback transactions are typically an inefficient means to accessing capital
 • Company has readily available and more optimal financial alternatives
 • Company has utilized sale-leaseback transactions in the past when it was a clear efficient cost of capital (e.g. May 2020)

A sale-leaseback transaction would add operating risk and likely negatively impact our investment grade rated status
 • Transaction would significantly increase rent expense and is contrary to Company's focus on expanding operating margin
 • Transaction would also increase Company's leverage, which would likely result in a credit downgrade to high yield
 • Both outcomes would raise the Company's overall cost of capital

Company has a robust capital return strategy that will not be enhanced by a sale-leaseback
 • Company generates significant annual cash flow and it has a long history of returning a meaningful portion to shareholders
 • Prior to suspending the dividend due to the pandemic, Company distributed $3.2 billion in dividends since inception in 2011
 • Company's share repurchase program reduced share count by more than 50% since 2007
 • Sale-leaseback transactions would divert cash flow to addressing higher rent and interest expense

Company's bond indenture has restrictions on its ability to execute sale-leaseback transactions
 • Covenant on consolidated net tangible assets ("CNTA") is a common feature in the bond indentures of many of the Company's retail peers
 • CNTA of 15% provides a lien basket that currently is mostly utilized by the Company's $1.5 billion revolver and sale-leaseback transaction last year
 • Inability to skirt covenant due to past legal precedent and need for high percentage of bond investors consent on each tranche of debt

                                                                                                                                                          25
                                                                                                                                                           25
Reconciliations

       Adjusted
       Operating Income                         Free Cash Flow
       ($ in millions)                          ($ in millions)
                                2019                                          2017         2018         2019         2020

                                                Net cash provided by
       Operating Income     $          1,099                              $      1,691 $      2,107 $      1,657 $     1,338
                                                operating activities

       Impairments, store                       Acquisition of property
                                          113                                   (672)        (578)        (855)        (334)
       closing, and other                       and equipment

       Adjusted Operating                       Finance lease and
                                        1,212   financing obligation             (138)        (126)        (113)       (105)
       Income
                                                payments

       Total Revenue        $          19,974   Proceeds from financing
                                                                                     —            —            11           9
                                                obligations

       Adjusted Operating
                                                Free cash flow            $      881 $      1,403 $       700 $        908
       Income as a % of                6.1%
       Total Revenue

                                                                                                                                26
Reconciliations
                   Adjusted ROI
                   ($ in millions)
                                                                                      2017                      2018                       2019                      2020
                   Operating income                                                             1,416                      1,361                     1,099                     (262)

                   Depreciation and amortization                                                  991                       964                        917                       874

                   Rent expense                                                                  293                        301                        314                        314

                   EBITDAR                                                                     2,700                      2,626                     2,330                        926

                   Impairments, store closing and other costs                                        -                      104                         113                       89

                   (Gain) on Sale of real estate                                                     -                         -                          -                     (127)

                   Adjusted EBITDAR                                                            2,700                      2,730                     2,443                        888

                   Average: (a) Total assets                                                  13,467                      13,161                   14,802                     15,288

                   Cash equivalents and long-term investments (b)                              (629)                      (753)                     (393)                    (1,704)

                   Other assets                                                                  (32)                      (33)                       (31)                      (30)

                   Accumulated depreciation and amortization                                    7,217                      7,812                    6,854                       7,414

                   Accounts payable                                                           (1,548)                   (1,580)                    (1,495)                    (1,559)

                   Accrued liabilities                                                         (1,213)                   (1,235)                   (1,264)                    (1,193)

                   Other long-term liabilities                                                 (674)                      (658)                      (231)                     (275)

                   Capitalized rent (c)                                                         2,767                     2,831                           -                         -

                   Gross investment ("AGI")                                                   19,355                     19,545                    18,242                     17,941

                   ROI (d)                                                                     14.0%                      13.4%                      12.8%                      5.2%

                   Adjusted ROI (d)                                                            14.0%                      14.0%                     13.4%                       4.9%

    (a) - Represents average of five most recent quarter-end balances. For 2019, fourth quarter 2018 balances were adjusted to reflect the impact of the new lease accounting standard.
    (b) - Represents excess cash not required for operations.
    (c) - Represents ten times store rent and five times equipment/other rent. This is not applicable in 2020 & 2019 as operating leases are now recorded on the balance sheet due to the
    adoption of the new lease accounting standard.
    (d) - EBITDAR or adjusted EBITDAR, as applicable, divided by gross investment.                                                                                                          27
Reconciliations
                  Adjusted Debt
                  to Adjusted EBITDAR
                                                                    2019
                  ($ in millions)
                  Finance lease and financing obligations       $      1,491

                  Long-term cebt                                       1,856

                  Total debt                                    $     3,347

                  Operating leases                                     2,777

                  Rent x8                                                   —

                  Adjusted debt                                 $      6,124

                  Operating income                              $      1,099

                  Depreciation and amortization                            917

                  Rent expense                                             314

                  EBITDAR                                             2,330

                  Impairments, store closings and other costs              113

                  Adjusted EBITDAR                              $     2,443

                  Adjusted debt to adjusted EBITDAR                    2.51

                                                                                 28
You can also read