Zalando. The starting point for fashion - Investor Factbook - Zalando Corporate

Page created by Nathaniel Paul
 
CONTINUE READING
Zalando. The starting point for fashion - Investor Factbook - Zalando Corporate
Zalando.
    The starting point for fashion.

     Investor Factbook
       November 2019
1
Zalando. The starting point for fashion - Investor Factbook - Zalando Corporate
Welcome To Zalando

Dear reader,                                                                      Zalando Management Board
Zalando keeps the pace high. Only 10 years after founding the
company in 2008, we today have more than 28m active
customers in 17 European countries and have become
Europe’s leading online fashion destination. Building on this,
more than 15.000 employees work hard every day to turn
Zalando into the starting point for fashion for every fashion-
loving European.

This factbook is designed to give you easy access to the most
relevant capital markets information about Zalando.

Enjoy the read!

Robert, David, Rubin, Jim, David and the IR team
                                                                 David Schröder, Jim Freeman, Rubin Ritter, Robert Gentz, David Schneider

      2
Zalando. The starting point for fashion - Investor Factbook - Zalando Corporate
TABLE OF
CONTENTS

The Zalando Group

    Zalando at a glance

    Group strategy

Business segments

Financials

Share & contact

3
Zalando. The starting point for fashion - Investor Factbook - Zalando Corporate
Investment Highlights - The Starting Point for Fashion

        Our vision is to become the starting point for fashion, the destination that consumers
    1   gravitate to for all their fashion needs.

    2   The number 1 priority is to focus on growth with 20-25% topline CAGR
        to achieve a scale of 20bn EUR GMV by 2023/24.

    3   The most important building block on that journey is to transition our business towards
        a true platform business.

    4   At scale our strategy will result in an attractive financial profile, characterized by
        double-digit margin profile and strong cash generation.

    5   To become the starting point we aim to invest our economic surplus in our customer experience
        across assortment, digital experience and convenience to drive customer satisfaction and retention.

4
Zalando. The starting point for fashion - Investor Factbook - Zalando Corporate
Strong Growth Track Record Since Foundation In 2008

                                                                                                     2015+
                                                                            2013/
                                                      2011/                 2014
                                                      2012
                                 2010/
                                 2011
          2008/                                                                             PLATFORM MODEL
          2009                                                          OPERATIONAL
                                                 GEOGRAPHIC             EXCELLENCE          • Basis for future
                              CATEGORY            EXPANSION         • Basis for sustained       growth layers
         MARKET               EXPANSION                                 growth              • Leveraging
          ENTRY                              • 15 European          •   Proprietary             infrastructure
                         •   Apparel             markets                technology and          beyond wholesale
    • Focus on shoes     •   Sports          •   425m population        logistics infra-    •   Focusing on deep
    • Defined value      •   Accessories     •   Highly localized       structure               customer relation-
      proposition        •   Private label       approach           •   App innovation          ships (e.g. Zalando
    • Leadership in                                                 •   IPO October 2014        Plus)
      Germany

5
Zalando. The starting point for fashion - Investor Factbook - Zalando Corporate
Zalando In A Nutshell

         UNMATCHED REACH                                              STRONG LOCALIZATION

    17                             >80%                     >2,000                         >20
    European countries             mobile traffic           (local) Brands                  payment methods

    >3bn                           >28M                     >20                            13
    site visits last year          active customers         logistics partner              languages

         PLATFORM STRATEGY                                        LOGISTICS & TECH CAPABILITIES

               Zalando is leveraging its position to                         Best-in-class e-commerce
            develop from a typical retailer to become                        logistics infrastructure and
                 the ‘starting point for fashion’                                technology talent

6
Zalando. The starting point for fashion - Investor Factbook - Zalando Corporate
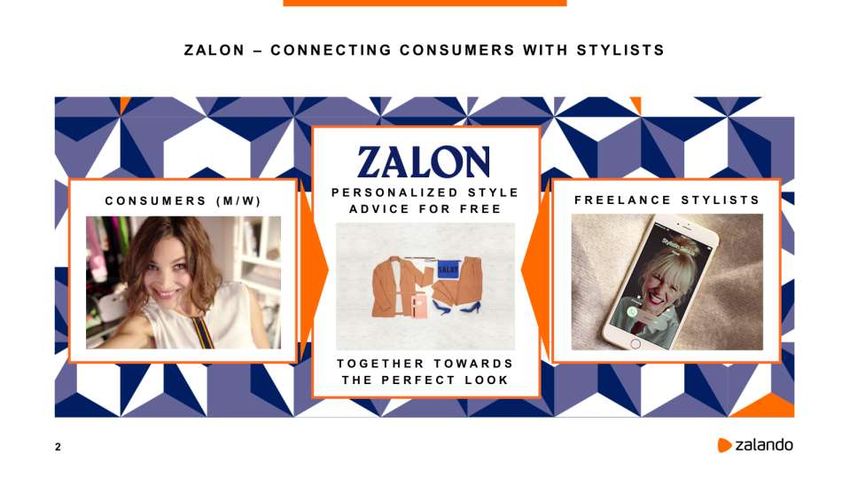
We Are Present in 17 European Markets…

                         Revenue & adj. EBIT FY/18 per region                          Geographical breakdown into the regions DACH & Rest of Europe

                                                                                          DACH
                                                                                          Rest of Europe
                           ~50%
             ~16%                                                   ~24%
              YoY                                                    YoY
                      Revenue               ~14%                                         Since 2018

                                        Adj. EBIT
                                        ~86%

                                               ~50%
                                                                                                                                         Since 2018
                    DACH                                   REST OF EUROPE

• Most mature Zalando markets                 • Some less developed online markets
• Similar consumer behavior (e.g.             • Diverse set of consumer behavior
    higher gross baskets, high return           (e.g. return rates, payment methods,
    rates, high invoice share)                  discount affinity, …)
•   Proximity to warehouse footprint
         7
Zalando. The starting point for fashion - Investor Factbook - Zalando Corporate
…With Our Success Build On Best-in-class
                                E-commerce Logistics Infrastructure And Technology Talent

1. ERFURT (GER)                                                 7. SZCZECIN (PL, Gryfino)
Start in 2012                                                   Start in 2017                                                      Technology FTE
2. BRIESELANG (GER)                                             8. OLSZTYNEK (PL)
Start in 2011                                      6            Start in 2019
                                                                                                          2,500
3. MÖNCHENGLADBACH                                              9. LODZ (PL, Gluchow)
(GER)                                                           Start in 2019                             2,000
Start in 2013                                                  10. VERONA (IT)
                                                       8
4. LAHR (GER)                                      7
Start in 2016
5. PARIS                        12
                                     3

                                         4
                                             1
                                              2            9   Start in 2020

                                                               11. MILANO (IT, Stradella)
                                                                                               +          1,500

(FR, Moissy-Cramayel)            5
                                              10
                                                               Start in 2016                              1,000
Start in 2016                            11
                                                               12. ROTTERDAM (NL, Bleiswijk)
6. STOCKHOLM
                                                                                                            500
                                                                • 140.000 sqm
(SWE)                                                           • €200m capex invest
Start in 2018                                                   • First parcel: mid 2021                      -
                                                                • Fully automated: mid 2022                               2014     2015    2016     2017    2018

•   Create the capacity for future growth:                                                         •   Tech capabilities will allow us to build a highly scalable, reactive
    12 warehouses can fulfill ~€14bn GMV                                                               platform to drive fashion commerce – for us and our partners
•   Get closer to our customers:                                                                   •   Micro Services/ cloud based architecture
    We will deliver 30% of orders on the next day by 20201                                         •   AI and data-driven methods are weaving itself to all areas of our
•   Scale a differentiating asset which we can open up to brand partners                               business (e.g. sizing advice, pricing, recommendations)

     8   (1) 3pm cut-off time
Zalando. The starting point for fashion - Investor Factbook - Zalando Corporate
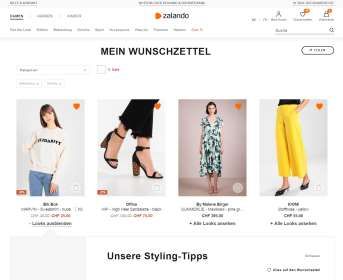
Our Competitive Advantage Is Our Clear Focus To Be
                          A Pureplay Online Fashion Leader In Europe

                                GENERAL      FASHION    VERTICAL FASHION   BRAND OWN    SOCIAL
                              E-COMMERCE   E-COMMERCE       PLAYERS        E-COMMERCE   MEDIA

    EXAMPLES

    ONLINE SCALE

    FASHION FOCUS/
    EXPERTISE

    BUY-IN FROM
                                                              n/m             n/m
    BRANDS

    E-COMMERCE
    INFRASTRUCTURE/                                                                      n/m
    TECHNOLOGY

    GEOGRAPHIC                                                                           n/m

9
Zalando. The starting point for fashion - Investor Factbook - Zalando Corporate
Zalando Is Still Managed By Its Founders, Supported By High-profile Experts That
                              Secure A Well-rounded View Of The Business

Robert Gentz            David Schneider           Rubin Ritter                    Jim Freeman      David Schröder
Founder & Co-CEO        Founder & Co-CEO          Co-CEO                          CTO              CFO
•   Marketing / Sales   •   Fashion Offer         •   Strategy
                                                                                  •   Product      •   Finance
•   Human Resources     •   Assortment Strategy   •   Corporate Commu-
                                                                                  •                •
                        •   Category Management       nication & Public Affairs
                                                                                      Technology       Operations
                        •   Brand Relations

     10
All Supervisory Board Members Have The Relevant Track Record From Various
                                  Businesses To Support Zalando

 CRISTINA                                   ANDERS HOCH                        ALEXANDER           JORGEN MADSEN         MARIELLA
STENBECK1                                     POVLSEN1                          SAMWER1              LINDEMANN1       RÖHM-KOTTMANN1

                     KELLY BENNETT1                                KONRAD SCHÄFERS2        BEATE SIERT2      ANTHONY BREW2

11   (1)    Current term until the end of Annual General Meeting 2021
     (2)    Employee representatives
TABLE OF
CONTENTS

The Zalando Group

  Zalando at a glance

  Group strategy

Business segments

Financials

Share & contact

12
Facing an Immense Market Opportunity, Our Number One Priority Is to
                                           Capture Market Share

   Fashion Market offers massive growth                                                                                           …with low online share compared to other
   opportunity over the next 5-10 years1…                                                                                                        categories

                                                                                Total                                                                                  Consumer
                                                                               fashion
                                                                                                                                                         Fashion
                                                                                                                                      40%                              Electronics2
                                                                               >450bn

                                                                                                                                      30%
                                                                 Online
                           >25%                                 fashion
                                                                                                                                      20%

                  >5%                                                                                                                 10%
                                                                                                                                                         15%    20%     36%   45%
                                                                                                                                         0%
Currently 1.5%                                                                                                                                           2018   2023   2018   2023

       (1)   Source: Company estimates and Euromonitor International, February 2019. Values based on actuals and estimates; fixed exchange rates.
  13         Fashion data incl. apparel and footwear, bags and luggage, jewelry and watches. Data for Europe (excluding Russia) inclusive of sales tax
       (2)   Source: United States online penetration, Statista, last update 2018-10
Our Vision:

     Zalando.
The Starting Point
   for Fashion
What Are Successful Starting Points?

     Music                          Movies &
                                     Series

                                               Fashion

15
Starting Point – What We Mean By This?

     INDISPENSABLE ROLE                                                         NO REASON TO DEFLECT
     Play an indispensable role in the life                                     Customers should not have a reason
     of our customers
                                                                                to deflect

                                                Starting Point for Fashion

      BE TOP OF MIND                                                            CONVOY HER JOURNEY
     Be the place our customers go to                                           We cover the full customer journey –
     whenever he/she thinks about fashion                                       from start to end

16
As A Starting Point, We Need To Be Top Of Mind, Top Of Consideration
                                              And Top Choice For Our Customers

                                             Top of                                                Starting Point
           Top of Mind                                                          Top Choice
                                             Consideration                                          for Fashion

17   (1)   Brand Monitor Q4/18; Zalando markets excl. UK, IE and CZ.
     (2)   GMV per active customer Q4/18 vs. estimated average customer fashion spend of €1,000.
We See Clear Progress On Our Journey To Build The Starting Point For Fashion…

                                                                                                                                        Most Visited Fashion
 Unaided Brand Awareness                                                                              Site Visits
        (relative to following competitor1)
                                                                                                                                        Destination in Europe
                                                                                                                                    (average # of monthly unique visitors in Europe 20182)

                                                1.4x                                              2.5x                              Zalando

                                               Nordics
                                                                                                                                     Inditex

                                                                                                                                       H&M
                                                                                                                                                                           #1
                                                                                                                                                                         in Europe
                                  2.5x
2.3x                                DACH
                                                                             ~70%                                     ~90%
                                                                                                                                       Asos
Other
                                                                                                                                     Adidas

          1.8x                                                                                                           (in # m)
                                                                                                                                       Nike
        Southern Europe
                                                                                   2014         ’15      ’16    ’17   2018
                                                                                            DIRECT TRAFFIC

    18     (1)   Brand Monitor Q4/18; simple average of relative positions across markets
           (2)   Comscore data as of Dec 2018
…With Customers Clearly Want One Multi-Brand Fashion Aggregator,
                         Serving Them Head to Toe

      45%                                                     13
        of orders                                         different brands
      contain more                                       bought per year by
     than one brand                                      female customers

19
Slowing Monobrand E-com Growth And Greater Engagement
                                                                Via App Reiterates Our View

Monobrand E-com Growth Is Slowing Down, …                                                     …while customers gravitate towards app…              …and Increase Engagement1
                                                                                                   0.5
% yoy
                                                                                                 0.45
  45
                                                                                                   0.4
                                                                                                                                                     App users visit more often:
                                                 Fast fashion brands
                                                                                                                                                     8.8x vs 3.5x on desktop
                                                 Shoe brand                                      0.35
       33
                                                                                                                          ~2X
            31                                   Sport brands                                      0.3                                               …spend more time:
                            28
                                                 Fashion brand                                   0.25                                                104 vs 23 products seen
                 23              22                                                                                                         44%
                                                                                                   0.2

                                               15 14                     15
                                                                                                                                                     … shop more2:
                                      14 14                                                      0.15
                                                       12 12                       12                                                                +31% GMV
                                                                    10        10
                                                                                                   0.1               21%

                                                                                                 0.05                                                … and are happier3:
                                                                                                     0
                                                                                                                                                     NPS +8
       2015                      2016              2017                  2018                                       2016                    2018

                 Source: Euromonitor
                      (1)    Data from December 2018, if not stated otherwise
             20       (2)    Existing customers who uses the App compared to existing user without App usage (period: 6 months 2017-2018)
                      (3)    App vs Desktop customer (Jan-May 2018)
The Platform Strategy Is One Key Lever
                                        Towards Being the Starting Point

                                                                          •   Partner Program enables
                                                                              brands to directly sell their
                                                                              products to Europe’s digital
                         Starting Point
                                                                              consumer

                                                                          •   Brands can leverage Zalando
                                                                              capabilities by using its
                                                 Platform                     fulfillment and marketing
•    Offer desirable and                         Strategy                     services (tech, data, logistics)
     comprehensive assortment

•    High availability                                                    • Platform adds scale to Zalando

•    High level of curation                                               • Less inventory risk – while
     through strict access control                                          improving customer offering
     for partner onboarding                                                 (50% of PP volume incremental)

21
Our Success Is Build On Two Pillars:
                                             Wholesale Business Vs Partner Program

                        Wholesale / Classical Retail                                            Partner Program

        •     Zalando buys merchandise                                       •   Brands have full control of the
              ahead of the season                                                offer and price

        •     Zalando is responsible for                                     •   In PP brand takes care of
              pricing and fulfillment                                            Fulfillment
                                                           G AP                                                      Massimo Dutti

GMV1                                                            ~90%                                                       ~10%

SKUs1                                              ~70%                                                            ~30%

        Additionally
        •     Zalando Fulfillment Solutions (ZFS): Zalando takes care of the fulfillment of the order
        •     Zalando Marketing Services (ZMS): Increase visibility & drives sales through campaigns/ad placements on our premises

   22   (1)    GMV/SKU share as of FY 2018
We Achieved Already a Number of Important Milestones
                             With our Partner Program

                                                         Zalando Fulfillment Solutions

     Scale           Roll-out            Live         Shipped items      # of Partners in ZFS

>10%               ~900                15            >30%                   >100
   of our         brands in PP     countries, only    of PP items           total signed
Fashion Store        of ~300          IE + CZ         are fulfilled             ZFS
    GMV             Partners        are missing         by ZFS                partners

23
We Aim To Achieve A Scale Of 20bn EUR GMV By 2023/24

                  Growth Ambition 2023/24                                                                     Business Model Mix 2023/24
                                       In €bn GMV                                                                           In €bn
                                                                                                                   ~20

                                                                       ~20
                                                                                                        Partner
                                                                                                       program
                                                                                                                  ~40%
                                                                                                                                      13
~10% Partner
  Program
                                       ~10
                      ~8.2
        6.6                                                                                           Wholesale    ~60%

     2018             2019            2020                …         2023/24                                        GMV               Revenue

                                                                                                      CAGR1       +20-25%            +15-20%

   24   (1)   5-year CAGR (2018-2023): high end of range, 6-year CAGR (2018-2024): low end of range
Platform Model to Drive Higher Long Term Profitability At Scale

                                                   Target Margin (growth in line with / slightly above online market)

                                                                      Partner         Group margin         Key assumptions:
           In % of revenue                             Wholesale1
                                                                      Program           impact 2
                                                                                                           •   PP share ~50% of GMV
      Gross margin                                                                                         •   ZFS share ~75% of PP items
                                                                                                           •   ZMS revenue 3-4% of GMV
 Fulfillment costs
                                                                                                           •   Operating leverage and fixed cost
                                                                                                               degression
     Marketing costs
                                                                                                           • Cash Flow: WC neutral and
                                                                                                               CapEx slightly above D&A
     Admin expense

     Adj. EBIT margin                                        6-8%      20-25%            10-13%

25   (1)     Wholesale includes Offprice and Private label
     (2)     Trend vs. 2018 cost lines
Financial Profile During Transition to Platform Model

                Transition phase 2019 - 2021           Years following                  Target model

                                                                               • Growth in line with / slightly
                             Continued high GMV growth of 20-25%
     Growth                                                                      above online market
                                      for the next 5 years

                • Margins between 2-4%, driven   • Margins start to increase   • Target margin of 10-13%
                  by growth investments and        as platform transition
Profitability     platform transition              progresses (e.g. impact
                                                   of ZMS)

                • Cash Flow negative                                           • Target margin leading to a
                • NWC neutral                                                    strong cash generation
     Cash       • Capex of 4-5% of revenue,
                  driven by logistics and
                  technology investments

26
TABLE OF
CONTENTS

The Zalando Group
Business segments
  Fashion Store
  Offprice
  Other: Emerging Businesses

Financials
Share & contact

27
We Manage Our Business In Three Distinct Segments

                                                                                            Revenue & adj. EBIT FY/18 per segment
                                                                                                                                                      OFFPRICE

                  FASHION STORE                                                                                                         • Zalando Lounge: shopping club for
                                                                                                                      ~€0.5bn2
                                                                                                                                            off-season and highly discounted
• The online shops, i.e. the main sales
                                                                                                                                            merchandise with lower level of
  channel in 17 European countries                                                      ~€6.1bn                      ~€0.5bn
                                                                                                                                            convenience (100% wholesale
                                                                                                          ~€5.0bn1
                                                                                                                             ~€0.5bn1       based)
• Characterized by a high level of                                                 GMV                                                  •   Zalando Outlets: 8 stores in DE
  convenience and a comprehensive in-
                                                                                             Revenue                 ~€35m
  season assortment
                                                                                                                                                        OTHERS

• Includes private label business zLabels                                                                        Adj. EBIT
                                                                                                                                        • Emerging Businesses which
                                                                                                                ~€162m
                                                                                                                                            contains several different businesses
• Business model currently under                                                                                                            like Zalon, Zalando Wardrobe,
  transformation: from wholesale to                                                                                                         Zalando Marketing Solutions and
  platform (i.e. fast-growing partner                                                                                                       inventory integration services from
  program business)                                                                                                                         Anatwine and Tradebyte

       28   (1)   Fashion Store (Other) contains -€80.9m (-€271.1m) reconciliation of internal revenues
            (2)   Offprice and Others combined
Our Holistic Fashion Proposition to Customers and Brand Partners

                                                                                                              Others
  Segments             Fashion Store                            Offprice                                               Platform Enablers
                                                                                         Emerging Businesses

Sales Channels
   / Service

                 • Major sales channels               • Lounge: shopping club for off-   • Zalon: fashion curation    • ZMS: marketing
                 • Includes business models:            season merchandise                 service (stylists)           services unit
  Business         • Partner Program                  • Outlet: offline sales channel    • Wardrobe: second hand      • Brand facing inventory
                   • Zalando Fulfillment Solutions      for excess inventory (8 stores     channel                      integration business
   models          • Private label business zlabels     +5 stores in the planning)       • Connected Retail:            (Saas)
                   • Distributed Commerce                                                  integration of brick-and
                                                                                           -mortar stores

   29
By Introducing Customers to All Our Services
                            We Cover More of Their Needs and Spend

      Zalando’s Holistic
                                                 GMV per Active Customer
     Fashion Proposition
                                                           (in %)

                                                                    +50%

                                                    +20%

       “Zalando is my
      one-stop-shop for
      everything I want
         in fashion”

30
As a result Our Customer Base Is Growing, Engaging More with Us
                                      And Happier Than Ever with Our Services

                Active Customers                                                                Order Frequency                 Customer Satisfaction
                               (# m)                                                           (# per customer, LTM)                 (Group NPS1)

                             2.0x                                                                             1.6x

                                        26.4                                                                             4.4

                                                                                                                                +14pts
                                                                                                    2.7
                   13.1

                                                                                                                                      2014-2018

                 2013                  2018                                                        2013                  2018

31   (1)   Net Promoter Score or NPS - NPS is a way to measure customer satisfaction. It is calculated as: 'How likely
           is it that you would recommend Zalando to a friend/colleague?'
Consequently, We Continue To Observe Healthy Development
                                                 Of Our Customer Cohorts

                                                                 TOTAL GMV PER COHORT1 AND ORDER YEAR
                                                                                                                                1 . Old Cohorts Grow
                                                                                                                                Again Over Time

                                                                                                                                2 . Customer churn goes
                                                                                                                                down

   GMV from
  2014 cohort
   GMV from                                                                                                                     3. Every new cohort is
earlier cohorts                                                                                                                 bigger than the previous
                                                                                                                                one
                            2014                        2015                         2016                         2017   2018

  32   (1)   Cohort refers to customers grouped by the calendar year in which they first placed an order with Zalando.
TABLE OF
CONTENTS

The Zalando Group
Business segments
  Fashion Store
  Offprice
  Other: Emerging Businesses

Financials
Share & contact

33
Our Holistic Fashion Proposition to Customers and Brand Partners

                                                                                                              Others
  Segments             Fashion Store                            Offprice                                               Platform Enablers
                                                                                         Emerging Businesses

Sales Channels
   / Service

                 • Major sales channels               • Lounge: shopping club for off-   • Zalon: fashion curation    • ZMS: marketing
                 • Includes business models:            season merchandise                 service (stylists)           services unit
  Business         • Partner Program                  • Outlet: offline sales channel    • Wardrobe: second hand      • Brand facing inventory
                   • Zalando Fulfillment Solutions      for excess inventory (8 stores     channel                      integration business
   models          • Private label business zlabels     +5 stores in the planning)       • Connected Retail:            (Saas)
                   • Distributed Commerce                                                  integration of brick-and
                                                                                           -mortar stores

   34
In Our Fashion Store, We Offer Brands Three Options Of Collaboration

                                                    Partner Program              Partner Program
                           Wholesale
                                                        with ZFS                   without ZFS
O    Control over      Zalando buys product                  Partner owns product, sets price
r      product          and has full control                    and books full retail value
d
e     Customer
r                                 Zalando shop (payment, customer care, reimbursement)
     Touchpoints
F
l     Logistics          Zalando warehouse            Zalando warehouse             Brand warehouse
o
w
      Package            Zalando package             Zalando package                 Brand package

                          Zalando provider (more favorable carrier conditions, delivery and returns
       Delivery                              experience; greater basket size)

35
What We Want Our Customers To Say About The Starting Point For Fashion

 1        Assortment                 2        Digital Experience         3        Convenience

                                                                        “I always buy fashion on Zalando
     “If it’s not on Zalando,            “Zalando always knows what
                                                                         – it’s so convenient, why would
         it doesn’t exist”               I want and what inspires me”
                                                                               I look anywhere else?”

                      “Zalando is my one-stop-shop for everything I want in fashion”

36
1   ASSORTMENT

                 Most Complete Assortment Makes Us The Starting Point For Fashion

          includes
           zLabels
                         ALL BRANDS       FULL RANGE     NEVER SOLD OUT     ENGAGING CONTENT

                                                                                     Campaigns
                                                                            ~1000    across
                                                          Partner program
                                                             backfilling
                                                                                17   Markets
    ACHIEVEMENTS
    TODAY
                                                         EUR     190M
                                                           in GMV 2018

     37
1   ASSORTMENT

                 Our Partner Program Helps Us To Complete The Assortment…

         CHOICE                                   AVAILABILITY
             MORE ARTICLES                               MORE ITEMS PER ARTICLE

                 M ORE ITEM S PER BASKET         M ORE TRANS AC TI ONS

    38
1   ASSORTMENT

                               …In Which Our Partners Having Full Control

                 Zalando                      Brand                      Brand               Zalando
                  Shop                      Warehouse                   Package              Provider

         •   Payment                  •   Shipment to Zalando      •   Delivery note   •   Same delivery and
                                          customer                                         returns experience
         •   Customer care                                         •   Returns label
                                      •   Returns handling                             •   Tracking
         •   Reimbursement

                             • Partner sets price
                             • One seller per article
                             • Partner books full retail revenue

    39
1   ASSORTMENT

                 Since Fulfillment Is Challenging For Partners At Times…

    LIMITED EU CROSS BORDER       HIGH                                HIGH

    LOGISTICS NETWORK             SHIPPING COSTS                      CUSTOMER
                                                                      E X P E C TAT I O N S

    40
1   ASSORTMENT

                           …They Can Make Use Of Our Fulfillment Capabilities Via
                                      Zalando Fulfillment Solutions

                 Zalando                      Zalando                         Zalando                   Zalando
                  Shop                       Warehouse                        Package                   provider

         •   Payment                  •   Reduces logistics          •   More favorable carrier   •   Same delivery and
                                          redundancies                   conditions                   returns experience
         •   Customer care
                                      •   Higher ecom                •   Greater basket size      •   Tracking
         •   Reimbursement                logistics efficiency           through broader
                                                                         assortment

                               • Partner sets price
                               • One seller per article
                               • Partner books full retail revenue
    41
1   ASSORTMENT

                          ZFS Unlocks Positive Platform Dynamics For Customers

          Superior Convenience for                            Larger Assortment for Customers
                 Customers

          1 parcel instead of 3-4 parcels    Unmatched unit economics for        Assortment of example brand on
                                                       brands                           Zalando, SKUs

                                                                                                x3

                                                   ~50%                                               ~18,000

                                                lower shipping costs (on
                                              average) per item for brands
                                                                                     ~6,000

                                            Making shopping economics in some
                                                case better than own e-com
                                                                                     2016               2018
                                                                                                     (with ZFS)

    42
1   ASSORTMENT

                 To Make The Look For Our Customers Complete,
                 We Have Launched Our Beauty Segment In 2018…

                                    #250
     > 10.000 SKUs

                                                                >60%

    43
…With The European Beauty Market Harbouring An Enormous Potential
                                   With Channel Shift Yet To Come

       EU Beauty Market Size (2018)…                                …with low online share compared to other
                                                                                   categories

                                                     Total Beauty                                  Consumer
                                                                               Beauty   Fashion
                                                      EU Market                                   Electronics2
                                                       ~€85bn        40%

                                                                     30%

                                                                     20%

                                     Beauty online
                €5bn                    Market
                                                                     10%
                                                                                           15%        36%
                                                                                   5%
                                                                      0%

44   Source: Statista, Euromonitor
What We Want Our Customers To Say About The Starting Point For Fashion

 1        Assortment                 2        Digital Experience         3        Convenience

                                                                        “I always buy fashion on Zalando
     “If it’s not on Zalando,            “Zalando always knows what
                                                                         – it’s so convenient, why would
         it doesn’t exist”               I want and what inspires me”
                                                                               I look anywhere else?”

                      “Zalando is my one-stop-shop for everything I want in fashion”

45
2   DIGITAL EXPERIENCE

                                       Our strategic pillars

                         Inspiration          Advice           Relevance

       46
2   DIGITAL EXPERIENCE

                                            Inspiration

                from                   to

                               Shoppable content
            Mainly
                               available on all
            products
                               customer journeys

            Mainly our voice   Many voices

       47
2   DIGITAL EXPERIENCE

                                             Advice

                from                    to

            Disconnected       Immersive journeys
            channels           across all channels

            Static content     Different media

            Focus on           Curation through
            individual items   outfits and collections

       48
2   DIGITAL EXPERIENCE

                                             Relevance

                from                    to

                                Unique, personalized
            One-size-fits-all   experience including
            experience          preferences, such as
                                sizing

                                Fluid & immersive
            Linear journey
                                experience

       49
2   DIGITAL EXPERIENCE

                      We Allow Customers To Spend More Time With Us In A Relevant Way

              Digital Experience        More Time Spend with Us        Increasing Size Recommendations
                                           (time spend on the app;
                                                                       (size flags as share of wholesale assortment)
                                          per user per month in min)
             Personalized inspiration

                                                                                                                 size-
                                                    4.3x                                  4.3x            -4%    related
                                                                                                                 returns
                                                           69                                    86%

                                              16                                    20%
            “Zalando always knows
             what I want and what
                 inspires me”                2014          2018                    2017          2018

       50
What We Want Our Customers To Say About The Starting Point For Fashion

 1        Assortment                 2        Digital Experience         3        Convenience

                                                                        “I always buy fashion on Zalando
     “If it’s not on Zalando,            “Zalando always knows what
                                                                         – it’s so convenient, why would
         it doesn’t exist”               I want and what inspires me”
                                                                               I look anywhere else?”

                      “Zalando is my one-stop-shop for everything I want in fashion”

51
3   CONVENIENCE

                     Zalando Convenience Delivers Five Key Services To Our Customers…

    1                                2                              3                             4
             Transactional Core                 Payments                        Logistics                 Customer Care

         •    Cart                       •   Payment processing         •   Warehouse logistics       •   Mail & phone support
         •    Check-Out                  •   Risk management &              (inbound, storage,        •   Chat
                                             fraud prevention               parcel outbound)
         •    Return Flow                                                                             •   Social Media
                                         •   Receivables                •   Returns handling
         •    Transaction Handling                                                                    •   Self-help / Smart FAQ
                                             accounting                 •   Transportation &
                                         •   Dunning & collection           shipping
                                                                        •   Network planning
                                                                        •   Warehouse
                                                                            engineering

    52
3   CONVENIENCE

                            …With Ease Of Payments And Ease Of Returns Are At
                                    The Core Of Customer Satisfaction

              Convenience               More Deferred Payments Offered …                …and easier returns
                                       (share of customers offered deferred payments)       (NPS Q4/18)
     Frictionless service experience

                                                                         Payment
                                                   +10pp           >90 NPS
                                                           65%

                                             55%
                                                                                          93%
                                                                                          of customers are
         “I always buy fashion on                                                         very happy with
              Zalando – it’s so                                                            ease of returns
          convenient, why would             2016           2018
          I look anywhere else?”

    53
3    CONVENIENCE

Payment
 Ease ofoptions
        payment
                               We Offer A Broad Range Of Payment Methods To
                                     Satisfy Local Customer Preferences

                   Countries                  Payment Methods                 Deferred Payments

                                                                INVOICE

                                                          PREPAYMENT

           Our presence in 17 countries   22 different payment methods    >60% deferred payment share
               requires localization

      54
3    CONVENIENCE

Payment
 Ease ofoptions
        payment
                                                             We Recently Turned Every Living Room Into
                                                                     A Personal Fitting Room

                                                                            Traditional e-commerce customer flow

                                                                                New Zalando Pay Later experience 1

      55   (1)   One week to try at home and only the amount of the articles kept is captured on the card. Available in 10 of 17 countries
3     CONVENIENCE

 On  time
Delivery  delivery
         options
   Delivery time
                                              To Ensure A Fast And Convenient
                                     Delivery And Return Handling To Our Customers…

         1. ERFURT                                                  7. SZCZECIN (Gryfino)
         Start in 2012                                              Start in 2017
                                                                                                   Create the capacity for future growth:
         2. BRIESELANG                                              8. OLSZTYNEK                   12 warehouses allow > 14bn GMV
         Start in 2011                                              Start in 2019
                                                           6
                                                                    9. LODZ (Gluchow)              Get closer to our customers:
         3. MÖNCHENGLADBACH
                                                                    Start in 2019
         Start in 2013                                                                             We will deliver 30% of orders
                                                                                                   on the next day by 20201
                                                           7   8   10. VERONA (Nogarole Rocca)
         4. LAHR                                       2
         Start in 2016                                         9   Start in 2020
                                          3
                                     12            1                                               Scale a differentiating asset which
         5. PARIS                             4
                                                  13               11. MILANO (Stradella)          we can open up to brand partners
                                                                   Start in 2016
         (Moissy-Cramayel)           5
         Start in 2016                        11 10
                                                                   12. ROTTERDAM (Bleiswijk)
                                                                   Start in 2021
         6. STOCKHOLM
         Start in 2018                                             13. Halle/Saale
                                                                   (Inbound Distribution Center)
                                                                   Start in 2019

       56    (1)   3pm cutoff time
3     CONVENIENCE

 OnDelivery
     time
Delivery     time
          delivery
         options

                                                          …We Heavily Invested Into Our Warehouse Assets1

                                                                                          Construction   Full capacity     Capex         Size
                                                                              Type                                                                 Status
                                                                                             start            exp.          (€m)       (k sqm)
          1         Brieselang (GER)                                           Hub           2011            2014
3     CONVENIENCE

Delivery
 OnDelivery
     timeoptions
          delivery
             time
                                         We Continue To Focus On Warehouse Automation
                                                To Reduce Lead Time And Costs

                                                                                                    Generation IV
                                                                                                      (coming)

                                                                       Generation III (live)

                                                Generation II (live)

                 Generation I (live)

                 Conveyor, linesorter,                                                         Shuttle technology and bag
                                                   Bag sorter          Warehouse robotics
                   outbound sorter                                                                        sorter

       58
3       CONVENIENCE
DO EN LIV   T IEMREY D
    Delivery time
O EP LT II VOENRSY       Without Having Strong Partnerships With (Local) Logistics Partners,
                                   ‚
                                 A Best-in-class‘ E-com Network Would Be Fruitless

                                                                 • >10 international warehouses

                                                                 • 25 domestic carrier integrations, 2 express
                                                                   carrier, 14 same day destinations

                                                                 • Economies of scale and “unfair” order
                                                                   economics

         59
3       CONVENIENCE

 OnDelivery
Delivery    time
     timeoptions
          delivery
                             We Furthermore Make Use Of A Local Delivery Network -
                                         Orchestrated Via Technology

    ORDER PLACED
     AT ZALANDO

                                                                              SAME DAY DELIVERY
                                         LINE HAUL
                         ZALANDO                     URBAN PARCEL HUB
                      LOGISTICS CENTER

                                                                                   ON DEMAND DELIVERY

                                                          NEXT DAY DELIVERY

         60
3     CONVENIENCE

 OnDelivery
Delivery    time
     timeoptions
          delivery
                               To Enhance Our Customer Propositions Even Further,
                     We Introduced Our To Fashion Tailored Membership Program Zalando Plus

                                                                                            Available to all customers
                                Program vision:                                             in Germany for €15 / year
            Building a program that defines the best-in-class online
                             fashion experience

                                Target customer:
                            existing customers with                    Faster delivery, including same-day
                             a high fashion spend

                                                                             Early access to sales

                               Economic objective:                          Personal stylist service
                      to increase customer satisfaction &
                                share of wallet                           Dedicated customer service

       61
3     CONVENIENCE

 OnDelivery
Delivery    time
     timeoptions
          delivery
                                          Now we are scaling it as part of
                                  our premium membership program Zalando Plus

                     Premium delivery for Zalando Plus         Zalando Plus expands in Europe

                                                                                                Existing network

                                                                                                Planned network

       62
TABLE OF
CONTENTS

The Zalando Group
Business segments
  Fashion Store
  Offprice
  Other: Emerging Businesses

Financials
Share & contact

63
Our Holistic Fashion Proposition to Customers and Brand Partners

                                                                                                              Others
  Segments             Fashion Store                            Offprice                                               Platform Enablers
                                                                                         Emerging Businesses

Sales Channels
   / Service

                 • Major sales channels               • Lounge: shopping club for off-   • Zalon: fashion curation    • ZMS: marketing
                 • Includes business models:            season merchandise                 service (stylists)           services unit
  Business         • Partner Program                  • Outlet: offline sales channel    • Wardrobe: second hand      • Brand facing inventory
                   • Zalando Fulfillment Solutions      for excess inventory (8 stores     channel                      integration business
   models          • Private label business zlabels     +5 stores in the planning)       • Connected Retail:            (Saas)
                   • Distributed Commerce                                                  integration of brick-and
                                                                                           -mortar stores

   64
Offprice With Outstanding Development In The Last 8 Years –
                                            Successfully Leveraging The Zalando Platform

                         CUSTOMERS                                                                                       BRANDS

                                                                                                               picture       picture

                                                                                                               picture       picture

     • Shopping club addressing                                 • Synergetic with Zalando platform:        • Allows brands to manage
           discount affine customers                                additional consumer reach, solves          excess inventory while
     •     Daily sales campaigns with 50-                           overstock problem for brands and           maintaining brand image
           70% discount                                             Zalando                                •   International distribution
                                                                •   Strong financials: ~45% p.a. growth
                                                                    since 2016 and profitable
                                                                •   2/5 sourced internal, remaining part
                                                                    from external sources1

65       (1)   Zalando Lounge sourcing split is as of FY 2018
The Zalando Outlets Strategically Complement Other Offerings
                                 On The Zalando Platform

                                          Hamburg

                                                   Hannover               Berlin

                                     Münster                                            Zalando outlets are supposed to
                                                                                   sell high-quality fashion items from either
                                                                Leipzig
                              Köln                                                          previous seasons or with
                                                                                                  minor defects

                                       Frankfurt
                                               Mannheim
                                                                Nuremberg

                                          Stuttgart       Ulm
                                                                  Munich
                                                Constance

66   planned
TABLE OF
CONTENTS

The Zalando Group
Business segments
  Fashion Store
  Offprice
  Other: Emerging Businesses

Financials
Share & contact

67
Our Holistic Fashion Proposition to Customers and Brand Partners

                                                                                                              Others
  Segments             Fashion Store                            Offprice                                               Platform Enablers
                                                                                         Emerging Businesses

Sales Channels
   / Service

                 • Major sales channels               • Lounge: shopping club for off-   • Zalon: fashion curation    • ZMS: marketing
                 • Includes business models:            season merchandise                 service (stylists)           services unit
  Business         • Partner Program                  • Outlet: offline sales channel    • Wardrobe: second hand      • Brand facing inventory
                   • Zalando Fulfillment Solutions      for excess inventory (8 stores     channel                      integration business
   models          • Private label business zlabels     +5 stores in the planning)       • Connected Retail:            (Saas)
                   • Distributed Commerce                                                  integration of brick-and
                                                                                           -mortar stores

                                                                                            Consumer-facing/              Brand-facing/
                                                                                               App based                  B2B services

   68
TBU

                                                               Zalon – Connecting
                                                                             C O NConsumers
                                                                                  TENTS     With Stylists

              • Editorial
              • The Zalando Group
                • Key Figures
                • Group Structure
                • Management
                • Strategy
                • Economic Parameters
              • Business models [no figures; only strategy and value proposition]
                • Fashion Store
                • Offprice
                • zLabels
                • Emerging Business
              • Financial Information [on segment level]
                • Income Statement
                • Balance Sheet
                • Cash Flow Statement
              • Zalando Shares
                • Zalando Shares
                • Investor Relations

69   1: Medi an consensus ex pect at i on as of 23 -O ct ober 2017.
Zalando Marketing Services – Connecting Brands To Consumers

          Brands                     Zalando Marketing Services               Consumers

                                   Influencer Products (Collabary)

                                         Consumer Insights

                                          Media Products
                                              No. of campaigns

     >37m female unique visitors

                                                                        >900 m visits per quarter
                                                                        >28 m active customers
                                       2016         2017         2018

70
Connected Retail - Connecting Offline Stores To Our Online World

     D E E P S Y S T E M I N T E G R AT I O N -        H AN D S H AK E M O D E L –
     M AN Y T R I E D I T , M AN Y F AI L E D      L E AN W AY O F I N T E G R AT I N G

71
TABLE OF
CONTENTS

The Zalando Group

  Zalando at a glance

  Group strategy

Business segments

Financials

Share & contact

72
Zalando KPI Development

                                                                         FY/16          FY/17          Q1/18          Q2/18           Q3/18          FY/18          Q1/19           Q2/19        Q3/19
Site Visits (m)1                                                       1,991.6        2,563.5           713.5          734.3          728.7         3137.2           923.6          986.4       1,000.3
Mobile Visit Share (in % of Site Visits)2                               65.6%          70.7%           76.6%          78.4%          80.0%           79.3%          82.4%          83.5%        84.4%
Active Customers (m)3                                                      19.9           23.1           23.9            24.6           25.1           26.4           27.2               28.3     29.5
                             4
Number of Orders (m)                                                       69.2           90.5           25.4              29           27.7          116.2           31.4               36.1     34.7
Average Order per Active Customer (LTM)                                  3.48x          3.92x           4.02x          4.18x          4.30x           4.40x          4.49x          4.60x        4.63x
Average Basket Size (in €) (LTM)5                                              -          60.6           59.4            58.4           57.7           57.2           57.1               56.9     56.6
Average Basket Size (in €) (quarter)                                           -          60.6           56.1            56.9             55           57.2           55.9               56.4     54.6
Gross Merchandise Volume (in €bn)6                                          4.4           5.48           1.43            1.65           1.52           6.64           1.76               2.04     1.89
                                                  7
Fulfillment Cost Ratio (in % of revenue)                                  23%             26%            28%            28%             30%            28%            29%                27%    28.6%
Marketing Cost Ratio (in % of revenue)8                                   10%              8%              7%             6%             8%             7%              7%               8%        8%

     (1)    Site Visits defined as the number of series of page requests from the same uniquely identified client at Zalando, including w ebsite, m.site and apps in the measurement
            period. A visit is considered ended when no requests have been recorded in more than 30 minutes.
     ( 2)   Mobile is defined as tablets, mobile site and apps.
     (3)    Active Customers defined as the number of customers placing at least one order in the last twelve months in the measurement p eri od irrespective of cancellations or
            returns.
     (4)    Number of Orders defined as the number of customer orders placed in the measurement period irrespective of cancellations or r eturns. An order is counted on the day
            the customer places the order. Orders placed and orders delivered may differ due to orders that are in transit at the end of the measurement period or have been
            cancelled.
     (5)    Defined as GMV divided by the number of orders.
     (6)    GMV is defined as the value of all merchandise sold to customers after cancellations and returns and including VAT, dynamical ly reported. It does not include B2B
            revenues (e.g. Partner Program commission, Zalando Marketing Services or Zalando Fulfillment Solutions) and other B2C revenue s (e.g. service charges like express
            delivery fees) – these are included in revenue only. GMV is recorded based on the time of the customer order. Dynamically report ed.
     (7)    Fulfillment Cost Ratio defined as fulfillment cost as a proportion of revenue in the measurement period. Fulfillment costs ma inly include logistics, content creation,
            service and payment expenses, as well as allocated overhead. costs. Fulfillment costs therefore comprises all selling and dis tribution costs, except for marketing costs.
            All numbers shown excluding equity -settled SBC costs.
     (8)    Marketing Cost Ratio defined as marketing cost as a proportion of revenue in the measurement period. Marketing cost mainly co nsi sts of advertising expenses including
73          search engine marketing, television, online display and other marketing channels as well as allocated overhead cost. All numb ers shown excluding equity -settled SBC
            costs.
Income statement
                         €m                                                                       FY/161         FY/171          FY/18        Q3/18    2018ytd     Q3/19    2019ytd
                         Revenue                                                                 3,639.0        4,489.0        5,387.9       1,200.2    3,726.3   1,521.1    4,496.6
                         % growth                                                                 23.0%          23.4%             20.0%     11.7%      18.3%     26.7%       20.7%

                         Cost of Sales                                                           (2029.6)      (2529.6)       (3107.0)       (726.5)   (2170.1)   (896.4)   (2592.1)
                         Gross Profit                                                            1,609.4        1,959.4        2,280.9        473.7    1,556.1     624.7     1,904.5
                         % margin                                                                 44.2%          43.6%             42.3%     39.5%      41.8%     41.1%       42.4%
                         Selling and Distribution Costs                                         (1,223.7)     (1,530.8)       (1,899.2)      (459.7) (1,351.8)    (560.2)   (1,620.2)
                         Administrative Expenses                                                  (191.3)        (242.9)           (268.9)    (70.4)    (195.8)    (72.9)    (221.0)
                         Other Operating Income                                                      16.7           11.8              18.7       1.4       10.8       1.8       10.8
                         Other Operating Expenses                                                    (4.1)          (9.9)           (12.3)     (0.7)      (2.9)     (0.2)      (7.3)
                         EBIT                                                                       207.0          187.6             119.2    (55.7)       16.5     (6.9)       66.7
                         % margin                                                                   5.7%           4.2%             2.2%     (4.6%)      0.4%     (0.5%)       1.5%
                         Net Financial Result                                                      (14.1)         (12.4)            (13.6)     (1.7)      (5.7)    (11.7)      (20.2)
                         EBT                                                                       192.9          175.2             105.6     (57.3)      10.8     (18.6)        46.5
                         % margin                                                                   5.3%           3.9%             2.0%     (4.8%)      0.3%     (1.2%)       1.0%
                         Income and Other Tax                                                      (72.5)         (73.6)            (54.4)     15.6      (15.7)       5.0      (32.2)
                         Net Income                                                                 120.5          101.6             51.2     (41.7)      (5.0)     13.6        14.3
                         % margin                                                                   3.3%           2.3%             0.9%     (3.5%)     (0.1%)    (0.9%)       0.3%
                         Depreciation & Amortization                                                 48.2           58.7             86.5       21.9      59.5      46.4       140.5
                         EBITDA                                                                     255.2          246.4            205.7     (33.7)      75.9      39.5       207.2
                         % margin                                                                   7.0%           5.5%             3.8%     (2.8%)      2.0%      2.6%        4.6%
                         Share Based Compensation (SBC)                                              19.9
                                                                                                   (10.6)           27.5
                                                                                                                     0.0             43.3
                                                                                                                                     10.9      16.8
                                                                                                                                                0.0       28.2
                                                                                                                                                          10.9      13.2
                                                                                                                                                                     0.0        13.2
                                                                                                                                                                                 0.0
                         Adj. EBIT                                                                  216.3          215.1            173.4     (38.9)      55.5        6.3      114.5
                         % margin                                                                   5.9%           4.8%             3.2%     (3.2%)      1.5%      0.4%        2.5%
                         Adj. EBITDA                                                                264.5          273.8            259.9     (16.9)     115.0      52.7       255.0
                         % margin                                                                   7.3%           6.1%             4.8%     (1.4%)      3.1%      3.5%        5.7%

     (1)   Prior year figures not re-stated for shifts between cost lines as a result of new segment structure as of Jan 18.
74   (2)   Excluding equity-settled share-based payment expense (“SBC”), restructuring costs and non-operating one-time effects.
Segments1
                         €m                                                    FY/161           FY/171             FY/18             Q3/18     2018ytd     Q3/19    2019ytd
                         Revenue (in €m)                                    3,639.0          4,489.0             5,387.9           1,200.2     3,726.3    1,521.1   4,496.6
                         Fashion Store                                                 -      4,150.5            4,967.7           1,101.3     3,428.6    1,397.8   4,144.4
                         thereof DACH                                       1,813.8          2,150.0            2,483.7             542.4      1,720.2     666.7    2,020.4
                         thereof Rest of Europe                              1,570.2          2,000.4            2,484.0             558.9     1,708.4     731.1    2,124.0
                         Offprice                                                      -        345.3             497.5             112.8       347.8      160.4      452.9
                         Other                                                  255.1            345.3             444.8             111.4       311.9      42.2      190.1
                         Reconciliation                                                -       (352.0)           (522.0)           (125.1)      (362.0)    (79.4)   (290.8)
                         Adjusted EBIT (in €m)                                 216.3            215.1             173.4              (38.9)      55.5         6.3     114.5
                         Fashion Store                                                           213.7             162.0             (40.9)       51.1        9.5     121.4
                         thereof DACH                                          226.3            193.5             139.9                (7.8)     68.8       40.1      134.0
                         thereof Rest of Europe                                  (3.3)            20.3               22.0            (33.1)      (17.7)
                                                                                                                                                   0.0      -30.7     -12.5
                         Offprice                                                      -         27.6               35.2                8.1      24.1         3.2        14
                         Other                                                   (6.7)           (26.3)            (24.4)              (4.7)     (20.4)     (6.4)     (21.6)
                         Reconciliation                                                -          (0.0)               0.7              (1.3)       0.8        0.1       0.6
                         Adjusted EBIT margin (in %)                             5.9%             4.8%              3.2%             (3.2%)       1.5%      0.4%       2.5%
                         Fashion Store                                                              0.1                0.0             (0.0)       0.0      0.7%      2.9%
                         Fashion Store – DACH                                  12.5%             9.0%               5.6%            (1.4%)       4.0%      6.0%       6.6%
                         Fashion Store – Rest of Europe                            0%               1%                1%               -6%         -1%       -4%       -1%
                         Offprice                                                      -         8.0%               7.1%              7.2%       6.9%      2.0%       3.1%
                         Other                                                     5%              -8%               -5%               -4%         -7%     -15%       -11%
                         Reconciliation                                                -        (0.4%)              3.4%              3.2%      (0.2%)      (0.0)      (0.0)

75   (1)   New segment structure from Jan 1, 2018 onwards. Offprice reported separately from Q2/18 onwards. FY/15 and FY/16 not restated.
Share Based Compensation And Adjustments

 €m                                                    FY/16    FY/17   FY/18   Q3/18   2018ytd   Q3/19   2019ytd
 Per Income Statement Line Item
 Cost of Sales                                           5.0     6.9      3.6    1.0        2.6     0.9       2.4
 Selling and Distribution Costs                          9.9    13.7     10.1    3.6       7.4      2.3       6.1
 Administrative Expenses                                 5.0     6.9     29.5   12.2      12.2     10.0      26.2
 Share Based Compensation                              19.9     27.5     43.3   16.8      22.8     13.2      34.7
 Restructuring Costs/ Non-Operating One-Time Effects   (10.6)     0.0    10.9    0.0      21.8      0.0      13.0

 Delta between adj. EBIT and EBIT                        9.3    27.5     54.2   16.8      44.6     13.2      47.7

76
€m
                                                                                     Balance Sheet                                           Q3/18                Q3/19
                            Total Non-Current Assets                                                                                         679.7                1378.7
                            Thereof: Property, Plant and Equipment                                                                           462.9                 638.2
                                      Lease Assets                                                                                                                   521
                                      Other Non-Current Assets                                                                               191.7                 190.5
                            Total Current Assets                                                                                           2,492.3                2837.4
                            Thereof: Inventories                                                                                           1,025.3                1267.4
                                      Trade and Other Receivables                                                                            323.8                 387.2
                                      Other Assets 1                                                                                         266.2                 315.7
                                           1
                                    Cash and Cash Equivalents                                                                                877.0                   867
                            Total Assets                                                                                                   3,172.0                  4216
                            Total Equity                                                                                                   1,486.9                1589.1
                            Thereof: Issued Capital                                                                                          248.0                 248.6
                                      Capital Reserves                                                                                     1,148.0                1187.8
                                      Retained earnings                                                                                        (3.7)                  -13
                                      Accumulated Loss                                                                                        94.7                 165.9
                                      Minority Interests                                                                                       (0.1)                 -0.2
                            Total Non-Current Liabilities                                                                                     65.4                 540.7
                            Thereof: Non-current Lease liabilities                                                                             6.3                 474.2
                                     Financial Liabilities                                                                                                            3.4
                                      Other Non-Current Liabilities                                                                           43.1                  63.1
                            Total Current Liabilities                                                                                      1,619.7                2086.2
                            Thereof: Trade Payables and Similar Obligations                                                                1,356.5                1724.4
                                      Other Current liabilities                                                                              259.9                 361.8
                            Total Equity & Liabilities                                                                                     3,172.0                  4216
                            Net Working Capital                                                                                                (7.4)               (69.7)

     (1)   Other assets includes investments into short -term deposits of € 20m, which are not listed under Cash and Cash Equivalents due to their maturity of more than
77         3 but less than 12 months .
Cash Flow Statement
     €m                                                                           FY/16     FY/17     FY/18     Q3/18     Q3/19
     Net Income                                                                  120.5     101.6      51.2      (41.7)    (13.6)
     Non-Cash Expenses from Share-Based Payments                                  19.9      27.5      43.3      16.8      13.2
     Cash Settlement of Claims from Share-Based Payments                            0.0       0.0       0.0       0.0       0.0
     Depreciation & Amortization                                                  48.2      58.7      86.5      21.9      46.3
     Income Taxes                                                                 72.5      73.6      54.4      (15.6)     (5.0)
     Income Taxes Paid, Less Refunds                                              (33.8)    (49.4)    (42.2)    (10.9)    (20.7)
     Change in Provisions                                                           0.1      (1.5)      0.3      (0.0)      0.7
     Other Non-Cash Income                                                          1.2       6.5       4.2       0.1      (1.3)
     Change in Inventories and Receivables                                       (147.4)   (251.0)   (157.0)   (225.0)   (389.9)
     Change in Trade Liabilities                                                 264.3     198.4     180.6     250.1     389.0
     Change in Other Assets/Other Liabilities                                     (69.7)    29.2       (8.5)    (21.6)    (19.5)
     Cash Flow from Operating Activities                                         275.8     193.7     212.8      (25.9)     (0.7)
     Payments received from the sale of fixed assets                                0.0       0.0     58.9      57.0        0.0
     Payments for Investments in Fixed and Intangible Assets                     (181.7)   (243.9)   (278.4)    (60.6)    (88.0)
     Payments for Acquisitions                                                    (30.4)    (34.9)     (7.1)     (0.8)      0.0
     Cash Paid for Investments in Term Deposits                                   (65.0)   180.0      20.0        0.0       0.0
     Change in Restricted Cash                                                      0.0      10.4      (0.4)     (0.4)      0.0
     Cash Flow from Investing Activities                                         (277.1)    (88.3)   (207.0)     (4.8)    (88.0)
     Payments Received from Capital Increases                                       1.1       3.9     38.2      32.2      20.4
     Cash Received from Loans                                                       0.0       0.0       0.0       0.0       0.0
     Repurchase of treasury shares                                                  0.0     (11.3)   (111.3)     (0.4)      0.0
     Cash payments for the principle portion of leasing liabilities                 0.0       0.0       0.0       0.0     (15.3)
     Cash Repayments of Loans                                                      (3.2)     (3.2)     (2.8)    (0.7)      (1.0)
     Cash Flow from Financing Activities                                           (2.9)    (10.6)    (75.9)    31.1        4.1
     Change in Cash & Cash Equivalents                                             (4.1)     94.8     (70.1)     0.4      (84.6)
     Effects of Exchange Rate on Cash & Cash Equivalents                            0.5      (1.9)      0.3       1.8      (2.8)

78
Management Compensation Scheme1

                                                                                                                                   Performance-Based Remuneration
           Non-Performance-Based Remuneration
                                                                                                                                        (Long-Term Incentives)

                             Fixed Remuneration                                                                                         Long Term Incentive 2018

                                                                                                               • Each member of the Management Board receives 1,750,000
                                                                                                                 options for the five-year contract under the LTI 2018
                                                                                                               • Each option relates to one share in the company and
                                                                                                                 has an exercise price of €47.44
• Gross annual fixed based salary amounts to €65k
                                                                                                               • Performance criterion:2 Execercisable options
  per member of the Management Board
                                                                                                                 (in% of total # of vested options)
                                                                                                                     CAGR2 ≥ 15.0% → 100%
                                                                                                                     >15.0% but ≥ 14.5% → 90%
TABLE OF
CONTENTS

The Zalando Group

  Zalando at a glance

  Group strategy

Business segments

Financials

Share & contact

80
The Zalando Share

                           Shareholder structure1                                                    Share information

                                                                                                                          Ordinary bearer shares
                                                                              Type of Shares
                                                                                                                  with no-par value (Stückaktien)
                                                                              Stock Exchange                          Frankfurt Stock Exchange
                                                                              Market Segment                  Regulated Market (Prime Standard)
                                                                              Index Listings                   MDAX, STOXX600, FTSE4Goods
                                                    Kinnevik AB               First day of trading                               October 1, 2014
                                                       ~26%                   Issue price                                             EUR 21.50
                                                                              Total Number of
                                                                                                                                    252,765,235
                                                                              Shares Outstanding

                                                                              Issued Share capital                             EUR 252,765,235

                                                 Baillie Gifford              ISIN                                               DE000ZAL1111

Free Float                                           ~12%                     WKN                                                        ZAL111

  ~62%                                                                        Ticker Symbol                                                  ZAL

                                             Anders Holch Povlsen             Common Code                                             111189528
                                                    ~10%                      Thomson Reuters                                            ZALG.F

                                                                              Bloomberg                                                  ZAL.GR

     81   (1)   As of 23 September 2019
Zalando Analyst Coverage1

                              VOLKER BOSSE       CHRISTOPH BAST        DAVID HOLMES   ANDREW ROSS     MICHELLE W ILSON
ROCCO STRAUSS                                                                                                             CLEMENT GENELOT

ADAM COCHRANE               ANDREAS RIEMANN        SIMON IRW IN        JAINA MISTRY   THOMAS MAUL      KONRAD GRYGO         TUSHAR JAIN

 MAGNUS RAMAN                CHRISTIAN SALIS    GEORGINA JOHANAN       JÜRGEN KOLB    W AYNE BROW N     TOBIAS SITTIG      GEOFF RUDDELL

  DANIEL OVIN                 MARK JOSEFSON       RALF MARINONI        SHERRI MALEK
                                                                                       EMILY W ANT    REBECCA MCCLELLAN    ANNE CRI T CHL OW

OLIVIA TOW NSEND            JÖRG PHILIPP FREY    IKE BORUCHOW

       82   (1)   As of 1 November 2019
Zalando Investor Relations Team

Patrick Kofler – Team Lead IR   Dorothee Schultz – Junior Manager IR
Patrick.Kofler@zalando.de       Dorothee.Schultz@zalando.de

                                                                       Team Contact
                                                                       T: +49 3020 9681 584
                                                                       Zalando Tamara-Danz-Straße 1
                                                                       10243 Berlin
                                                                       investor.relations@zalando.de
                                                                       https://corporate.zalando.com/en
Nils Pöppinghaus – Manager IR   Jan Edelmann – Manager IR
Nils.Poeppinghaus@zalando.de    Jan.Edelmann@zalando.de

        83
Disclaimer

Certain statements in this communication may constitute forward looking statements. These statements are based on
assumptions that are believed to be reasonable at the time they are made, and are subject to significant risks and uncertaint ies.
You should not rely on these forward -looking statements as predictions of future events and we undertake no obligation to
update or revise these statements. Our actual results may differ materially and adversely from any forward -looking statements
discussed on this call due to a number of factors, including without limitation, risks from macroeconomic developments, exter nal
fraud, inefficient processes at fulfillment centers, inaccurate personnel and capacity forecasts for fulfillment centers, haz ardous
material / conditions in production with regard to private labels, lack of innovation capabilities, inadequate data security, lack of
market knowledge, risk of strike and changes in competition levels.

84
85
You can also read