Q2 2018 Earnings Presentation Accelerating our Journey - Rainer Beaujean, Speaker of the Management Board and CFO July 12, 2018

Page created by Amanda Morrison
 
CONTINUE READING
Q2 2018 Earnings Presentation Accelerating our Journey - Rainer Beaujean, Speaker of the Management Board and CFO July 12, 2018
Q2 2018 Earnings Presentation
Accelerating our Journey
Rainer Beaujean, Speaker of the Management Board and CFO
July 12, 2018
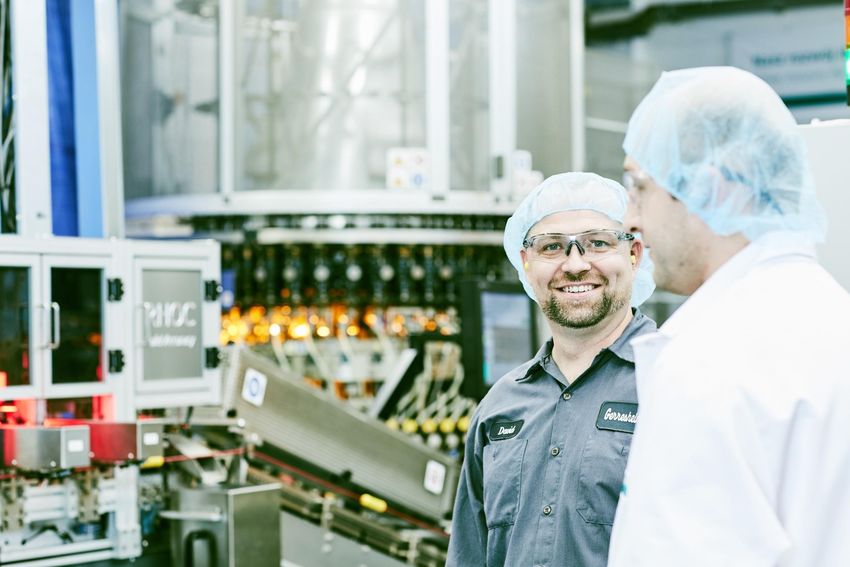
Q2 2018 Earnings Presentation Accelerating our Journey - Rainer Beaujean, Speaker of the Management Board and CFO July 12, 2018
Disclaimer

     This presentation may contain certain forward-looking statements, including assumptions, opinions and views of the
     Company or cited from third party sources. Various known and unknown risks, uncertainties and other factors could
     cause the actual results, financial position, development or performance of the Company to differ materially from the
     estimations expressed or implied herein.

     The Company does not guarantee that the assumptions underlying such forward-looking statements are free from
     errors nor does the Company accept any responsibility for the future accuracy of the opinions expressed in this
     presentation or the actual occurrence of the forecast development.

     No representation or warranty (expressed or implied) is made as to, and no reliance should be placed on, any
     information, including projections, estimates, targets and opinions, contained herein, and no liability whatsoever is
     accepted as to any errors, omissions or misstatements contained herein, and, accordingly, none of the Company or
     any of its parent or subsidiary undertakings or any of such person‘s officers, directors or employees accepts any
     liability whatsoever arising directly or indirectly from the use of this document.

     For an overview of abbreviations and definitions please see the glossary slide in the backup section

July 2018      Q2 2018 Earnings                                                                                          2
Q2 2018 Earnings Presentation Accelerating our Journey - Rainer Beaujean, Speaker of the Management Board and CFO July 12, 2018
Accelerating our journey: Agenda

1. Highlights
2. Sensile Medical
3. Recent operational developments
4. Q2 2018 financials & FY 2018 outlook
5. Conclusion
6. Appendix

July 2018   Q2 2018 Earnings              3
Q2 2018 Earnings Presentation Accelerating our Journey - Rainer Beaujean, Speaker of the Management Board and CFO July 12, 2018
Highlights
Q2 2018 Earnings Presentation Accelerating our Journey - Rainer Beaujean, Speaker of the Management Board and CFO July 12, 2018
Gerresheimer enhances business model and increases revenues
projections

                                  Strategic enhancement of our business model through the acquisition of Sensile
                                  Medical
                                  Gerresheimer now positioned as platform partner for Pharma and
       Sensile Medical            Biotech/Biosimilars customers with digital & electronic solutions

                                  New projects won with Inhalation and Heparine/Vaccines customers, translating
                                  into superior organic revenues growth and profitability in 2021 & 2022
                                  Launch of new projects requires footprint reorganisation to accommodate future
       Growth Projects            volumes, necessitating higher capex spend in 2019 & 2020

                                  Confirming higher growth expectations for H2 2018 year-on-year

                                  FY 2018 FXN revenues guidance narrowed to the upper end parameters
        2018 Guidance

July 2018      Q2 2018 Earnings                                                                                    5
Q2 2018 Earnings Presentation Accelerating our Journey - Rainer Beaujean, Speaker of the Management Board and CFO July 12, 2018
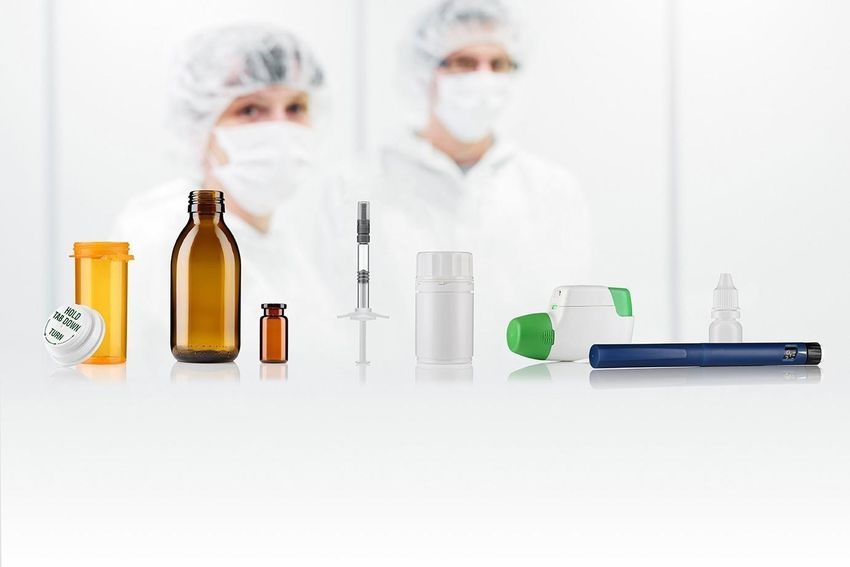
SENSILE‘S DRUG DELIVERY PLATFORM

          @ Corp Comm JK: Do you think we could get a better image ?

  Sensile Medical
Q2 2018 Earnings Presentation Accelerating our Journey - Rainer Beaujean, Speaker of the Management Board and CFO July 12, 2018
Sensile Medical at a glance

 GENERALINFORMATION
GENERAL   INFORMATION                    3 P l a t f o r m s ; U n i q u e Te c h n o l o g y ; C u s t o m i z e d p r o d u c t s
  HISTORY                                3 PLATFORMS                         ROTARY PISTON TECHNOLOGY                    SECURED PATENTS
                                          Small volume patch pump                                                        >140 patents
   Founded in 2004 to develop a           Large volume patch pump                                                        34 patent families
   micro pump based on a rotary           Belt worn pump
   piston pump technology. The
   pump consisted of only a few parts                                            CUSTOMIZED PRODUCTS
   but provided high accuracy.

   FTEs
   Approx. currently 120 FTEs

  LOCATION                                                    Strong device pipeline with dedicated and
   Headquartered in Olten, Switzerland                              therapy optimized solutions

  SPECIFIC KNOW HOW
                                         Developer of patch pumps focusing       Besides these two main projects    For all existing projects,
    R&D as well as Technology           on the delivery of Insulin for          other projects under development   partnerships with customers
                                         diabetes type 2 patients (products      are focusing on other treatment    are contracted
    Patents, contracts and IPs          gPump) and Injectable Furosemides       areas:
    No material tangible assets         (Diuretics) for patients with Chronic    Parkinson
                                         Heart Failure (CHF) through              Immunodeficiency
    No own product manufacturing        reusable and disposable patch            Immunostimulants
                                         pumps in Europe and North
July 2018        Q2 2018 Earnings
                                         America.                                                                                                 7
Q2 2018 Earnings Presentation Accelerating our Journey - Rainer Beaujean, Speaker of the Management Board and CFO July 12, 2018
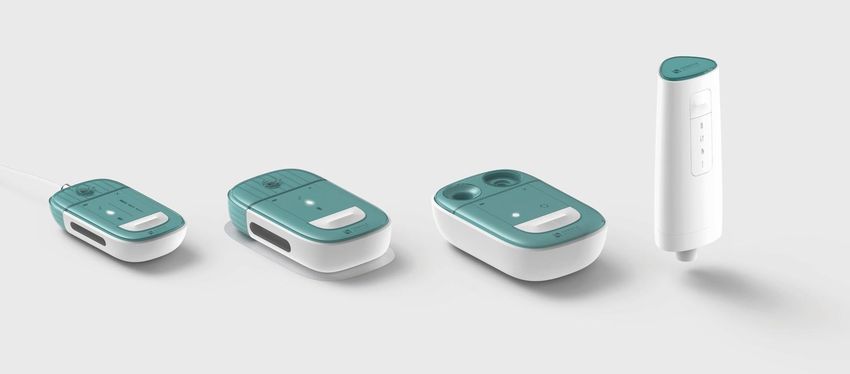
Disposal delivery systems balancing requirements for viscosity
& volumes still considered today as unmet needs in the industry
 DRUG DELIVERY                                    DESCRIPTION                                             BENEFITS
physician
 control
 Under

                                                 Drugs are delivered directly into the vein with a        Fastest way to deliver drugs throughout the
                         IV-line injections
                                                 syringe or an infusion                                   body

                                                                                                          Easy use in emergency situations and home
                                                 Single dosed pack of medication containing a
                         Pre-filled syringes                                                              care setting as well as reduced dosing errors
                                                 pre-measured dose of a drug
                                                                                                          and high sterility

                                                 Cartridge based devices to self-administrate
                                                                                                          Reduced dosing errors and reusability of the
                         Pen-Injectors           hormone-based drugs in multiple repeating doses
   Self-administration

                                                                                                          device over multiple doses
                                                 until the cartridge is empty

                                                 Devices that automatically insert the needle at the
                                                                                                          Easy drug delivery at the correct site and
                         Auto-Injectors          correct site of injection and designed to be used with
                                                                                                          prevention of needle stick injuries
                                                 pre-filled syringes

                                                 Drugs mediated without needles by using high-
                         Needle-free                                                                      Pain free drug delivery and minimization of
                                                 pressure gas or spring-based infection systems that
                         Injectors                                                                        hypodermic injections
                                                 drive drugs through a small orifice into skin

                                                 Portable devices (infusion sets or patch pumps) that
                                                                                                          Subcutaneous administration of large doses
                         Wearable injectors      are attached to the patient's body for a specific
                                                                                                          and viscous biologics
                                                 period of time

July 2018                     Q2 2018 Earnings                                                                                                            8
Q2 2018 Earnings Presentation Accelerating our Journey - Rainer Beaujean, Speaker of the Management Board and CFO July 12, 2018
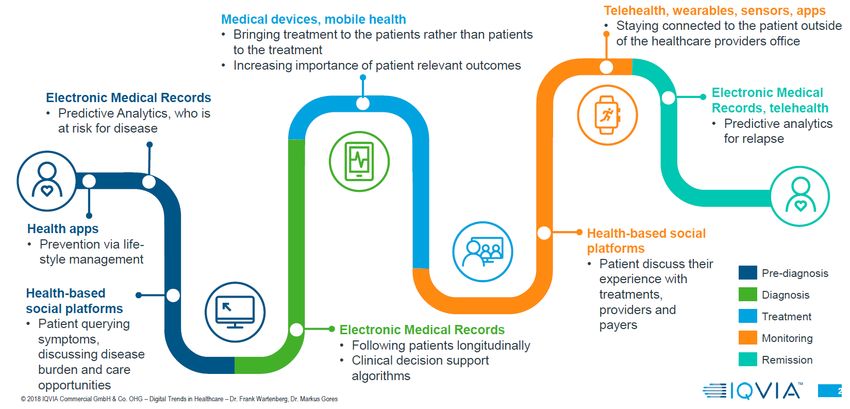
Patch pumps are highly precise drug delivery devices

                                                                                                                     Provide several benefits
                      Can self-administrated by patients over a
                                                                                                                     over traditional self-
                      designated time period
                                                                                                                     administration devices
                                  Reusable

                                                                                                                     Injectable volume

                                                        6

                                                                                                                     Safety precautions
                                                                 Disposable

                                                                                                                     Patient comfort
     1. Primary drug container                               4. Pump
     Drug reservoir which carries the drug from a            A specific technology driven mechanism empowers
     standard vial. Insertion of a cartridge directly (as    the device to pump the drug out of the drug reservoir
     shown here) is feasible as well.
                                                             5. Push button                                          Patient confidence
     2. Needle
                                                             Pushed by the user for automatic needle insertion
     Fully automatic needle insertion and retraction         and drug administration
     mechanism allows a smooth drug delivery into the
     subcutaneous tissue (not shown since at the backside)
                                                             6. Other
     3. Patch                                                                                                        Treatment discretion
                                                             User interface for audible and tactile feedback
     An adhesive lining or patch is essential for the        (LED, screen, alarm system, battery etc)
     injector to get fixed on the patient's skin

July 2018              Q2 2018 Earnings                                                                                                         9
Q2 2018 Earnings Presentation Accelerating our Journey - Rainer Beaujean, Speaker of the Management Board and CFO July 12, 2018
An asset light business model with a focus on revenues
generation through licences and royalties
            Pharma customer                                                                                     CMO Model
             Drug R&D                                       IP and licensing of the technology                   Classical contract manufacturing
             Definition of requirements for                 Adapting device to customers‘                        Delivers to Pharma Customer
             users and products                             specifications
                                                                                                                 Gets orders from Sensile Medical
             Device requirements                            Trading of devices based on fixed
                                                            margins
             Marketing and distribution of
             drugs / medication incl. devices               Quality management
                                                            Securing compliance with regulatory
                                                            requirements

                      Cooperation to gain approval of relevant authorities for the registration of the
                                      device and or the drug/device combination

                                          Orders device                                          Coordinates production

                                                Full price of                                      Production
                                                device
                    Pharma-                                                                        costs
                                                                                                                          CMO
                    customer                    Licences
                                                Royalties
                   Markets device                                 Device development / Quality                       Produces device

                                                                Delivers device to Pharma customer

July 2018         Q2 2018 Earnings                                                                                                                  10
Strong customer relationships and attractive product pipeline
already in place
                                                                                                                                            Global market
  Selected                Lead &
                                          Design phase
                                                                Registration
                                                                 with drug
                                                                               Approved
                                                                                by drug
                                                                                                 Customer
                                                                                                                   Therapeutic area
                                                                                                                                             size, in EUR,       Supplier
                         Feasibility                                                           (if disclosed)                              including value       partners
  examples                                                      authorities    authorities
                                                                                                                                                of drug1

                                                                                             Sanofi                Insulin
  Small volume                                                                                                                             Total Insulin         Zollner
                                                                                             In cooperation with   =>
  patch pump                                                                                                                               market : 34.4bn    Gerresheimer
                                                                                             Verily, an Alphabet   Diabetes Type 2
                                                                                             company

                                                                                                                   Chronic heart failure
                                                                                                                   (CHF)                   Total
                                                                                                                                                                  Zollner
  Large volume                                                                               scPharmaceuticals
                                                                                                                   =>                      Cardiovascular
                                                                                                                                                                 Raumedic
  patch pump                                                                                                       Injectable              market: 74bn
                                                                                                                   (furosemide)
                                                                                                                   Diuretics

                                                                                                                   Nervous system                                   Zollner
  Belt-worn                                                                                  Specialty Pharma      =>
                                                                                                                                           Anti- Parkinson
                                                                                                                                                              Phillips Medisize
  pump                                                                                                                                     drugs: 3.4bn
                                                                                                                   Parkinson

                                                                                                                   Antiinfectives
  Large volume                                                                               Top 25 Pharma         =>
                                                                                                                                           Immunodeficiency      Zollner
  patch pump                                                                                                                               drugs: 6.9bn       Gerresheimer
                                                                                                                   Immunodeficiency

                                                                                                                   Immunology /
  Small volume                                                                               Top 25 Pharma
                                                                                                                   Oncology                Immunostimulant
                                                                                                                                                                    Tbd
  patch pump                                                                                                       =>                      drugs: 8.9bn
                                                                                                                   Immunostimulants

 1. Source: IQVIA (IMS) Health Data '13-'17; company analysis

July 2018          Q2 2018 Earnings                                                                                                                                               11
Earlier involvement in customers’ pipeline provides new
opportunities and shapes business model for Gerresheimer
                                                                                         up to 3 years
  Gerresheimer positioning in Pharma value chain                                    before commercial launch

                                                                                             Tool revenues                     Parts revenues
                                                                                                          Prototype &
                                                                     Design                                                       Parts
                Pharma              Pharma                                                              industrialisation
   Pharma                                                                                                                      Production
                 Drug                 Drug
  Research                                                                                                                     & life cycle
              development          Production                                         Design                   Registration
                                                Design lead and      Design input                    Pilots                   management
                                                feasibility (test)    & output      development                & Approval

                                                                       Development revenues                                    Parts revenues
                                                                                                                                        +
                                                up to 6 years
+ Sensile Medical                               before commercial launch                                                           Royalties

                                                                                                                 COMMERCIAL LAUNCH

   NEW BUSINESS MODEL AND APPROACH                   NEW OPPORTUNITIES FOR CMO BUSINESS                  BUT
   Multi faceted contract revenue model based        Opportunity to source future device                 Early exposure to drug pipeline also implies
   on reusable and disposable device sale and        production in-house and increase capacity           greater link with registration &
   royalty payment on drug net sale                  utilisation in contract manufacturing, but is       commercialization successes and timeline
                                                     not a must                                          and hence higher variability of revenues

July 2018       Q2 2018 Earnings                                                                                                                        12
Modelling assumptions Sensile Medical

   PRELIMINARY TARGETS

   Revenues and Adj. EBITA                                                            Other modelling considerations
   Assuming all milestones achieved with all key projects:
                                                                                     No material tangible assets on the balance sheet
   EUR m                                      FY 20181 FY 2020 FY 2022 FY 2027
                                                                                     NWC ~5% of sales long term
    Revenues                                     ~ 15     ~ 100   ~ 200   ~ 400      Nearly no capex and depreciation
                                                                                     Patents secured beyond 2030
    - Of which development2                       ~13     ~ 40     ~10     -.
                                                                                     Pre PPA assumes
    - Of which parts                              ~2      ~ 55    ~ 160   ~ 340          — Almost no goodwill
                                                                                         — Fair Value Amortization of acquired
    - Of which royalties                            -      ~5     ~ 30    ~ 60
                                                                                             Technology of EUR 25m per year, starting
    Adj. EBITA                                   ~ -2     ~ 10    ~ 25    ~ 90               FY 2018
                                                                                         — Sensile Medical’s tax rate expected to be at
    These numbers are only based on current contracted projects
                                                                                             around 10% for the next 8 years
    Sensile Medical and Gerresheimer management will continue to work
     on other leads, which in turn should further fuel the revenues pipeline
     and hence bring additional development revenues in the first instance

1. Expected for H2 2018 (July – November)
2. Only relating to current ongoing contracted projects

July 2018            Q2 2018 Earnings                                                                                                     13
Cash out schedule based on achievement of specific milestones

                               EARN OUT MODEL                        FINANCING STRUCTURE

                                                      EUR m
              Maximum consideration:                  350         Consideration to be exclusively financed
                                                                  through drawing of existing Revolving
            Initial payment at Closing (Q3/18)        175
                                                                  Credit Facility and use of cash at hands
            2nd. Payment in Dec. 2018                 25
            4 Tranches @ 18.75 in June/July 2019      75 max.
            1 Tranche early 2020                      37.5 max.
            1 Tranche early 2021                      37.5 max.

              Tranches are based on the achievement of
              specific milestones regarding the main
              customer projects, e.g. regulatory approvals

July 2018          Q2 2018 Earnings                                                                          14
Transaction summary: Closing expected for July 17, 2018

   Total consideration              Initial payment of EUR 175m
  for 100% of company               Up to EUR 175m consideration mainly subject to achievement of defined milestones over the next 3 years.

                                    The acquisition will be fully cash and debt funded out of our existing RCF
                                    Increase in adjusted Leverage above 3.0x at closing
            Financing
                                    Committed to Investment grade profile in the long term with 2.5x as appropriate aspiration for our net financial
                                    debt to adjusted EBITDA ratio

                                    Contracted leading strategy consulting firm conducted market research and assessed competitive positioning
                                    Led in-depth customer discussions to sense-check business case assumptions
                                    Confirmed existing patent protection through the support of specialised patent law firm beyond 2025 and notice of
       Due diligence &              allowance for pending patent protection received up to 2034 and verified “freedom to operate”
      Approval process              Obtained fairness opinion from renowned independent auditors
                                    Key management to stay on board until at least 2023
                                    No regulatory approval necessary

                                    Closing expected for July 17, 2018
                                    Sensile Medical to be reported as separate Division, alongside Plastics & Devices and Primary Packaging Glass
    Anticipated closing             Pre PPA anticipates almost no goodwill. Estimated Fair Value Amortization of acquired Technology of EUR 25m
                                    per year for a period of 15 years, starting 2018.
                                    Sensile Medical’s tax rate expected to be at around 10% for the next 8 years

July 2018        Q2 2018 Earnings                                                                                                                       15
Digital Health now impacts the entire patient journey

                                    New: Sensile

July 2018   Q2 2018 Earnings                            16
Through Sensile Medical, Gerresheimer is radically enhancing
its business approach towards Pharma and Biotech/Biosimilar
                                     Becoming a partner of choice for both Pharma & Biotech/Biosimilars
                                 with competencies in electronic/connected devices as major long-term lever

    Customer Groups                                                                       Biotech/Biosimilar Companies                Flow measurement
                                          Large Pharma & Generics
    End markets
    Applications
                                          Chronic Diseases                      +         Other therapeutic areas
                                                                                          Precision injections
                                                                                                                               +      Data gathering
                                                                                                                                      Data management

                                                                                     + OEM / ODM & electronics                     + Connected

                                                                                                               NEW MODEL

                           Plastics   players1
                                                 CURRENT BUSINESS
                                                                                      Plastics &
                                                                                     electronics” players1
                                                                                                                     +             Connected
                          include:                                                   include:                                      partners1 to include”:
                             Ypsomed                                                   Ypsomed             Sensile Medical        R&D teams
                             West Pharma          Gerresheimer                                                                     Universities
                                                                                        West Pharma
                             Consort Medical                                           Insulet               OEM / ODM3           Verily, an alphabet
                             Aptar                CMO / CDMO2                                                                       company
                                                                                        Jabil
                             Nemera
                                                      business                          Flextronics               business         Etc.
                             Etc.                                                      Etc.

            Today                                                        +                             ~ 5 Years                                    ~ 10 Years
1. Listed companies illustrative
2. CMO / CDMO: Contract Manufacturer Operation, Contract Manufacturer & Development (Design) And Operation
3. OEM / ODM: Original Equipment and Development / Design Manufacturer
July 2018           Q2 2018 Earnings                                                                                                                             17
Recent operational developments
Two significant customer contracts awarded

                                                            First time ever to become main
              Confirming #1 position in Inhalation             Syringe supplier to large
                                                                    Pharma customer

                Track record in Inhalation                 Continuing systematic execution
                rewarded                                   of our Syringes strategy

                New contract won in Europe with existing   New long-term contract won with existing
                customer                                   customer, one of the two main heparine /
                                                           vaccines companies in the world

July 2018   Q2 2018 Earnings                                                                          19
Expecting superior organic revenues growth and profitability in
the mid term1

                               Assessing for the mid term :                Assessing for the mid term :
                               DELTA IMPACT ON REVENUES                    DELTA IMPACT ON PROFITABILITY

                   Anticipating superior organic growth …            … Leading to improved operating leverage

                        Estimated FXN revenues growth delta upside       Estimated delta adj. EBITDA margin upside
                                       2021 & 2022                                      2021 & 2022
                                Compared with 2019 & 2020                       Compared with 2019 & 2020

                                       ~ + 2 Percentage points                   ~ + 2 Percentage points

1. Excluding Sensile Medical

July 2018           Q2 2018 Earnings                                                                                 20
Growth facilitated by additional capex and ramp-up investment
in the short term1

                           Assessing for the short term :                                                 Assessing for the short term :
                                 DELTA IMPACT ON CAPEX                                                    DELTA IMPACT ON PROFITABILITY

                                 Growth capex required                                                         Ramp up costs expected

                                  Estimated Capex delta                                                  Estimated margin impact 2019 & 2020
                                      for 2019 & 2020
                              Compared to historic levels of 8%
                                                                                                              ~ 1 Percentage point decline3
                                                                   + ~2
                    Immediate capacity
                    expansion (new projects)                       Percentage
                                                                   points                          Short term increase in low margin tooling revenues
                                                                                                   Additional training and hires required
                                                                   + ~2
                    Additional capex need
                                                                   Percentage                      Ramp up costs due to inefficiencies at project start
                    (pending)2
                                                                   points

                    Pending:
                     Evaluating decision to build a new plant
                     Automation upgrades

1. Excluding Sensile Medical
2. This will be finalized at the end of the year alongside our next strategic plan and communicated to the markets in February 2019 (release of FY 2018 earnings)
3. Compared with the figure for the financial year 2017, excluding the effect from fair value measurement of the Triveni put option.
July 2018            Q2 2018 Earnings                                                                                                                               21
Adapting our manufacturing footprint in Medical Devices and
Systems to new customer requirements
                                     Growth projects                                            Footprint reorganisation

              INHALATION:                           SYRINGES SYSTEMS:                                     INHALATION:
              Horsovsky Tyn                                 Buende                                         Küssnacht
              (Czech Republic)                             (Germany)                                       (Switzerland)

    Peak revenues: ~EUR 30m                   Peak revenues: ~EUR 20m                    Customer informed us that they won’t be
                                                                                            placing any further orders. Negotiations
    First parts revenues expected for         First revenues expected 2019
                                                                                            about compensation based on supply
     Q4 /2020                                  Currently assessing capacity                contract started immediately.
    Requires immediate capacity                availability in Bünde with regards to
                                                                                           Lost contribution expected to recouped
     extension, training of personal and        new heparine / vaccine contract
                                                                                            for FY 2018 via claimed compensation
     extra tooling volume                       won and expected increase in
                                                biosimilar / biotech volumes               Mid size contract, recurring revenues
                                                                                            were approx. EUR 15.0m (on a full year
                                                                                            basis)

            Immediate capacity expansion ground work required by newly                  Partial restructuring of the facility already initiated
            awarded projects
                                                                                        Foreseeing full closure until end of FY 2019 once all
            Evaluating decision to build a new MDS (medical devices and                 other projects have been relocated to other plants
            syringe systems) production facility in Eastern Europe
                                                                                        All booked as exceptional items

July 2018         Q2 2018 Earnings                                                                                                                22
Q2 2018 financials & FY 2018 outlook
FY 2018 FXN revenues guidance narrowed to the upper end
parameters
                                       Strict monitoring of all business and macro drivers

   Markets & Macro                                           Operations                                     FY 2018 Guidance1
     Overall, current assessment on Pharma                    Modest growth in Q2, driven by US              FY 2018 FXN2 revenues guidance
     and Healthcare customers and market                      injectable recovery                            narrowed to the upper end parameters
     trends unchanged                                         Primary packaging business as a whole          Currently expecting FY FXN1 2018
     USD / EUR translation impact remains a                   (glass and plastics) performing alongside      revenues to land between EUR 1.38bn to
     headwind                                                 expectations                                   approx. EUR 1.4bn
     Uncertainty continues to prevail                         Syringes systems on track                      Range for adjusted EBITDA at constant
     regarding NAFTA (US import taxes)                        Unfavourable customer dynamics for the         exchange rate unchanged for FY 2018 at
                                                              device business in Europe continue to be       EUR 305m to EUR 315m
     Changes in US Healthcare less likely in
     FY 2018 but reforms could be considered                  a drag in particular for Inhalation, whilst    Other guidance parameters unchanged
     again in 2019                                            Peachtree is further ramping up                for FY 2018
                                                              Confirming higher YoY FXN1 revenues
                                                              growth in H2

1. Excluding Sensile Medical
2. At const. average FX rates of EUR 1.00 = USD 1.12, based on FY 2017 reported numbers

July 2018          Q2 2018 Earnings                                                                                                                   24
Q2 saw encouraging trends in Primary Packaging Glass

                                                                                 GROUP

                         Plastics & Devices                                        +2.1%                            Primary Packaging Glass
                                     + 1.3%                                                 343.0
                                                                           335.8                                                    3.1%

                            183.8             186.2
                                                                                                                           152.0            156.8

                                                                          2017              2018
                             2017               2018                                                                        2017             2018

             Performance achieved in Q2 2018                        Performance achieved in Q2 2018            Performance achieved in Q2 2018
             + EUR 2.4m YoY                                         + EUR 7.2m                                 + EUR 4.8m YoY

            P&D: Q2 2018 performance review                                                                    PPG: Q2 2018 performance review
            — Solid performance in Syringes and Plastic Packaging                                              — US injectable business with good recovery
            Inhalation                                                                                         — Strong growth in China
                                                                    FXN1 REVENUES IN Q2 18                     — Satisfying growth in Cosmetics
            — Peachtree revenues continue to perform well
            — Lower demand from a few device customers                VS Q2 17, IN EUR M
              where we are single source supplier
            — Contract termination
            — Tooling revenues lower YoY
1. Average budgeted exchange rate assumption for FXN guidance 2018: Average currencies for FY 2017 (e.g. EUR 1.00 = USD 1.12)

July 2018           Q2 2018 Earnings                                                                                                                         25
FXN adj. EBITDA stable YoY, supported by an overall good
performance in Primary Packaging Glass
                                                                                      GROUP

                         Plastics & Devices                                             +0.1%                             Primary Packaging Glass
                                                                                                          2
                                       - 4.3%                                  74.9                75.0                                    +7.3%
                                                                                                              EUR
                             49.7               47.5 2                                                        1.1m

                                                         EUR                                                                       31.1              33.4
                                                         1.1m

                                                                                2017              2018
                            2017                2018                                                                               2017              2018

              Performance achieved in Q2 2018                         Performance achieved in Q2 2018                Performance achieved in Q2 2018
              - EUR 2.2m YoY2                                         + EUR 0.1m2                                    + EUR 2.3m YoY

            P&D: Q2 2018 performance review
                                                                                                                     PPG: Q2 2018 performance review
            Inhalation
                                                                                                                        — Higher utilisation rate in US PPG
            — Peachtree margin still in ramp up phase
                                                                                                                        — Stable performance overall for European and
            — Lower demand from a few device customers                       1 ADJUSTED EBITDA IN
               where we are single source supplier continues to
                                                                        FXN                                               Asian business

               impact capacity utilisation                              Q2 18 VS Q2 17, IN EUR M
            — Initial compensation of EUR 4.8m recorded as a
               consequence of contract termination partially
               compensates for lower business activity
            — Tooling revenues lower YoY
1. Average budgeted exchange rate assumption for FXN guidance 2018: Average currencies for FY 2017 (e.g. EUR 1.00 = USD 1.12)
2. Excluding expense from the fair value evaluation of the Triveni Polymers Private Ltd. put option in Q2 2018 in the amount of EUR 1.1m

July 2018           Q2 2018 Earnings                                                                                                                                    26
FX-Impact of EUR 14.1m on Q2 2018 Revenues and EUR 3.7m on
Adjusted EBITDA
Group Q2 2018 review
  EUR M                                                   Q2 2018                             Q2 2017                          Change in %

  Revenues                                                  332.6                               339.5                                -2.0
  - of which FX effect                                      -10.4                                3.7                                 N.A.
  Adj. EBITDA                                               71.11                               75.8                                 -6.1
  - of which FX effect                                       -2.8                                -0.9                                N.A.
  - Adj. EBITDA margin %                                    21.41                               22.3                               -90bps

P&D Q2 2018 review                                                                            PPG Q2 2018 review
                                                                               Change                                                                           Change
  EUR M                                        Q2 2018         Q2 2017                         EUR M                                        Q2 2018   Q2 2017
                                                                                in %                                                                             in %

  Revenues                                        179.7          185.8           -3.3          Revenues                                      153.0     153.7     -0.5
  Adj. EBITDA                                    44.51              50.2        -11.4          Adj. EBITDA                                   32.6      31.4      +3.8
  - Adj. EBITDA margin %                         24.71              27.0       -230bps         - Adj. EBITDA margin %                        21.3      20.4     +90bps

1. Including expense from the fair value evaluation of the Triveni Polymers Private Ltd. put option in Q2 2018 in the amount of EUR 1.1m.

July 2018            Q2 2018 Earnings                                                                                                                                   27
Decrease in Adjusted EBITDA and slight increase in depreciation
as main drivers for Adjusted Net Income variation
 EUR M                                                           Q2 2018   Q2 2017   CHANGE in EUR

 Adjusted EBITDA                                                  71.1      75.8          -4.7
 Depreciation                                                     -25.41    -22.8         -2.6
 Adjusted EBITA                                                   45.7      53.0          -7.3
 Total one-off items                                               -1.0     -0.5          -0.5
 Amortization of fair value adjustments                            -7.6     -8.6         +1.0
 Results of operations                                            37.1      43.9          -6.8
 Net finance expense                                               -9.4     -8.6          -0.8
 Net income before income taxes                                   27.7      35.3          -7.6
 Income taxes                                                      -8.4     -10.2        +1.8
 Net income                                                       19.3      25.1          -5.8

 Net income                                                       19.3      25.1          -5.8
 Total one-off items (including amortization and tax effects)      7.2       5.9         +1.3
 Adjusted net income                                              26.5      31.0          -4.5
 Adjusted net income attributable to non-controlling interests     0.5       0.6          -0.1
 Adjusted net income after non-controlling interests              26.0      30.4          -4.4
 Adjusted EPS after non-controlling interests in EUR              0.83      0.97         -0.14
1. Includes EUR 1.8m impairment losses

July 2018          Q2 2018 Earnings                                                                  28
Dividend and last bond interest payments close to EUR 50m
impact on net debt in Q2 2018
  EUR M                                                  MAY 31, 2018             NOV 30, 2017                MAY 31, 2017        CHANGE IN %2
  Total assets                                               2,244.6                  2,444.1                    2,289.3             - 8.2%
  Equity                                                      822.9                    789.5                      752.0              +4.2%
  Equity ratio                                               36.7%                    32.3%                      32.9%              +440bps
  Net working capital                                         242.0                    185.7                      230.4             +30.3%
  NWC in % of LTM revenues                                   18.2%                    13.8%                      17.1%              +440bps
  Average NWC in % of LTM revenues                           16.9%                    16.5%                      16.4%               +40bps

  EUR M                                                           H1 2018                           H1 2017                     CHANGE IN %
  Operating Cash Flow                                               40.8                               68.6                       -40.5%
  Operating CF1 in % of revenues1                                   6.7%                              10.7%                       -400bps
  Capex1 in % of revenues1                                          4.1%                              5.5%                        -140bps

  EUR M                                                       MAY 31, 2018                       NOV 30, 2017                   CHANGE IN %
 Net financial debt                                                773.7                              712.7                        +8.6%
 Adjusted EBITDA leverage (x)                                       2.6x                               2.3x                        +0.3x

1. Average budgeted exchange rate assumption for FXN Guidance 2018: Average currencies for FY 2017 (e.g. EUR 1.00 = USD 1.12)
2. Change May 31, 2018 vs Nov 30, 2017

July 2018          Q2 2018 Earnings                                                                                                              29
FY 2018 FXN revenues guidance narrowed to the upper end
parameters, other metrics unchanged

 Organic (excluding Sensile Medical) and FXN:

   2018 GUIDANCE                               PREVIOUS EXPECTED RANGE                                     NEW EXPECTED RANGE
   Revenues                                    EUR 1.348bn to approx. EUR 1.4bn (FXN1)                     EUR 1.38bn to approx. EUR 1.4bn (FXN1)
   Adj. EBITDA                                 EUR 305m to approx. EUR 315m (FXN1)                         UNCHANGED
   Capex (% FXN sales)                         ~8% (FXN1,2)                                                UNCHANGED

  Wider financial framework including Sensile Medical:
   KEY METRICS                                                                                            POLICY

   Adjusted EBITDA leverage (x)                                                                           2.5x

   Dividend payout as % of Adj. NI after non-controlling interests                                        20% to 30%

   Gx ROCE                                                                                                ~ 15%

1. Average budgeted exchange rate assumption for FXN Guidance 2018: Average currencies for FY 2017 (e.g. EUR 1.00 = USD 1.12)
2. Excluding capital expenditure on intangible assets in relation to licensing agreements

July 2018          Q2 2018 Earnings                                                                                                                 30
Conclusion
Gerresheimer enhances business model and increases revenues
projections

                                  Strategic enhancement of our business model through the acquisition of Sensile
                                  Medical
                                  Gerresheimer now positioned as platform partner for Pharma and
       Sensile Medical            Biotech/Biosimilars customers with digital & electronic solutions

                                  New projects won with Inhalation and Heparine/Vaccines customers, translating
                                  into superior organic revenues growth and profitability in 2021 & 2022
                                  Launch of new projects requires footprint reorganisation to accommodate future
       Growth Projects            volumes, necessitating higher capex spend in 2019 & 2020

                                  Confirming higher growth expectations for H2 2018 year-on-year

                                  FY 2018 FXN revenues guidance narrowed to the upper end parameters
        2018 Guidance

July 2018      Q2 2018 Earnings                                                                                    32
Appendix / Q&As
The Sensile Medical opportunity

                   Established drug delivery market leader targeting large disease states through blue-chip
                   biopharma partnerships

                   Unique SenseCore technology platform for safe and reliable drug delivery

                   Highly versatile and cost efficient technology with significant economic advantages

                   Uniquely positioned for high impact across the entire healthcare continuum

                   Multiple product platforms and contracted partner products

                   Asset-light, highly leverageable manufacturing and commercial model

July 2018   Q2 2018 Earnings                                                                                  34
Developing our business model beyond our current setup:
Adding Sensile Medical as separate Division going forward

   Plastics & Devices                     Primary Packaging Glass              New Division
                                                                           Incl. Sensile Medical

        Contract Design Manufacturing
        Medical Devices (incl. tooling)        Moulded Glass Pharma
                                                                         Technology & Platform operator

                                              Moulded Glass Cosmetics
            Primary Packaging Plastics
                                                  (incl. Beverages)
                                                                              Own R&D capabilities

              Prescription Business            Tubular Glass Pharma
                  (Centor, US)                     (Converting)          Partnering with customers much
                                                                          earlier at the beginning of the
                                                                               development phase

                Syringes Systems
                                                                        Entering into a new business model
                                                                         based on IP licensing & royalties

July 2018           Q2 2018 Earnings                                                                         35
Sensile Medical is uniquely positioned for high impact across
the entire healthcare continuum
                 Cost efficient                        Precise                       Secure                               Scalable                          Flexible

 Accuracy of volumes                                                                                                                        Connectivity
 administered                           +      Costs                                 +      Patient convenience                      +      enhancements
     Increased drug regimen                        As cost effective as other                   Simple, intuitive and patient               Diabetes case study:
     adherence and better disease                  solutions (pens or infusion                  friendly patch pump for
     management                                                                                                                                 Connected to diabetes
                                                   pumps)                                       continuous drug delivery                        management system
     Greater flexibility as to where               Some device parts are re-usable              Increased patient safety and
     and by whom drug can be                                                                                                                    Treatment data readily available
                                                   Significant lower treatment                  comfort                                         increasing patient engagement
     administered
                                                   burden, prevented extended                   Better health outcome
     Doctor can place device and                                                                                                                Better health outcome
                                                   stay in healthcare setting
     program administration of                                                                  Improved quality of life                        Improved quality of life
                                                       Or hospitalization for the
     patient to avoid any risk of                      administration of diuretics
     misuse and dosing errors                          (Chronic Heart Failure CHF)
                                            Example of standard care for CHF
 Example small volume                                                                    Example large volume patch pump                 Example Belt worn pump solution
 patch pump
                                                                                          Adheres to the skin and has an                 Drug detection via RFID1 and option
  Extended delivery time over                                                             integrated auto-inserter for the needle         for data download
   several hours up to 3 days               DURATION
                                                                                          Fully automated needle insertion and
  Highly accurate small volumes                                                           retraction.
                                            Example of Sensile advantage for CHF
  Variable and pre-programmed
   dosing administration

                                            DURATION

July 2018            Q2 2018 Earnings                                                                                                                                            36
Gerresheimer is operating in large and attractive markets

                                                                                                         Drug
                                                  Cosmetics        Pharma        Pharma
                                                                                           Syringes     Delivery
                                                    Glass          Glass1        Plastic
                                                                                                        Devices

             Estimated Market
                   Size 20173                      ~ 1.8           ~ 2.2         ~ 5.8     ~ 0.9         ~ 4.0
                      (in € bn)

        Market CAGR '17-’22²)
                                                              LOW SINGLE DIGIT               MID SINGLE DIGIT
                      (in %)

                       The strategic relevant core market for Gerresheimer is today ~ € 15bn

1. Tubular Glass + Moulded Glass Pharma
2. Strategic relevant markets, Gerresheimer estimates

July 2018           Q2 2018 Earnings                                                                               37
Negative translation effects of EUR -14.1 m, due to continued
USD currency headwind
                                             Group: Revenues Q2 2018 vs. Q2 2017 (EUR m)
                                                               Growth in % as reported: -2.0%

                                                                 FXN Growth in % : +2.1%

343
                                                                            + 4.8
                                                                +2.4                       -                343.0            -10.4
             339.5
                              - 3.7
333                                             335.8
                                                                                                                                              332.6

323

313
          Q2 2017        Currency Impact       Q2 2017          Δ P&D       Δ PPG    Δ Internal Sales       Q2 2018       Currency Impact    Q2 2018
         as reported                       at budget fx rate                                            at budget fx rate                   as reported

             @1.08                              @1.12                                                        @1.12                            @1.21
        Average EUR / USD exchange rate

 July 2018           Q2 2018 Earnings                                                                                                                     38
Development of net working capital

                                    MAY 31, 2018   NOV 30, 2017   MAY 31, 2017
                                      EUR M          EUR M          EUR M
 Inventories                           180.7          148.4          172.5
    thereof prepayments made            4.9            2.1            2.5
 Trade receivables                     224.3          242.7          222.9
 Trade payables                        131.6          176.3          126.7
 Payments received                     31.4            29.1          38.3
 Net working capital                   242.0          185.7          230.4

 Average NWC in % of LTM revenues      16.9%          16.5%          16.4%

July 2018      Q2 2018 Earnings                                                  39
Development of inventories

                                           MAY 31, 2018   NOV 30, 2017   MAY 31, 2017
                                             EUR M          EUR M          EUR M
 Raw materials, consumables and supplies      56.1            49.9          51.0
 Work in progress                             17.5            15.0          20.1
 Finished goods and merchandise               102.2           81.4          98.9
 Prepayments made                              4.9            2.1            2.5
 Inventories                                  180.7          148.4          172.5

July 2018      Q2 2018 Earnings                                                         40
Technical guidance: EPS
                                                                                     ESTIMATED IMPLICATIONS ON MODELLING
            TOPIC                   STATUS QUO

  +
                                                                                     FOR FY 2018 and FY 2019

                                      US tax reform, the Tax Cuts and Jobs             Positive one-off effect for the financial year 2018
                                      Act passed on December 22, 2017                  of USD 52.9m recognized in the first quarter of
            Revaluation of            Triggered a.o. immediate revaluation of          2018
    1       deferred tax assets
            and liabilities
                                      all deferred tax assets and liabilities on
                                      US Companies.
                                                                                       Non-cash item

                                                                                                                                             Positive
                                      US tax reform, the Tax Cuts and Jobs
            Reduced corporate         Act passed on December 22, 2017                  Lower federal tax rate expected from FY 2018          effect
    2       tax rate                  Includes US Federal Corporate Tax rate
                                      cut from 35% down to 21% as well as
                                                                                       onwards
                                                                                       Had the impact of the US tax reform already
                                                                                                                                             expected on
                                      elimination of certain previously available      applied in the financial year 2017, there would       adjusted
                                      deductions from taxable income. There            have been a positive effect on current income
                                      are also additional restrictions to the tax-     taxes and our net income for 2017 in a low
                                                                                                                                             EPS after
                                      deductibility of certain expenses                single digit million Euro amount                      non-
                                      Applicable from Jan 1, 2018 onwards
                                                                                                                                             controlling
            Impact of new                                                              ~ EUR 5.5m estimated savings in H2 2018 on            interest
                                      EUR 300m bond maturing on May 19,                net finance expense compared to FY 2017
    3       financing structure
            from H2 2018 onwards      2018 has been redeemed                           Total of ~ EUR11m estimated savings in FY
            when Bond is                                                               2019 net finance expense compared to FY 2017
            redeemed

   –        Negotiations have
            begun in the USA with
            regard to the North
                                      This could possibly result in tariffs on
                                      certain imports and exports between the
                                      USA and other North American countries
                                                                                       In the financial year 2017, our Mexican
                                                                                       subsidiary’s exports to the USA were
                                                                                       approximately EUR 27m. The effects of the             ?
    4       American Free
                                      The outcome of changes to NAFTA                  NAFTA negotiations are not currently                  Discussions
                                      could have a negative impact on our              quantifiable because precise information is
            Trade Agreement           Mexican subsidiary’s exports to the USA          lacking.                                              ongoing
            (NAFTA)                   and hence on our net income                      We will continue to track the potential impacts

July 2018       Q2 2018 Earnings                                                                                                                           41
GXI Key Data

 in EUR per share                      2008        2009          2010           2011          2012         2013    2014    2015    2016    2017
 Dividend                              0.40           –           0.50          0.60           0.65        0.70    0.75    0.85    1.05    1.10
 Dividend yield                        1.5%           –          1.8%           1.9%          1.7%         1.4%    1.7%    1.2%    1.5%    1.6%
 Payout ratio                          22%            –           26%           25%           25%1         23%     26%     25%     25%     27%
 Share price high                      38.20       27.05         29.85          36.62         41.34        50.14   56.42   76.32   76.86   78.01
 Share price low                       23.99       13.24         22.09          28.30         31.00        37.60   42.31   41.99   57.10   61.03
 Share price at FY end                 27.10       23.05         28.20          31.17         39.41        49.67   44.44   73.90   68.85   67.06
 Book value per share                  15.26       15.29         16.86          17.59         17.14        17.94   19.25   22.23   24.31   25.14
 P/E ratio2                            14.81       17.20         14.46          12.77         15.041       16.13   15.38   21.67   16.31   16.51
 Market cap in EUR m                   851          724           886            979          1,238        1,560   1,395   2,320   2,162   2,106
 MDAX weighting year end           11.48%3        1.33%          1.24%         1.40%          1.47%        1.33%   1.01%   1.42%   1.33%   1.00%
 Number of shares in
                                       31.4        31.4           31.4          31.4           31.4        31.4    31.4    31.4    31.4    31.4
 million

1. Retrospective restatement due to the early adoption of IAS 19 (amended in 2011) from December 1, 2012
2. Based on adj. EPS after non-controlling interests
3. SDAX weighting at year end

July 2018           Q2 2018 Earnings                                                                                                               42
Overview of Abbreviations and Definitions

ABBREVIATIONS AND DEFINITIONS

Adj. EBITDA             Earnings before income taxes, net finance expense, amortization of fair value adjustments, depreciation and amortization, impairment losses, restructuring
                        expenses and one-off income and expenses
Adjusted EPS        Adjusted net income divided by 31.4m shares
Adjusted net income Consolidated net income before non-cash amortization of fair value adjustments, restructuring expenses, impairment losses, one-off income and expenses
                    (including non-cash expenses) and the related tax effects.
CAGR                Compound Annual Growth Rate
Capex                   Investments in tangible and intangible assets
EBIT                    Earnings before interest and taxes
EBITA                   Earnings before interests, taxes and amortization
EBITDA                  Earnings before interests, taxes and depreciation and amortization
FXN                     "Foreign currency neutral" - based on budgeted FX-rates
Gx ROCE                 Adjusted EBITA divided by capital employed (total assets minus investments, investments accounted for using the equity method and other loans, minus
                        cash and cash equivalents, minus pensions (without pension provisions), deferred tax liabilities, and income tax liabilities, minus prepayments received,
                        trade payables, and other non- interest bearing liabilities)
Gx RONOA                The ratio of adjusted EBITA to average net operating assets, comprising the sum of property, plant and equipment and net working capital
Leverage                The relation of net financial debt to adjusted EBITDA of the preceding twelve months, according to the current credit facility agreement.
Net debt                Short and long term debt minus cash and cash equivalents
Net finance expense     Interest income and expenses and related to the net financial debt of the Gerresheimer Group. It also includes net interest expenses for pension provisions
                        together with exchange rate effects from financing activities and from related derivative hedges.
Net working capial
(NWC)                   Inventories plus trade receivables minus trade payables plus/minus prepayments

Op. CF margin       Adjusted EBITDA plus/minus the change in net working capital, minus capex and in relation to revenues
Operating cash Flow Adjusted EBITDA plus/minus change in net working capital, minus capex
P/E Ratio           Company's share price divided by the adj. EPS after non-controlling interests
RCF                     Revolving credit facility
yoy                     year-on-year

July 2018            Q2 2018 Earnings                                                                                                                                                 43
Financial calendar and contact details
 FINANCIAL CALENDAR

 October 11, 2018                 Interim Report 3rd Quarter 2018

  CONTACT DETAILS
  Name                            Corporate Investor Relations

  Phone                           +49 211 6181 257
  Fax                             +49 211 6181 121
  E-mail                          Gerresheimer.ir@gerresheimer.com
  IR website                      www.gerresheimer.com/ir

July 2018      Q2 2018 Earnings                                      44
Our Vision
Gerresheimer will become the leading global partner
for enabling solutions that improve health and well-being.
Our success is driven by the passion of our people.
You can also read