OCEAN FREIGHT MARKET UPDATE - July 2018
←
→
Page content transcription
If your browser does not render page correctly, please read the page content below
PUBLIC

DHL Global Forwarding, Freight

OCEAN FREIGHT
MARKET UPDATE
July 2018

                                      1
PUBLIC

Contents

    TOPIC OF THE MONTH
    Rate increases due to higher bunker costs

    HIGH LEVEL DEVELOPMENT

    MARKET OUTLOOK
    Freight Rates and Volume Development

    ECONOMIC OUTLOOK & DEMAND DEVELOPMENT

    CAPACITY DEVELOPMENT

    CARRIERS

    REGULATIONS

    DID YOU KNOW?
?   New tariff measures between China and the US effective 6 July 2018

                                                                         DHL Global Forwarding | OFR Market Update | July 2018        2
Topic of the Month
Rate increases due to higher bunker costs
  Carriers are trying very hard to push through the rate increase
                                                                                                                                                            Following very disappointing Q1 results and a negative outlook for the
                                                                                                                                                            year many carriers are implementing substantial rate increases.
            BUNKER PRICE INDEX                                                                                                                              Various terminologies are being used to describe the surcharges:
                                                                                                                                                            EBAF (Emergency Bunker Adjustment Factor)
            1,000                                                                                                                                           EBS (Emergency Bunker Surcharge)
                                                                                                                                                            EFL (Emergency Fuel Charge)
               800                                                                                                                                          FAF (Fuel Adjustment Factor)
                                                                                                                                                            OCR (Operations Cost Recovery)
               600                                                                                                                                          PSS (Peak Season Surcharge)

               400                                                                                                                                          The carriers explain their actions by increased bunker costs.
                                                                                                                                                            Unfortunately there is no consistent approach applied by the carriers and
                                                                                                    BIX 380                                                 across the trades.
               200
                                                                                                    BIX MGO
                                                                                                                                                            DGF is in constant dialogue with its partner carriers and doing its utmost to
                   0                                                                                                                                        mitigate the impact for the customers and the business. However DGF
                       Q1 Q2 Q3 Q4 Q1 Q2 Q3 Q4 Q1 Q2 Q3 Q4 Q1 Q2                                                                                            expects that margins will be affected. Agreements with carriers and
                       15          16          17          18                                                                                               customers will need to be reviewed.

                                                                                                                                                            Given the development the industry needs to be prepared for floating
                                                                                                                                                            BAF agreements going forward.

Source: DHL; Bunker Index, in USD/metric ton, Bunker Index MGO (BIX MGO) = avg. Global Bunker Price for marine gasoil (MGO) port prices; (BIX 380= avg. Global Bunker Price for all 380 centistoke (cSt) port prices; both index published on the Bunker Index website

                                                                                                                                                                                       DHL Global Forwarding | OFR Market Update | July 2018                             3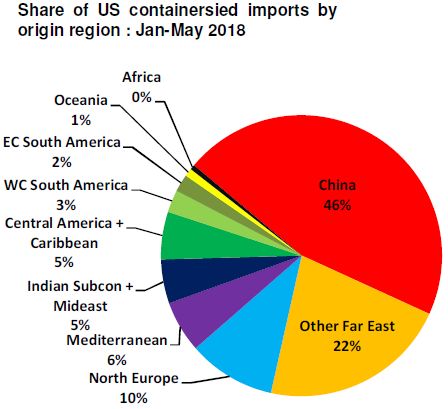
PUBLIC
High Level Market Development – Supply and Demand
ECONOMIC OUTLOOK GDP GROWTH BY REGION1) DHL TRADE BAROMETER6) SUPPLY/DEMAND GROWTH (ANNUALIZED), IN % 2)
CAGR
2018F 2019F 2020F 2021F 2022F 80 9%
(2019-22) Supply
8% Growth %
EURO 2.2% 2.0% 1.9% 1.8% 1.8% 1.8% 70 7%
6%
MEA 3.5% 3.8% 3.9% 3.6% 3.5% 3.7% 60 5%
4% Demand
AMER 2.7% 2.8% 2.2% 1.9% 1.9% 2.0% 50 Growth
3% %
ASPA 5.0% 4.9% 4.7% 4.8% 4.8% 4.7% 40
Ocean 2%
Global 1%
30 0%
Q1 Q2 Q3 Q4 Q1 Q2 Q3 Q4 Q1 Q2 2015 2016 2017 2018F 2019F 2020F 2021F
DGF World 3.4% 3.3% 3.1% 3.0% 3.0% 3.0%
'16 '17 '18
WORLD CONTAINER INDEX (WCI)3) SHANGHAI CONTAINERIZED FREIGHT INDEX (SCFI)4) BUNKER PRICE INDEX 5)
3,000 1,200 1,000
2,500 1,000 800
2,000 800
600
1,500 600
400
1,000 400
BIX 380
200
500 200
BIX MGO
0 0 0
Q1 Q2 Q3 Q4 Q1 Q2 Q1 Q2 Q3 Q4 Q1 Q2 Q3 Q4 Q1 Q2 Q1 Q2 Q3 Q4 Q1 Q2
’17 ’18 ’16 ’17 ’18 ’17 ’18
1) real GDP, Global Insight, Copyright © IHS, Q2 2018 . All rights reserved 2) Demand growth = Port-to-Port Container Traffic growth. Supply growth = Fleet Growth. Source: Drewry Maritime Research. 3) Shanghai Shipping Exchange, in USD/20ft container & USD/40ft ctnr for US routes, 15 routes from
Shanghai. 4) Global Insight, Drewry, 5) Bunker Index, in USD/metric ton, Bunker Index MGO (BIX MGO) = avg. Global Bunker Price for marine gasoil (MGO) port prices; (BIX 380= avg. Global Bunker Price for all 380 centistoke (cSt) port prices; both index published on the Bunker Index website., 6) DHL
Global Trade Barometer Mar18, index value represents weighted average of current growth and upcoming two months of trade, a value at 50 is considered neutral, expanding above 50, and shrinking below 50.
DHL Global Forwarding | OFR Market Update | July 2018 4
PUBLIC

 Market Outlook July 2018 – Major Trades

Carriers continue to push for the implementation of emergency surcharges on all trades
EXPORT REGION IMPORT REGION                  CAPACITY                RATE           EXPORT REGION     IMPORT REGION           CAPACITY                RATE
                            AMNO                  -                   +                                     AMNO                   =                    =
      EURO                                                                             AMLA
                             AMLA                 =                   +                                     ASPA                   +                    +
                             ASPA                 +                  =/-                                    EURO                   +                    +
                            MENAT                 +                  =/-                                   MENAT                   =                    =
                              SSA                 =                   =                                      SSA                   --                   ++

                             AMLA                 =                   +                                     ASPA                   =/-                  +
      AMNO                                                                              ASPA
                             ASPA                 =                   +                                     AMNO                    -                   +
                            EURO                  =                   +                                     AMLA                    -                   +
                            MENAT                 =                   =                                     EURO                   =                    +
                              SSA                 =                   =                                    MENAT                   =                    +
                                                                                                          OCEANIA                  =                    +
           Strong         Moderate         No         Moderate       Strong
   KEY               ++              +            =              -             --
          Increase        Increase       Change        Decline       Decline
Source: DGF

                                                                                                    DHL Global Forwarding | OFR Market Update | July 2018         5
PUBLIC
Market Outlook July 2018 – Ocean Freight Rates Major Trades
Market outlook on smaller trades available in the back-up
OCEAN FREIGHT RATES OUTLOOK
Carriers expecting the traditional peak in July, thus announced a July GRI. Chaotic EBS/PSS implementation by various carriers to ease
ASPA – EURO
the cost pressure.
EURO – ASPA & MEA rates are slightly softening to partly compensate on the emergency surcharge
Capacity reduction to Mexico/WCSA through Maersk cancellation of AC5 and also frequent blank sailings by CMA/APL/COSCO/MSC.
ASPA – AMLA And peak season volumes are coming in, causing rates to hike, and space being limited.
Carriers remain very firm on the EBS/PSS/FAF.
Overall tight space situation as we go into traditional peak season. Carriers are planning GRI/PSS/EBS in July. 2M has withdrew
ASPA – AMNO
TP1/New Eagle service ,weekly capacity of approx. 4000 teus into PNW.
Space is the discussion and more or less all carriers are fully booked. HMM decided to withdraw from the Trade and Ocean Alliance
EURO – AMNO
have cancelled the newly launched service to South East Coast. .
Higher rate increase than expected due to higher bunker price. Space remains tight into EMED. Carriers have also successfully
ASPA – MENAT
implemented GRI into East and West Africa.
Congestion continues to ease at Shanghai port. To the Indian Subcontinent (IPBC) trade, space is tight from China/ Hong Kong. There
ASPA – ASPA are also blank sailing plans in mid-July. Rate increases to be expected due to higher bunker rates.
Capacity will decrease in July with the Ocean Alliance cancelling one of their string.
AMNO – EURO Rates are going up due to higher bunker costs.
Source: DGF
DHL Global Forwarding | OFR Market Update | July 2018 6PUBLIC
Economic Outlook & Demand Development
Steady growth amid gathering storm clouds
Recent weakening service-sector data, rising oil prices, weaker foreign trade & industrial production data hint to an underlying slowdown.
EURO Potentially unstable governments in IT & ES promise stormy times ahead. Consequently, real GDP growth is now projected to slow from 2.6% in
2017 to 2.1% this year, 1.7% in 2019 and 1.6% in 2020.Likewise, UK growth ahs been revised down to only 1.1% this year and 1.2% net year.
Estimated Q2 GDP growth has been raised roughly a full percentage point to 4.1% as reports on trade balance and personal consumption
AMNO expenditures are indicating much firmer momentum for output early in Q2, leading to a higher GDP growth forecast of 3.0% for this year, and
2.8% and 1.8% for the following years.
Weakness in domestic demand in JP is a concern. IHS expects real GDP growth to turn positive in Q2 but recovery could be milder than
previously anticipated. CN is on track for a gradual slowdown. Broad-based weakness in domestic demand, particularly slowing retail sales and
ASPA
infrastructure investment growth in May indicate a slowdown in Q2. US protectionist trade policies may darken global economic growth and
increase potential risks to CN’s exports and manufacturing growth.
Stiff headwinds of rising US interest rates and a strengthening dollar are triggering an outflow of capital from some emerging markets and forcing
EMERGING
their central banks to raise interest rates. Hardest hit have been AR & TR. And BR, ID & ZA have also come under pressure. Good news is that
MARKETS
many emerging markets, especially those in Asia and the Middle East, are not in the “danger zone”.
Although business sentiment remains below the highs seen earlier in the year, the survey data are consistent with global GDP rising at a solid
DEMAND
rate in Q2. All indexes remained in positive territory and matched or bettered the averages of 2017. The major development in recent months
DEVELOPMENT
has been the extent to which the US sentiment has risen and Eurozone sentiment has fallen.
Source: IHS Markit Global Executive Summary, IHS Purchasing Manager Index Manufacturing, a PMI at 50 is considered neutral, expanding above 50, and business shrinking below 50.
DHL Global Forwarding | OFR Market Update | July 2018 7PUBLIC
Market Outlook – Volume Outlook in Main Trade Lanes, 2018 Estimate &
2019/22 Growth Forecast in %
2018e, in mTEU 2019e-2022e CAGR, in %
N O R T H N O R T H
A M E R I C A A M E R I C A
I n c l . 4.0 mTEU +3.0% 8.1 mTEU +2.5% I n c l .
M E X I C O F A R E A S T M E X I C O
2.1 mTEU +3.4% 12.8 mTEU +2.3% 19.0 mTEU +2.8%
2.0 mTEU 1.5 mTEU
+5.6% +3.6% 1.6 mTEU +4.7% E U R O P E 7.3 mTEU +2.7% 1.7 mTEU +4.3%
L A T I N L A T I N
I n c l . M E D
A M E R I C A 1.8 mTEU +3.5% 4.1 mTEU +4.4% A M E R I C A
INTRA ASIA
excl. Oceania
41.6 mTEU +4.8%
GLOBAL CONTAINER TRADE 2018e 152.6 mTEU +4.0% CAGR 2019e-2022e
Mid-term growth is mainly driven by Asian tradelanes.
Source: Seabury Jun18 update
DHL Global Forwarding | OFR Market Update | July 2018 8PUBLIC
Capacity Development 1/2
CAPACITY DEVELOPMENT
Maersk and MSC have announced the immediate suspension of their Fast East – PNW (Pacific North West) ‘TP-1/Eagle’, a service operated within the 2M
agreement. The transpacific route is facing increasing pressure from surplus capacity and falling freight rates. Volume growth has slowed and the market
outlook for the coming months has become increasingly uncertain, due to the Sino-US tariff measures that are due to take effect from July 6th. The withdrawal of the
‘TP-1/Eagle’ will remove 1.5% of the current Far East – WCNA weekly capacity and 9.5% of the total weekly capacity operated by the 2M partners (excl HMM).
APL (CMA CGM) proceeds with the launch of its new ‘Eagle Express X’ (EXX) service, that will connect Ningbo and Shanghai to Los Angeles. First sailing is
scheduled to depart from Shanghai on 3 August. The ‘EXX’ will offer one of the fast transit times between Asia and US West Cost (eleven days from Shanghai
and twelve days from Ningbo). Further to this, APL has stared to up-size its existing ‘EX1’ service, with 6,500 – 7,500 TEU ships to successively replace 5,100
TEU class ships as of July, when the smaller ships are shifted to the new ‘EXX’ in August.
The OCEAN Alliance members (CMA CGM – APL, COSCO Shipping, Evergreen and OOCL) suspended sailings of their newly launched North Europe – US
East Coast TAT4 service in June, just two months after the loop was introduced. The service was part of the OCEAN Alliance’s 2018 ‘Day Two’ network
implemented in April. It was to turn in five weeks deploying five 4,200 – 5,000 TEU ships.
Hyundai Merchant Marine (HMM) will leave the Transatlantic trade as it is to cease to buy slots on two North Europe – US East Coast loops of Maersk Line and
MSC operated within the frame of their 2M Vessel Sharing Agreement. HMM will therewith lose its ‘global carrier’ status, which is defined by a participation in the
three main East-West trades, on top of other trades. The Korean carrier states that “market conditions have driven HMM to concentrate its efforts to service its
customers in other core trades”. The final westbound sailings from Europe is offered in the last week of June, while the last eastbound sailings from US ports will be
from Norfolk on 13 July and from Savannah on 31 July. HMM’s withdrawal is not expected to affect overall trade capacity as the 2M carriers are expected to
retake all of the slots currently used by HMM, without any changes to existing 2M services.
On the other hand, HMM has announced the selection of three Korean shipbuilders for a new building program of 20 container vessels. The orders will cover
ships with a total capacity of 388’000 TEU (8x 14’000 TEU, 12x 23’000 TEU). HMM stated on 4 June that it will sign Letters of Intent (LOI) with the selected yards,
before negotiating the final agreement on prices and other terms. This new building program will herald HMM’s return to the Far East – Europe and Transpacific
routes, with larger tonnage of its own. The ship’s introduction will coincide with the expiry of the 2M + HMM arrangement on the Far East – Europe route in Apr
2020. Source: Alphaliner, carriers
DHL Global Forwarding | OFR Market Update | July 2018 9PUBLIC
Capacity Development 2/2
CAPACITY DEVELOPMENT
HMM, Evergreen and APL are planning to introduce in August a direct service connecting main ports in China with Australia. The weekly service will turn in
five weeks using five classic panamax ships averaging 4,600 TEU. Two of the vessels will be provided by HMM, with the other three to be supplied by APL and
Evergreen. The new service will enhance HMM’s presence in the China – Australia trade and will allow the carrier to introduce own tonnage. HMM is currently also
in the process of incorporating its HMM Australia office in a bid to further strengthen its presence in the market and provide more reliable service to its customers.
The launch of this new service will be the first major capacity expansion in the Far East – Australia trade in the last twelve months and will add some 6% to
the total capacity on this route.
Maersk Line is to launch a weekly Med – Canada service, branded ‘Mediterranean-Montreal Express’ (MMX). The new loop will directly connect Italy, France and
Spain with the Montreal and Halifax gateways, and it will act as a relay service for Asian, African, Middle East and Eastern Med cargoes. The first sailing is planned
on 2 July from La Spezia. Maersk Line currently serves the Med – Canada route through slots on the ‘MCA’ service of Hapag Lloyd.
The idle containership capacity has dropped to only 0.9% of the fleet, with 93 units, aggregating a total capacity of 205,331 TEU recorded to be idle as at 11
June 2018. The idle fleet would have fallen even lower if not for the forced idling of several large carrier-controlled units. They include the fire damaged MAERSK
HONAM (15,282 TEU) which has docked at Jebel Ali on 27 May, some three months after fire broke out aboard the ship.
CMA CGM has received the CMA CGM JEAN MERMOZ (20,965 TEU), second of three 20,954 TEU megamax container ships from HHIC’s Subic Bay Shipyard in
the Philippines. The CMA CGM JEAN MERMOZ joined on 4 June the OCEAN Alliance Asia-Europe ‘NEU4’ loop, branded ‘FAL 1’ by CMA CGM.
COSCO Shipping received the COSCO SHIPPING VIRGO (20,119 TEU) on 29 May. It is the fifth unit in a 17-strong megamax vessel newbuilding program that
covers ships with nominal capacities from 19,273 to 21,237 TEU. The COSCO SHIPPING VIRGO phased into the OCEAN Alliance Asia – Europe ‘NEU2’ loop,
replacing the COSCO SHIPPING ALPS (14,568 TEU).
The Chinese ocean carrier also received its largest ever containership COSCO SHIPPING UNIVERSE (21,237 TEU) on 6 June 2018. She is the first of six
‘megamax’ sisters that COSCO is to receive from the CSSC shipbuilding group. COSCO’s new flagship has joined the OCEAN Alliance Asia – Europe ‘NEU2’
loop.
Source: Alphaliner, carriers
DHL Global Forwarding | OFR Market Update | July 2018 10PUBLIC
Carriers 1/2
CARRIERS
Hapag Lloyd issued a profit warning based on its accounts for the first five months of trading, causing its shares at one stage to drop 21%. The German carrier
has downgraded its EBIT guidance from ‘clearly increasing’ the € 410 M recorded in 2017, to between €200 M and €450 M. Hapag Lloyd stated “the reason was
an unexpectedly significant and continuing increase in operational costs since the beginning of the year, especially with regard to fuel-related costs and
charter rates. These developments cannot be fully offset by cost-saving measures that have already been initiated”.
The proposed takeover of OOIL, parent company of the shipping line OOCL, by COSCO Shipping is subject to five preconditions of which four have already
been met. The final condition though, stipulating that the deal must be cleared by China’s Ministry of Commerce (MOFCOM), remains outstanding. An
additional hurdle, namely that the deal fulfills the requirements of the Committee on Foreign Investment in the United States (CFIUS), is also pending and could
thus affect the closing of the transaction. Failure of COSCO to complete the acquisition before 30 June 2018 could affect them by having to pay OOIL a
termination fee of $253 M. Any delay in securing the approvals may not necessarily doom the deal, as both COSCO and OOIL could mutually agree to extend the
deadline beyond the proposed ‘Long Stop Date’ of 30 June 2018.
The negotiations for MSC to take a 49% minority stake in Ignazio Messina are expected to be sealed by October. MSC has reportedly underwritten an
agreement by Messina and its creditors to restructure Messina’s outstanding debt of €450 M. The debt is tied to eight 44,500 tdw/2,920 TEU container/roro ships
built in 2011-2015 for Messina at the DSME and STX Shipyards in South Korea.
CMA CGM has reported a net loss of -$77 M in Q1, 2018. This is it’s first quarterly loss since Q3, 2016. Although operating profits (core EBIT) remained positive
at $88M on revenue of $5,411 M for an operating margin of 1.6%, the results were insufficient to cover interest expenses on borrowings and other net
financial items and tax of $182M. The company said the poor results were due mainly to the rise in bunker expenses which increased to $757 M compared to
$564M in the same quarter last year. Bunker costs now account for 14.6% of CMA CGM’s total operating expenses, compared to 13.3% a year ago.
CMA CGM has announced on 20 June 2018 an agreement with Container Finance Ltd Oy to take over the shipping and logistics business of
Containerships. The Finnish carrier is an intra-European short sea specialist. The agreement remains subject to approval by the relevant authorities and the
takeover is expected to be completed within 3-6 months. The acquisition is part of CMA CGM’s strategy to diversify its regional networks.
Source: Alphaliner, carriers
DHL Global Forwarding | OFR Market Update | July 2018 11PUBLIC
Carriers 2/2
CARRIERS
ZIM has reported a net loss of -$36 M in Q1, 2018, while core EBIT dropped to a loss of -$2 M as operating margins slumped to -0.3%. The first quarter net loss
erased all of ZIM’s net profits of $6 M recorded in the full year 2017. Apart from the increase in bunker costs, ZIM is particularly exposed to the rising charter
market as its chartered fleet currently accounts for 93% of the total capacity operated by the company – the highest chartered fleet ration among the top 13
main carriers.
Source: Alphaliner, carriers
DHL Global Forwarding | OFR Market Update | July 2018 12PUBLIC
Regulations
REGULATIONS
U.S.A: Wood Packaging Materials (WPM) Requirements – Penalty Enforcement - Reminder
US Customs and Border Protection (USCBP) is responsible for enforcing the regulation at all US ports of entry. To motivate WPM compliance, effective 01
November 2017, responsible parties with a documented WPM violation may be issued a penalty. This is a change from the previous published threshold of 5
violations. There will be no yearly reset for calculating repeat violations as each WPM violation may incur a penalty. USCBP reserves the right to issue a
penalty up to five (5) years after the violation occurs.
Note: We are starting to see USCBP issue USD50,000 penalties (Note: by regulation, the penalty may be up to the value of the merchandise) to importers of
freight arriving into the US with non-compliant wood packing material (WPM). USCBP is required to issue the penalty even if the non-compliant WPM is removed
and exported.
Indonesia: Ocean Freight - Adjustment to Indonesia Customs Advanced Inward Manifest System
The Indonesian government (Customs) under the Ministry of Finance has announced to implement strictly a regulation No.158/PMK.04/2017 to adjust advanced
manifest requirements applicable for all Indonesia exports and imports.
The adjustments mainly include the following items:
• Enforce advanced submission of manifest prior to arrival. Complete and accurate cargo information as carried in the manifest must be submitted to Indonesia
Customs electronically by 1x24 hours prior to vessel arrival time.
• The manifest must contain the information of Consignee’s Tax ID (TIN or in Indonesia called NPWP) and HS Code in the Goods Description.
• The manifest must reflect all goods data under bill of lading are accurate and complete, failure to comply might lead to potential penalty.
The adjustments have been effective since 23 May 2018 for Ocean Freight (based on vessel arrival date).
Source: DHL
DHL Global Forwarding | OFR Market Update | July 2018 13Did you know?
New tariff measures between China and the US effective 6 July 2018
New tariff measures between China and the US will affect container volumes
The escalating trade tensions between the United States and China,
triggered by President Trump’s tariff measures against Chinese imports, are
expected to hit container volumes between the two countries.
China is by far the largest origin for containerized cargo into the US, accounting
for 46% of all container imports during the first five months of this year. Imports
from China reached 4.14 MTEU during the period from Jan to May, based on
data obtained from PIERS, and China-related volumes are almost then times
larger than those from the next largest origin, Vietnam, at 0.43 MTEU.
It is too early to determine the final impact of the new tariff measures and
counter-measures that will take effect on 6 July, but, since China accounts for
68% of total transpacific container volumes from the Far East, a 10% reduction
in imports from China could affect some 6.8% of transpacific volumes, if the
goods are not replaced by imports from other Fare East origins.
Source: Alphaliner
DHL Global Forwarding | OFR Market Update | July 2018 14PUBLIC
BACK-UP
15PUBLIC
Market Outlook June 2018 – Ocean Freight Rates Additional Trades (1/2)
OCEAN FREIGHT RATES OUTLOOK
Capacity and utilization are still the challenge. Carriers are fully booked to the East Coast. Pre-bookings well in advance are recommended.
EURO – AMLA
Rate increases have been implemented for July by some carriers, subj. to EBAF.
EURO – SSA Rates remain stable and space is available.
Rates were rising in the past few months but it looks like will be stable in July.
AMNO – MENAT
Space continued to be a major issue especially from US Gulf Coast and USEC is also heavy with bookings are out 3-4 weeks.
No Space issues or service changes on USA to South & West Africa services
AMNO – SSA
Rates are stable with no increase/decrease expected until new year or in the first quarter of 2018
Carriers are applying EBF/OCR from 25 to 60 per teu July 1.
AMNO – AMLA
Cost is increasing on FAK cargo. Capacity is tight US to WCSA ok all other lanes.
Roll over and space constraints affecting entire region. MX & SAWC region facing port omissions and backlogs(Market Restructuring)
Serious congestion being faced in T/Shipment ports like CTG and MIT. Unrest in NI creating severe congestion and roll overs in GT due to
AMLA Exports road cargo being converted into ocean cargo. Monthly Forecasts needed within entire AMLA region. Bookings need 4-6 weeks in advance from
vessel departure; GRI’s and Emergency Fuel surcharges announced daily on all trades
F/Time conditions being retracted as carrier costs increase
A majority of carriers are seeking to apply emergency BAF charges effective July 1st, in the region of USD 55-60 per TEU. Space remains tight
AMNO – ASPA
on all services & it is recommended to place bookings 2-3 weeks in advance in order to secure space & equipment.
Source: DGF
DHL Global Forwarding | OFR Market Update | July 2018 16PUBLIC
Market Outlook June 2018 – Ocean Freight Rates Additional Trades (2/2)
OCEAN FREIGHT RATES OUTLOOK
EURO MED - AMNO Further increases will occur during June (rate increases / costs connected to US deliveries / costs connected to fuel costs)
EUR MED – AMLA Stable/some increase depending on service and provider. Adjustment on surcharges
EURO MED – ASPA Stable/some increase depending on service and provider. Adjustment on surcharges
EURO MED – MENAT Stable/some increase depending on service and provider. Adjustment on surcharges
EURO MED – SSA Stable/some increase depending on service and provider. Adjustment on surcharges
Further to EBS/PSS implementation in July, GRI will be imposed for FAK. General sentiments from the market that by early July, cargo
ASPA-SPAC demand will start to increase so as to avoid similar incident of last year where space has been persistently tight for many months that
caught the market by surprise.
Source: DGF
DHL Global Forwarding | OFR Market Update | July 2018 17PUBLIC
Drewry’s Altman Z-Score as of 1 Jun 2018
Assets Book Value Liabilities Retained
Company Period Period Ended Units Net Sales EBIT Z-Score
Total Current of Equity Total Current Earnings
AP Moller-Maersk 3 months 31. Mrz 18 million US$ 9'253 -3 61'639 21'794 34'313 27'326 10'127 29'723 2.26
OOIL 1) Annual 31. Dez 17 million US$ 6'108 208 10'069 2'965 4'683 5'387 1'380 4'620 2.03
CMA CGM Annual 31. Dez 17 million US$ 21'116 1'574 19'657 5'624 5'644 14'013 5'956 4'619 1.89
Wan Hai 3 months 31. Mrz 18 million NT$ 14'918 146 72'753 23'665 33'705 39'048 19'566 12'065 1.66
NYK group Annual 31. Mrz 18 billion Yen 2'183 28 2'072 567 588 1'484 520 345 1.60
K Line group Annual 31. Mrz 18 billion Yen 1'162 7 1'042 396 243 799 283 67 1.54
Hapag-Lloyd Holding 3 months 31. Mrz 18 million euro 2'617 54 14'331 2'136 5'870 8'462 2'749 3'146 1.45
MOL group Annual 31. Mrz 18 billion Yen 1'652 23 2'226 480 628 1'598 383 307 1.26
Evergreen Marine Corp 3 months 31. Mrz 18 million NT$ 36'841 493 196'599 57'390 65'845 130'754 45'021 12'183 1.25
China Cosco 2) 3 months 31. Mrz 18 million RMB 21'923 699 129'359 34'792 43'356 86'003 40'728 9'959 1.10
Pacific International Lines Annual 31. Dez 17 million US$ 4'037 -267 6'107 1'471 1'906 4'201 2'068 1'078 0.92
Yang Ming 3 months 31. Mrz 18 million NT$ 31'035 -2'066 130'908 25'968 24'320 106'587 50'022 -3'460 0.62
Zim Annual 31. Dez 17 million US$ 2'978 135 1'802 580 -93 18'996 687 -1'892 0.36
Hyundai Merchant Marine 3 months 31. Mrz 18 billion Won 1'112 -164 3'399 1'227 749 2'650 682 -2'890 -0.16
The Z-Score is a statistical analysis to predict a company’s probability of failure in the next two years, using data from the company’s financial statement.
Z-Score 2.99 = company is “safe”; Z-Score between 1.8 and 2.99 = exercise caution (“grey zone”); Z-Score 1.8 = Higher risk of the company going bankrupt
(“distress zone”)
Source: Drewry Sea & Air Shipper Insight February 2018, 1) parent of OOCL, 2) parent of Cosco Container Lines; Z-score is calculated as follows: T1 = (Current Assets - Current Liabilities) / Total Assets, T2 = Retained Earnings / Total Assets, T3 =
Annualized EBIT / Total Assets, T4 = Book Value of Equity / Total Liabilities, T5 = Annualized Sales / Total Assets, Z-score bankruptcy rating = 1.2*T1 + 1.4*T2 + 3.3*T3 + 0.6*T4 + 1.0*T5
DHL Global Forwarding | OFR Market Update | July 2018 18PUBLIC
Topic of the Month
Top 12 Carriers by Operated Capacity (in Mil. TEU), December 2017
5 After triggering regulatory approval processes in 23 jurisdictions, Maersk
finally aquired Hamburg Süd.
Over the next five months, Maerk will terminate some of Hamburg Süd’s
4
overlapping services on certain trades.
3
2
1
0
APM- MSC COSCO, CMA CGM, Hapag-Lloyd ONE (NYK, Evergreen Yang Ming PIL Zim HMM Wan Hai
Maersk, OOCL Mercosul MOL, K Line)
Hamburg
Süd
Source: Alphaliner, incl. pending mergers
DHL Global Forwarding | OFR Market Update | July 2018 19PUBLIC
Acronyms and Explanations
2M - Carrier Alliance: Maersk / MSC OCRS - Operational Cost Recovery surcharge
AMLA - Latin America OWS - Overweight Surcharge
AMNO - North America PH - Philippines
AR - Argentina PNW - Pacific North West
ASPA - AsiaPacific Ppt. - Percentage points
BR - Brazil PSW - Pacific South West
CAGR - Compound Annual Growth Rate RR(I) - Rate Restoration
CENAC - Central Amercia and Caribbean SAEC - South America East Coast
CKYHE - Carrier Alliance: Cosco, K-Line, YangMing, Hanjin and Evergreen SAWC - South America West Coast
CNC - CNC Line (Cheng Lie Navigation Co. Ltd.) SOLAS - Safety of Life at Sea
DG - Dangerous Goods SPRC - South People’s Republic of China – South China
DWT - Dead Weight Tonnage SSA - Sub-Saharan Africa
EB - Eastbound SSL - Steam Ship Line
ECSA - East Coast South America T - Thousands
EURO - Europe TEU - Twenty foot equivalent unit (20‘ container)
FMC - US Federal Marine Commission TP - Trans Pacific
G6 - Carrier Alliance: APL, Hapag Lloyd, Hyundai, MOL, NYK and OOCL TSA - Trans Pacific Stabilization Agreement
GRI - General Rate Increase ULCS - Ultra Large Container Ship
HJS - Hanjin Shipping USGC - US Gulf Coast
HMM - Hyundai US FMC - US Federal Maritime Commission
HSUD - Hamburg Süd USEC - US East Coast
HWS - Heavy Weight Surcharge USWC - US West Coast
IA - Intra Asia VGM - Verified Gross Mass
IPBC - India Pakistan Bangladesh Colombo VLCS - Very Large Container Ship
IPI - Inland Point Intermodal VSA - Vessel Sharing Agreement
ISC - Indian Sub Continent WB - Westbound
MENAT - Middle East and North Africa WCSA - West Coast South America
mn - Millions YML - Yang Ming Line
MoM - Month-on-Month YoY - Year-on-Year
NOO - Non-operating (vessel) owners YTD - Year-to-Date
Ocean 3 - Carrier Alliance: CMA, UASC, China Shipping
DHL Global Forwarding | OFR Market Update | July 2018 20You can also read