FULL YEAR RESULTS 2018 - Investor Presentation January 2019 - Commercial Bank of Dubai

Page created by Bradley Neal
 
CONTINUE READING
FULL YEAR RESULTS 2018 - Investor Presentation January 2019 - Commercial Bank of Dubai
Commercial Bank of Dubai

                      Investor Presentation
FULL YEAR             January 2019
RESULTS
2018                  Dr Bernd van Linder
                      Chief Executive Officer

                      Mr Darren Clarke
                      Chief Financial Officer

            Slide 0
                                                    Slide 0
FULL YEAR RESULTS 2018 - Investor Presentation January 2019 - Commercial Bank of Dubai
Disclaimer
In accessing the information in this document, you agree to be bound by the following terms and conditions.

The information is provided to you solely for your information and may not be retransmitted, further distributed to any other person or published, in whole or in part, by any
medium or in any form for any purpose. The opinions presented herein are based on general information gathered at the time of writing and are subject to change without notice.
The Bank relies on information obtained from sources believed to be reliable but does not guarantee its accuracy or completeness. The financial information contained within this
presentation is, unless otherwise specified, taken from the Bank’s annual audited consolidated financial statements.

This document contains data compilations, writings and information that are proprietary and protected by copyright and other intellectual property laws, and may not be
redistributed or otherwise transmitted by you to any other person for any purpose.

This document does not constitute an offer, agreement, or a solicitation of an offer or an agreement, to enter into any transaction (including for the provision of any services). No
assurance is given that any such transaction can or will be arranged or agreed. Before entering into any transaction, you should consider the suitability of the transaction to your
particular circumstances and independently review (with your professional advisers as necessary) the specific financial risks as well as the legal, regulatory, credit, tax and
accounting consequences.

The information contained herein has not been independently verified and no responsibility is accepted nor a representation, undertaking or warranty is made or given, expressly
or impliedly, by CBD or any of its officers or advisers as to the accuracy, reliability or completeness of the information or as to the reasonableness of any assumptions on which any
of the same is based or the use of any of the same. Accordingly, no such person will be liable for any direct, indirect or consequential loss or damage suggested by any person
resulting from the use of the information or for any opinions expressed by any such person, or any errors, omissions or misstatements made by any of them. The statements
contained herein are made as at the date of this presentation, unless another time is specified in relation to them, and delivery of this presentation shall not give rise to any
implication that there has been no change in the information set forth in this document since that date. Save as otherwise expressly agreed, none of the above persons should be
treated as being under any obligation to update or correct any inaccuracy contained herein or be otherwise liable to you or any other person in respect of any such information.
Market data used in the information not attributed to a specific source are estimates of the Bank and have not been independently verified. No reliance may be placed for any
purpose whatsoever on the information contained in this document or on its completeness and accuracy.

Nothing contained in this presentation shall be deemed to be a forecast, projection or estimate of CBD’s future financial performance. This presentation may contain statements,
statistics and projections that include words such as "intends", "expects", "anticipates", "estimates" and words of similar import. All statements included in this presentation other
than statements of historical information, including, without limitation, those regarding financial position, business strategy, plans and objectives of management for future
operations (including development plans and objectives) are forward-looking statements. By their nature, such statements involve risk and uncertainty because they relate to
events and depend on circumstances that will occur in the future. No assurance can be given that such expectations will prove to be correct and actual results may differ materially
from those projected because such statements are based on assumptions as to future economic performance and are not statements of fact. CBD expressly disclaims to the fullest
extent permitted by law any obligation or undertaking to disseminate any updates to these forecasts, projections or estimates to reflect events or circumstances after the date
hereof, nor is there any assurance that the policies, strategies or approaches discussed herein will not change. Nothing in the foregoing is intended to or shall exclude any liability
for, or remedy in respect of, fraudulent misrepresentation.

For any inquiries, please contact investor relations team
investor.relations@cbd.ae
                                                                                                                                                                                 Slide 1
FULL YEAR RESULTS 2018 - Investor Presentation January 2019 - Commercial Bank of Dubai
Earnings Snapshot                                                       (AED m)

                                             Change (AED, bp)   Change (%)
                                     FY18         FY18 - FY17   FY18 - FY17

Net profit                         1,162.1             160.2         16.0%

Return on equity (RoE)              13.5%              179.3         15.4%

Return on assets (RoA)              1.57%              14.54         10.2%

Interest margin                     2.69%              (11.3)       (4.0%)

Cost to income ratio                31.5%             (258.3)       (7.6%)

Impairment charge to gross loans    1.26%              (11.2)       (8.2%)

Capital adequacy ratio              14.6%              (60.1)       (4.0%)

                                                                       Slide 2
FULL YEAR RESULTS 2018 - Investor Presentation January 2019 - Commercial Bank of Dubai
Performance Achievements

     • Improved underlying business performance with a broad based profit uplift

     • Solid loan growth across both Corporate and Commercial Banking

     • Excellent momentum in the Treasury business

     • Strong credit management practices with close management over provisions
       and recoveries

     • Continued digitisation of core customer processes

     • Further strengthening of senior leadership team and organisational redesign

     • Disciplined control over staff and all operating expenses

     • Streamlining of our physical footprint as evidenced by the closure of four
       branches

                                                                                     Slide 3
FULL YEAR RESULTS 2018 - Investor Presentation January 2019 - Commercial Bank of Dubai
Strategic Pillars – geared towards a high performing organisation

              Achieve
      A
          Financial Results
                                                    Ongoing:

                                                    o Enhance customer experience
          Become Employer
      B                                             o Build on core strengths
            of Choice
                                                    o Focus on performance culture

                                                    o Balance sheet optimisation
             Customer
      C                                             o Streamline and automate processes
               Focus
                                                    o Improve efficiencies

               Default
      D
               Digital

                                                                                          Slide 4
FULL YEAR RESULTS 2018 - Investor Presentation January 2019 - Commercial Bank of Dubai
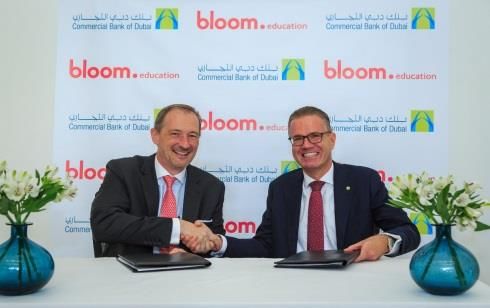
Strategic Execution in 2018
                        o Net profit up by 16% compared to 2017
      Achieve           o Return on equity improved to 13.47% for the year
  Financial Results
                        o Cost to income reduced to 31.5% from 34.1%

                          o Injected talent in core operating divisions
  Become Employer         o Implementing a high performance culture across the organisation
      of Choice
                          o Development and retention of UAE national talent

                               o Set up a corporate service desk and dedicated contact center
          Customer             o Enhanced the cash management product suite
            Focus
                               o Improved treasury product offering and customer support

                                   o Automated core credit processes
              Default
                                   o Rolled out our enhanced retail CBD App
              Digital
                                   o Reduced credit card service time

                                                                                              Slide 5
FULL YEAR RESULTS 2018 - Investor Presentation January 2019 - Commercial Bank of Dubai
Financial Dashboard                                                                               (AED m)

Income statement                                 FY 18    FY 17       Var      Q4 18    Q3 18      Var
Net interest income & Islamic financing income    1,911    1,821      5.0%       484      489     (1.0%)
Net fees, commission and FX income                  721      684      5.4%       185      182       1.3%
Other operating income                               92      138   (33.0%)        38       19    106.5%
Total revenue                                     2,725    2,642      3.1%       707      690       2.5%
Operating expenses                                  858      901    (4.7%)       224      210       6.5%
Operating profit                                  1,866    1,742      7.2%       483      480       0.8%
Net impairment allowances                           704      740    (4.8%)       164      197    (16.8%)
Net profit                                        1,162    1,002     16.0%       319      282      13.0%
Balance sheet
Gross loans and advances                         54,058   50,185     7.7%      54,058   52,848     2.3%
Allowances for impairment                         3,113    2,910     7.0%       3,113    3,045     2.2%
Net loans and advances                           50,945   47,276     7.8%      50,945   49,803     2.3%
Total assets                                     74,102   70,414     5.2%      74,102   72,437     2.3%
Customers' deposits                              53,165   48,411     9.8%      53,165   50,415     5.5%
Shareholders' equity                              9,219    9,081     1.5%       9,219    8,908     3.5%
Key ratios, %
Return on equity                                  13.5%    11.7%       179      13.8%    12.7%      117
Return on assets                                   1.6%     1.4%         15      1.7%     1.6%       16
Cost to income ratio                              31.5%    34.1%      (258)     31.7%    30.5%      119
Capital adequacy ratio (limit >= 12.375%)         14.6%    15.2%        (60)    14.6%    14.9%       (31)
Non-performing loan (NPL)                          6.2%     8.7%     (249)       6.2%     6.7%       (56)
Provision coverage                                77.8%    78.3%        (46)    77.8%    72.1%      572
Net interest margin                               2.69%    2.81%       (11)     2.56%    2.73%      (17)
Loan to deposit                                   95.8%    97.7%      (183)     95.8%    98.8%     (296)
Advances to stable resources (limit = 10.375%)                   13.4%    14.0%       (62)     13.4%    13.7%      (31)
CET1 ratio (limit >= 8.875%)                      13.4%    14.0%       (62)     13.4%    13.7%      (31)
                                                                                                    Slide 6
FULL YEAR RESULTS 2018 - Investor Presentation January 2019 - Commercial Bank of Dubai
Net Profit Performance for 2018 – Strong business performance with broad based improvement
                                                                                                                                                                                      (AED m)

                                                                                                                                          7
                                                                                                                        16                                                    1,162
                                                                                                        24
                                                                                     27                                                                      (69)
                                                                  28
                                                  37

         1,002
                              90

                               1                   2                   3                  4                  5               6                                      7

         FY 17            Net Interest    Foreign exchange    Impairment       Other operating    Other income   Staff expenses       Net credit &        Gains from          FY 18
                            Income         and fee income    allowances on        expenses                                         equity impairment     investments
                              (NII)                            investment
                                                                properties

  1                           2                         3                           4                            5                            6                         7
       NII increased by            Foreign exchange         Valuation                   Other operating               Other income                 Staff expenses           One off
  90m due to a higher          and fee income            impairment on              expenses were lower by       increased by 24m             reduced by 16m            investment dividend
  average performing           increased by 37m in       investment                 9% or 27m as a result of     mainly attributable          following network         received in 2017 not
  loan balance and             2018 across               properties were not        disciplined expense          to the gain on sale of       optimisation,             repeated in 2018.
  interest earning             processing fees, fund     repeated in 2018.          management practices         properties acquired          organisation
  assets coupled with          management fees,                                     and overall increased        in settlement of             structure
  a higher average             loans and advances,                                  operational efficiency.      debts.                       improvements and
  yield.                       credit cards, deposit                                                                                          enhanced operating
                               accounts and trade                                                                                             efficiencies.
                               finance activities.

                                                                                                 Slide 7
                                                                                                                                                                                        Slide 7
FULL YEAR RESULTS 2018 - Investor Presentation January 2019 - Commercial Bank of Dubai
Underlying Business Growth – good momentum with our strategy execution                                                                                           (AED m)

                           Revenue composition                                                                      Net profit
  OOI       NII
                                    +5%                                                                                +2%
                                            2,642                   2,725                                                                                 1,162
                           2,462                                                           1,066
    2,352                                               +3%          813                                    1,003                1,002
                                             822
                            737             (31%)                   (30%)                                                                    +16%
     712
                           (30%)
    (30%)

                                            1,821                   1,911
    1,640                  1,725
                                            (69%)                   (70%)
    (70%)                  (70%)

    2015                   2016             2017                    2018                   2015             2016                 2017                     2018

                                   Assets                                                                           Net loans

                                    +12%                              74,102
                                                    70,414
                                   64,080                                                                             +12%                                 50,945
                  57,864                                      +5%                                                                        47,276
                                                                                                                      41,963
  46,878                                                                                           39,021                                           +8%
                                                                                         31,822

   2014           2015              2016            2017              2018               2014      2015               2016               2017               2018

                                                                               Slide 8
                                                                                                                                                                  Slide 8
FULL YEAR RESULTS 2018 - Investor Presentation January 2019 - Commercial Bank of Dubai
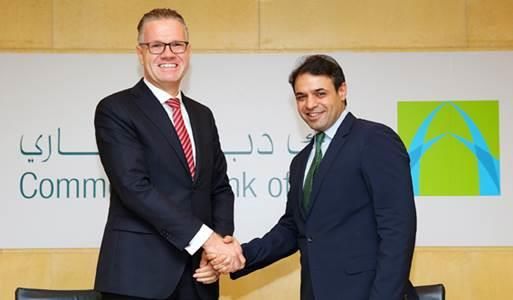
Profitability and Returns – improved business performance and tight expense discipline                                                                                                           (AED m)

                                        Expenses                                                                                       Revenue and expense JAWS
                                                                                                                 Revenue       Expenses
                                                                                                                                                                                        2,725
                                                                    -5%                                                                                            2,642
                                                                                                                                       2,462
                                871                      901                                                    2,352
     859                                                                          858

                                                                                                                                                                                                   +7.8%
                                                                                                     (8.8%)                                  +3.3%

                                                                                                                859                    871                         901                   858

     2015                      2016                      2017                     2018
                                                                                                                2015                   2016                        2017                  2018

                            RWA and Return on Equity                                                                                             OOI composition
   Credit Risk           Operational Risk           Market Risk           Return on Equity                       Fees and Commission           FX and Investment      Others   * 2017 includes a one-off
                                                                                                                                                                                 investment dividend.

                                              +9%
                                                                                                                                                         +5%
     13.9%                                                                       63,605                                                                             822
                                                        60,728                                                                                                                            813
                               55,187
    49,342                                              11.7%                                                                                737                               -1%
                                                                                  13.5%                                712
                               12.4%                                                                                                         495                    565                   578

                                                        55,412                   58,284                                498
                               50,669
    45,184
                                                                                                                                             204                    211                   165
                                                                                                                      178

                 4,141                      4,409                 4,660                      4,893                     36                      38                    46                    70
      17                        109                      656                       427
     2015                      2016                      2017                     2018                                2015                   2016                  2017 *                 2018

                                                                                                      Slide 9
                                                                                                                                                                                                 Slide 9
Financial Indicators – excellent traction in lifting returns
                Return on Equity (ROE)                                          Cost to Income Ratio

                         +4%                                                             -6%
                                         13.5%
                                                               35.4%
      12.4%                                                                             34.1%
                        11.7%
                                                                                                                 31.5%

      FY16               FY17            FY18                  FY16                     FY17                     FY18

                Return on Assets (ROA)                                 Other Operating Income as % of Expenses

                         0%                                                             +6%
      1.6%                               1.6%                                                                    94.8%
                         1.4%                                                           91.2%
                                                               84.6%

      FY16               FY17            FY18                  FY16                     FY17                     FY18

                                                                                                                         Slide 10
Asset Quality and Impairments – improved underlying asset quality with lower NPL                                                                                                              (AED m)

                                   Cost of Risk                                                                         Impairment Charges  and Recoveries
                                                                                                                                   Cost of Risk
                                                                                                     Impairment charges                   Recoveries            Coverage%
     1.64%                              -4%
                                                                                                                                                       102%
                                                                                                                      94%                92%
                                                      1.37%
                           1.26%                                                1.26%           85%
                                                                                                                                                                        78%             78%

                                                                                                                                                                        852
                                                                                                                                                       704                              752
                                                                                                                                     514
                                                                                              419
                                                                                                                 347                                          115              112
                                                                                                                            63                 87
                                                                                                       24                                                                                         48

     2011                  2016                       2017                      2018            2013                  2014                2015           2016               2017            2018

                                    NPL Ratio                                                                                        GrossCost
                                                                                                                                           LoanofExposures
                                                                                                                                                  Risk
    Non-performing loans           NPL ratio (%)              Provisions to gross loans (%)         Dec-17        Dec-18            % of total
                                                                                                                                                                                       +3,872
                                                                    4,302
                                                                                                      +4,178
                                                                                                                                                                                            54,058
                                                                                                                                                                                   50,185
  3,334         3,242                                                                3,307                   45,694
  10.1%                                            3,101
                9.3%          2,895                                                            41,516
                                                                    8.7%

                8.7%           6.9%                6.9%                                               84.5%                          8.4%                      7.1%                    100.0%
  8.5%                                                                               6.2%
                                                   6.9%
                               6.4%                                                                                                                           -1,004
                                                                    5.8%             5.8%                                            +699

                                                                                                                                 3,819     4,518         4,851      3,846

  2013          2014           2015                2016             2017             2018             Stage 1                       Stage 2                   Stage 3                   Total

                                                                                                                                                                                                Slide 11
Balance Sheet and Capital Strength – strong capital position with underlying internal capital generation
                              Capital Adequacy Ratio (CAR)                                                                                  CommonCost
                                                                                                                                                   Equity Tier 1 (CET1)
                                                                                                                                                       of Risk
        CAR             Regulatory limits (Minimum)                                                                CET1             Regulatory limits (Minimum)

                                                                          +0.34%
                                                                                                                                                                                            +0.15%
       15.75%
                                  15.15%                     14.51%                    14.56%                      14.59%                      14.03%                      13.39%                    13.41%

    12.375%

                                                                                                                8.875%

         2016                      2017                  2017 adjusted                  2018                         2016                        2017                  2017 adjusted                 2018
                                                                                                               * CET1 regulatory limit includes the capital conservation buffer of 1.875%
 * 2017 retained earnings have been updated by 397m for IFRS9 opening adjustment to be 2.6b instead of 3.0b

                           Eligible Liquid Assets Ratio (ELAR)                                                                              Loans to Deposits and ASRR
        ELAR             Regulatory limits (Minimum)                                                               Loans to Deposits               ASRR             Regulatory limits - ASRR (Maximum)

                                                                                                                                                          0%
                                                 +2%                                                          100.00%
       15.52%                     15.51%
                                                                                       16.23%
                                                             14.38%

    10.00%                                                                                                     96.41%                     95.86%                      97.65%                     95.82%
                                                                                                                          84.55%                     83.67%                      88.59%                   89.42%

         2015                      2016                       2017                      2018                         2015                        2016                       2017                     2018

                                                                                                                                                                                                            Slide 12
Funding and Liquidity – a stable source of diversified funding                                                                                                                                                                 (AED m)

                                                           Customers’ Deposits                                                                                          Other Funding Sources
       TD                  CASA                                                                                                              Acceptances & Others        Notes & Medium Term Borrowing
                                                                                                                                             Due to Banks < 1year        Equity
                                                                                                                                             Due to Banks > 1year
                                                                     +13%                                              53,165                                                         9%
                                                                                              48,411                                                                                                  22,003
                                                                   43,774                                                                                                           20,306                                  20,937
                                     40,475
                                                                                                                                                               17,389                3,986            6,053
     32,161                                                                                                            32,484                                                                                               6,345
                                                                                              29,226                                         14,717             2,556                         1,560            780
                                                                   24,576                                                                    1,787                       1,111                                              1,480
                                     23,223
     16,242                                                                                                                                            1,098                         6,081            6,090                          1,283
                                                                                                                                                               5,493                                                        2,610
                                                                                                                                             4,022

                                     17,252                        19,198                     19,185                   20,681                                  8,229                 8,680            9,081                 9,219
     15,919                                                                                                                                  7,810

       2014                            2015                          2016                       2017                     2018                2014               2015                 2016             2017                  2018

                                                            Loans to Deposits                                                                                           Deposit Segmentation

       Net Loans                  Customer Deposits                             Net Loans to Deposit Ratio %                                 Government        Individual         Corporate

           98.9                                                                                                                                                                                                  53,165
                                           96.4                          95.9                       97.7                     95.8                                                   48,411
                                                                                                                                                     43,774                                                      13,743
                                                                                                                                                                                    11,852
                                                                                                                                                     10,815
                                                                                                                                                                                                                 13,866
                                                                                                                                    53,165
                                                                                                                    50,945

                                                                                                                                                                                    11,649
                                                                                                           48,411
                                                                                           47,276

                                                                                                                                                     10,998
                                                                                43,774
                                                                41,963
                                                  40,475
                                  39,021
                  32,161
  31,822

                                                                                                                                                     21,961                         24,910                       25,557

       2014                            2015                          2016                       2017                     2018                         2016                           2017                            2018

                                                                                                                                                                                                                                Slide 13
Balance Sheet and Dividend Analysis – a diverse highly rated customer portfolio                                                                                                                                               (AED m)

                                                   Assets and Loans                                                                                           Gross Loans and Advances by Sector

    Loans and Advances                     Total Assets                                                                                 Sector                                              2018             2017             Δ%
                                                                                                                                        Real estate                                           17,161          16,258             4.9%
                                                                                                                                        Financial and insurance activities                     7,312           4,669            54.2%
                                                                                                                                        Trade                                                  5,317           4,959             7.2%
                                                                +12%
                                                                                                                                        Personal-schematic                                     4,925           4,545             8.5%
                                                                                                                                        Services                                               4,305           3,710            16.0%
                                                                                                                                        Personal-mortgage                                      2,836           2,628            12.9%
                                                                                                                                        Hospitality                                            2,652           2,930           (9.5%)
                                                                                                                                        Construction                                           2,523           2,077            21.5%

                                                                                                                           74,102
                                                                                                   70,414
                                                                   64,080
                                                                                                                                        Manufacturing                                          2,360           3,063          (23.0%)
                                          57,864

                                                                                                               50,945
                                                                                                                                        Individual loans for business                          2,032           2,283          (12.5%)

                                                                                    47,276
               46,879

                                                       41,963
                              39,021

                                                                                                                                        Transportation and storage                             1,492           1,953          (24.6%)
  31,822

                                                                                                                                        Others                                                 1,012             975             3.2%
                                                                                                                                        Government and public sector entities                    131             135            97.2%
                                                                                                                                        Total                                                 54,058          50,185             7.7%
       2014                        2015                     2016                         2017                       2018

              Investment Securities Portfolio (AED 7 b as at Dec 2018)                                                                                              Reliable Dividend Payments

                        By Geography                                                              By Type

             20%                                                                                       1% 0%
                                                                                             6%                                                     20.0                            20.0
                                                                                                                                                                                                                      17.5

                                                     59%                39%

                                                                                                                                                   560.5         53%                560.5          56%                             49%
                                                                                                                             54%                                                                                      490.5
 21%

           Domestic                                                         Equities
                                                                                                                                                   2015                             2016                              2017
                                                                            Fund of funds
           Gulf Cooperation Council (GCC)                                   Fixed rate government securities
           International                                                    Other fixed rate securities                                          Cash dividend amount           Dividend payout to net profit ratio
                                                                            Floating rate non-government securities                               Cash dividend (Fils per share)
                                                                                                                                    Slide 14
                                                                                                                                                                                                                              Slide 14
Divisional Contributions – specialist business lines to support our customers’ requirements
              FY18 divisional net profit movement (AEDm)                                              FY18 divisional RWAs movement (AEDm)

                                           138          7        1,162
                                                                                                      4,129     (19)            (2)             (1,231)       63,605
  1,002         (467)        482                                                     60,728

                                 Up 16%                                                                                Up 5%

  FY17          Corp        Comm          Retail     Treasury,   FY18                FY17             Corp     Comm            Retail           Treasury,     FY18
                            & Buss                 investments                                                                                investments
                                                    and others                                                                                 and others

                                                                                       Commercial &                        Treasury &
         FY18 (AEDm)                                                     Corporate       Business             Retail       Investment                 Total

         Operating income                                                   945                787              635                   359                 2,725

         Expenses                                                          (165)              (255)            (399)                  (39)                (858)

         Operating profit                                                   779                531              236                   319                 1,866

         Impairment (charges)/benefits                                     (422)               (96)            (179)                    (7)               (704)

         Net profit                                                         358                435               57                   312                 1,162

         % of Group net profit                                             30.8               37.5               4.9                  26.8                100.0

                                                                                                                                                                  Slide 15
Business Performance – Corporate Banking                                                               (AED m)

             Net profit                           Revenues                     Gross loans
                                   OOI      NII
               -57%                                                                +10%
                                                    +5%
     824                                                                                      33,520
                                                              945     30,509
                                          902

                                          224                 226

                           358
                                          679                 719

    Dec-17                Dec-18         Dec-17              Dec-18   Dec-17                  Dec-18

             Deposits                              RWA                     Cost to income (CTI)

                                                   +12.6%
                                                                                  -3.3%
                +5%
                                                             36,942   18.0%                   17.5%
                          29,152         32,815
    27,700

    Dec-17                Dec-18         Dec-17              Dec-18   Dec-17                  Dec-18

                                                                                                       Slide 16
Business Performance – Commercial & Business Banking                                                   (AED m)

             Net profit                           Revenues                     Gross loans
                                   OOI      NII
                                                                                   +9%
               large                                -1%
                                                                                              13,520
                                          794                 787     12,442

                                          225                 248

                           435

                                          570                 539

     (47)
    Dec-17                Dec-18         Dec-17              Dec-18   Dec-17                  Dec-18

             Deposits                              RWA                     Cost to income (CTI)
                                                                                  -8.4%
               +28%
                                                    -0.1%             35.4%
                          10,129                                                              32.4%
                                         16,129              16,110
    7,939

    Dec-17                Dec-18         Dec-17              Dec-18   Dec-17                  Dec-18

                                                                                                       Slide 17
Business Performance – Retail Banking                                                                  (AED m)

             Net profit                           Revenues                     Gross loans
                                   OOI      NII
                                                                                   -3%
                                                    +15%
               large                                                  7,234                   7,017
                                                              635
                           57
                                          551
                                                              183
                                          162

                                                              452
                                          389

     (81)                                Dec-17              Dec-18   Dec-17                  Dec-18
    Dec-17                Dec-18

             Deposits                              RWA                     Cost to income (CTI)
                                                    0.0%                          -17.6%
                +9%
                                         6,049               6,047    76.2%
                          13,884
    12,772                                                                                    62.8%

    Dec-17                Dec-18         Dec-17              Dec-18   Dec-17                  Dec-18

                                                                                                       Slide 18
Business Performance – Treasury, investments and others                                                   (AED m)

             Net profit                           Revenues                     Investment, net
                                   OOI      NII
                +2%                                 -9%
                                          396                                        -5%
     306                   312
                                                              359     7,158
                                                                                                 6,836

                                          212                 157

                                          184                 202

    Dec-17                Dec-18         Dec-17              Dec-18   Dec-17                     Dec-18

       Notes and due to banks                      RWA                     Cost to income (CTI)

                -22%                               -21.5%
    6,869                                5,736

                           5,373                             4,505
                                                                                   +18.0%

                                                                                                 11.0%
                                                                      9.3%

    Dec-17                Dec-18         Dec-17              Dec-18   Dec-17                     Dec-18

                                                                                                          Slide 19
CBD – a strong legacy to build an exciting future

       1969                                1982                                                             2018

Public Shareholding Company       With the introduction of                    CBD is owned by UAE entities and nationals
established by an Emiri Decree    restrictions on foreign banks’
issued by His Highness the late   operations in the UAE, CBD
                                                                     • CBD shareholders: Government of Dubai (via the Investment Corporation of Dubai) with
Sheikh Rashid Bin Saeed Al        converted into a national Public
                                                                       20% and UAE nationals and entities owned by UAE nationals with 80%. In accordance
Maktoum and owned by three        Shareholding Company.
                                                                       with CBD’s articles of association, the shares which are listed on the Dubai Financial
foreign      banks      (Chase
                                                                       Market are currently owned and shall be owned by, and may only be acquired by,
Manhattan, Commerzbank &
                                                                       natural persons having UAE nationality or legal persons or corporations fully owned by
Commercial Bank of Kuwait)
                                                                       UAE nationals.
whose combined shareholding
was 78%.                                                             • CBD is managed by business segments namely: Corporate Banking, Commercial Banking,
                                                                       Business Banking, Personal Banking and Treasury & Investments. As at 31 December 18,
                                                                       assets of the Corporate Banking segment and Commercial Banking segment together
                                                                       accounted for approximately 49.7 b or 67% of its total assets.
                                                                     • CBD launched a full fledged Islamic Banking business in September 2008 to offer Shari’a-
                                                                       compliant banking and financial services.
                                                                     • CBD has two wholly-owned subsidiaries: CBD Financial Services LLC (CBDFS), which
                                                                       provides brokerage facilities for local shares and bonds; and Attijari Properties LLC,
                                                                       which provides services for self-owned property management. It also has one associate
                                                                       (17.8% shareholding) National General Insurance Co. PSC (NGI), which underwrites life
                                                                       and general insurance business as well as certain reinsurance business.

                                                                              Slide 20
                                                                                                                                                         Slide 20
Board of Directors and Management Team
                          Board of Directors                                                                                    Shareholders

                                                                                    Government of Dubai* 20%                                Al Futtaim Private Co. 10.51%
                                                                                                                                                  Orient Insurance PJSC. 8.84%
                                                                                                                      UAE nationals                  Abdulla Hamad Al Futtaim 6.95%
                                                                                                                          80%                         Ghobash Trading & Inv. 6.37%
                                Mr. Humaid Mohammad                                                                                               A W Rostamani Group 6.10%
                                                                                     General public 36.23%
                                Al Qutami
                                Chairman
                                                                                                                                             Al Majid Investments 5%
                                                                                  *Investment Corporation of Dubai (ICD)

                                                                                                                           Management Team

     Mr. Ahmad Abdulkarim Julfar                  Mr. Abdulla Saif Al Hathboor                                                  Dr. Bernd van Linder
     Vice-Chairman                                Director                                                                      Chief Executive Officer

                                                                                                      Mr. Darren Clarke                                       Mr. Fahad Al Mheiri
     Mr. Abdullah Salim Alturifi                  Mr. Abdul Wahed Mohamed Al                          Chief Financial Officer                                 General Manager,
     Alshamsi                                     Fahim                                                                                                       Attijari Al Islami
     Director                                     Director

                                                                                                      Mr. Othman Bin Hendi                                    Mr. Abdul Rahim Al Nimer
                                                                                                      General Manager,                                        General Manager,
     Mr. Ali Fardan Al Fardan                     Mr. Buti Saeed Al Ghandi                            Corporate Banking                                       Commercial Banking
     Director                                     Director

                                                                                                      Mr. Hassan Al Redha                                     Mr. Amit Malhotra
                                                                                                      General Manager, Institutional &                        General Manager,
                                                                                                      Transaction Banking                                     Personal Banking Group
     Mr. Hamed Ahmed Kazim                        Mr. Khalid Abdul Wahed
     Director                                     Al Rostamani
                                                  Director                                            Mr. Mark Zanelli                                        Mr. Gareth Powell
                                                                                                      Head of Treasury and Asset &                            Chief Human Resources Officer
                                                                                                      Liability Management

     Mr. Omar Mohammad Ali                        H.H. Sheikh Maktoum Hasher
     Alqaizi                                      Al Maktoum                                          Mr. C. Krishna Kumar                                    Mr. Alan Grieve
     Director                                     Director                                            Chief Operating Officer                                 Chief Risk Officer

                                                                                 Slide 21
                                                                                                                                                                                       Slide 21
Corporate Governance – leading with excellence
                                                                        Board of Directors

                                                                                                                       Organisational Structure
                                                                                                                 Chairman and
The Board of Directors provides strategic guidance, effective monitoring of                                    Board of Directors
management, adequate controls and sets the tone and culture of the Bank to       Board
enhance and ensure sustainable shareholder value.                                                           Nomination &        Financial Settlement           Audit &
                                                                                 Credit & Investment                                                                                    Risk
                                                                                                            Remuneration         and Restructuring           Compliance
                                                                                     Committee                                                                                       Committee
                                                                                                             Committee              Committee                Committee
                                                                                     Oversees the            Reviews and           Approves large        Assists the Board in    Supports the Board
                                                                                     quality of the        approves overall         restructuring             fulfilling its       in ensuring that
                                                                                    Bank’s Credit &         HR policies and          proposals,                oversight           CBD achieves its
The Board of Directors has a collective responsibility for the Bank, including        Investment         strategy, and CBD’s       provisions and         responsibilities for   strategic objectives
approving the strategic objectives based on the long term financial interests        portfolio and          compensation        write offs, oversees         CBD’s audit,           without being
of the Bank’s Shareholders, overseeing the implementation of the strategy         effectiveness of its   program in order to      approach to and        internal control and    unduly exposed to
                                                                                                          attract, retain and         guides in              compliance                 risks.
and achievement of the strategic objectives and defining the risk appetite,       credit policies and
                                                                                                             motivate its        restructuring and             systems.
internal controls, compliance, governance and corporate values. The Board         approve loans and
                                                                                  investment above            employees.         recovery of large
sets the tone on professional standards that promotes integrity for itself,          management                                      exposures.
senior management and employees of the Bank.                                             limits.

                                                                                                                                                             Head of Internal           Head of
                                                                                                                        Board Secretary
                                                                                                                                                                 Audit                Compliance
The Directors of the Board, as per the Articles of Association of Commercial
Bank of Dubai, are elected in the General Meeting by secret ballot every
three years. As at 31st December 2018 the Board comprised of 11 non-
executive members.                                                                          Senior management and                     Chief Executive
                                                                                            management committees                         Officer

                                                                                         Management

                                                                                                Executive         Asset & Liability         Credit
The Board of Directors has delegated authority to CBD’s executive                              Committee            Committee             Committee             Project          Operational Risk
management to enter into transactions which are consistent with the Bank's                                                                                    Investment          Management
risk strategy and policy guidelines.                                                        Human Resources         Compliance
                                                                                                                                         Information          Committee            Committee
                                                                                                                                         Security Risk
                                                                                              Committee             Committee
                                                                                                                                          Committee

                                                                                 Slide 22
                                                                                                                                                                                             Slide 22
Corporate Social Responsibility – fulfilling our social commitments
During the year, CBD participated and volunteered in a number of activities demonstrating it’s commitment to
Corporate Social Responsibilities (CSR):

       •   Sponsored Dubai Tour 2018 and is honored to be participating as the Blue Jersey Sponsor.
       •   Sponsored Jabel Ali horse race for season 2017/2018.
       •   Participated in the 18th edition of the Careers UAE Exhibition held at the Dubai World Trade Centre.
       •   Participated in the 2018 Humanitarian Work Day during Ramadan, encouraging bank staff to participate in
           volunteering activities.
       • Participated in the 2018 World Thinking Day at Ras Al Khaimah.
       • Volunteered at Al Noor Training Center for persons with disabilities.
       • Attended the “Happiness and wellbeing in the work field Forum 2018” in Dubai with the presence of
           H.E. Ohoud Al Roumi, Minister of Happiness.

 The four elements of CBD’s CSR framework:

                        The Bank has established and adopted policies and                                The Bank proactively implements the emiratization initiative to recruit,
 Governance and         procedures for governance, risk management, professional                         train and develop as well as retain Emirati staff at all levels. The Bank also
  Transparency                                                                         Employees
                        ethics and code of conduct, compliance and AML, security                         proactively seeks and addresses employee concerns through various
                        and data protection, consumer protection and product                             channels, including the Employee Engagement Survey, imparts training
                        responsibility.                                                                  and nurtures career development for all employees, ensures health and
                                                                                                         safety of all stakeholders in all its premises, and has extended various
                                                                                                         benefits and measures to boost staff welfare.

                        The Bank promotes awareness of social accountability                             The Bank supports and participates in creating awareness of
                        amongst its partners and suppliers, extends philanthropy                         environmental issues, has inducted CSR into its core business i.e. lending,
                                                                                       Environment and
                        generously for the needy, supports and participates in                           by extending credit facilities to green projects and has implemented
  Society and Culture   creating awareness of issues concerning health, promotes        Sustainability
                                                                                                         internal measures to conserve resources by recycling, reducing, and
                        education and sports among youth, and supports and                               reusing.
                        celebrates the local UAE culture.

                                                                                   Slide 23
                                                                                                                                                                                Slide 23
CBD Awards
  Service Olympian Award
                                                          •   Overall Best Mobile App
  (February 2018)

  Commerzbank AG Excellence in Trade Service              •   Gold Trade Award demonstrating excellence in
  (February 2018)                                             Trade Services

  Banker Middle East                                      •   Best Digital Bank
  (April 2018)                                            •   Best Cash Management Services

                                                          •   Global Finance’s 2018 World’s Best Digital Bank
  Best Online Cash Management Award                           Awards in the Middle East for the
  (September 2018)                                            Corporate/Institutional Digital Bank categories

                                                          •   Dr. Bernd van Linder was bestowed with the
  CEO Middle East Award                                       honor in recognition of his efforts to drive digital
  (September 2018)                                            transformation at CBD which is in line with the
                                                              UAE government’s vision.

  Most Innovative Digital Bank                            •   Most Innovative Digital Bank at the International
  (January 2019)                                              Finance Awards 2018

                                               Slide 24
                                                                                                                     Slide 24
Milestones and Achievements
      Most Innovative Digital Bank -             Collaboration with RTA for                                                     Partnership with PwC to
   International Finance Awards 2018                                                  Banking CEO of the Year Award
                                                     Easy Payment Plans                                                         Foster Digital Innovation

    Grand Prize of the Gold Bonanza         Partnership with Dubai Government to     Best Online Cash Management –        Partnership with Bloom Education for
              Promotion                        Provide Smart Payment Solution                 Global Finance                  Preferred Services to Parents

                                            Quarterly Team and Employee Awards     New branches at Sharjah City Center,
Partnership with RERA for Escrow Services                                                                                 Gold Trade Award from Commerzbank
                                                         Ceremony                    Al Wahda Mall and Al Ain Mall

                                                                                                                                                            Slide 25
United Arab Emirates – the second largest economy in the Arab world
                                              Snapshot of the UAE                                                                                        UAE Stock market indices
• The United Arab Emirates (rated Aa2 by Moody’s) comprises seven
  emirates with Abu Dhabi and Dubai being the largest contributors to its                                           5,700                                                                   DFM                        ADX

  gross domestic product (“GDP”).
                                                                                                                    5,200                                                                                                      4,915
• The UAE benefits from several buffers, including a rapid non-oil growth,
  robust external reserves (estimated at USD 80.70 b)1, and relatively low                                          4,700
  fiscal break-even oil price.
                                                                                                                    4,200
• Abu Dhabi Investment Authority (ADIA) does not disclose its total assets
  under management but the US-based Sovereign Wealth Fund Institute,                                                3,700
  which tracks the industry, estimates ADIA’s total assets at USD 828 b.
• Although oil has been the mainstay of the UAE economy (with 98 b barrels                                          3,200
  of proven oil reserves and a reserves-to-production ratio of 93 years2) and
                                                                                                                    2,700
  continues to contribute significantly to economic prosperity, a determined
                                                                                                                                                                                                                               2,530
  and far-sighted policy of economic diversification has ensured that non-oil                                       2,200
  sectors now account for approximately 65% of the gross domestic product.                                                  2014                  2015               2016                 2017                 2018

   Source: 1International Monetary Fund, UAE Interact; 2 OPEC                                                             Source: Abu Dhabi Securities Exchange, Dubai Financial Market

          Limited Fiscal Deficit to be posted                                        Positive Current Account balances                                                  UAE GDP and Government Debt
                                                                                                                                                                                                                                1,893
                                                                                                                                                                                                                       1,803
                                                                                                                                                                                                               1,721
                                                                                                                                                                                                       1,643
                                                                4.8    13.4                                                                                                            1,512   1,571
                                                                                                                                                                               1,386
                                                                                                                                                             1,315     1,281
 (44.2)   (31.7)     (24.9)   (21.1) (13.1)   (7.9)   (2.3)
                                                                                                    80.3    79.5                           76.1
                                                                                                                   73.0     72.7    72.7
                                                                              64.5           64.7

                                                                0.3%   0.7%
                                                   (0.1%)                                            5%
                                     (0.8%) (0.5%)                            5%
                                                                                             5%
                                                                                                            5%      4%      4%       4%     4%
                     (1.8%) (1.4%)                                                    17.9
                                                                                                                                                                       20.7%
          (2.5%)                                                                                                                                                               19.5%   19.0%   19.3%   19.3%   19.1%   19.0%    18.7%
                                                                                                                                                             18.7%
(3.4%)                                                                                 1%

 2015     2016       2017     2018F 2019F 2020F 2021F 2022F 2023F             2015    2016   2017   2018F 2019F 2020F 2021F 2022F 2023F                      2015      2016    2017    2018F   2019F   2020F   2021F   2022F    2023F

                   Surplus (AEDb)                 As % of GDP                          Current Account Balances (AEDb)             As % of GDP                       Nominal Gross Domestic Product (AEDb)       Govt. debt as % of GDP

     Source: International Monetary Fund, April 2018                          Source: International Monetary Fund, April 2018                               Source: International Monetary Fund, April 2018

                                                                                                              Slide 26
                                                                                                                                                                                                                               Slide 26
UAE Economic Update – mixed business conditions with weaker oil prices
                        UAE GDP growth                                                  UAE purchasing managers index                                                    UAE CPI & inflation (%)

                                                                       60                                                                                                                     1.3%
                                                                                                                                                                                  108.62              110.07
                                              3.66%       3.62%                                                                                               100.00

         2.99%                   2.91%                                 55
                                                                                                                                              54

                                                                       50

                     0.80%                                             45

                                                                       40
         2016        2017        2018P        2019P       2020P         Jan-17                 Jul-17          Jan-18         Jul-18          Jan-19           2014              Nov-17              Nov-18

                               5 Year CDS                                                  UAE and Dubai population                                                             Brent oil
            bps                             DXB        AUH                  11                                                         10.4
                                                                                   Million                                                    UAE      140          USD / bbl
                                                                            10                                      9.6
                                                                                                                                                                    114
                                                                             9     8.3                                                                 120
                                                                             8                                                                         100
                                                                             7                                                                                                                                 83
                                                               134           6                                                                         80
                                                                             5
                                                                                                                                                       60
                                                                             4                                                         3.1
                                                                  70                                                                                                                                                54
                                                                             3                                      2.4                       Dubai    40
                                                                                         2.0
                                                                             2
                                                                                                                                                       20                        29
                                                                             1
                                                                             0                                                                           -
Jan-16      Jul-16    Jan-17     Jul-17     Jan-18    Jul-18      Jan-19         2010                   2014              2017                               2014       2015    2016        2017     2018

 Source: IMF, Emirates NBD, investing.com, fcsa.gov.ae, Bloomberg
                                                                                                                   Slide 27
                                                                                                                                                                                                               Slide 27
Dubai – a pivotal hub in the global economy
                                    Snapshot of Dubai                                                                                       Foreign Trade
                                                                                                                                                                                                                    AEDb
                                                                                                  Exports & Re-Exports               Imports
 • The Emirate of Dubai is the second largest Emirate in the UAE after the
                                                                                                                                                            545         574                     536
   Emirate of Abu Dhabi. Dubai is situated on the west coast of the UAE in                                                                      502                                 514                     518
                                                                                               442                                  442
   the south-western part of the Arabian Gulf.                                                             319         364                                                                                              348
                                                                                                                                          306         301         272         288         295         311
                                                                                                                             259
                                                                                         171         170         212                                                                                              216
 • Reflecting the Emirate’s strategic geographic location, rising levels of
   international trade and the government’s long-standing strategy of
                                                                                          2008        2009        2010        2011         2012        2013        2014        2015        2016       2017          9M18
   positioning Dubai as a trading centre, Dubai’s GDP has increasingly
                                                                                         Source: Dubai Statistics Centre
   shifted away from reliance on the oil and gas sectors.
                                                                                                                                          Growth in Economy
 • Dubai’s diversified economy has exhibited robust growth levels in recent
   years on the back of government initiatives and policies which were                                                        Real GDP (AED b)                    Real GDP Growth Rates (%)
                                                                                                  17.5%
   aimed at improving the economic and business environment.                                                                                                                              4.1%        2.7%          2.8%
                                                                                                                                            3.0%       4.1%        4.6%       3.8%
                                                                                                         3.5%     (4.3%)
                                                                                                                               3.5%

                                Dubai GDP by sector (2017)                                  283          293       280          290         299         311          325       337         366         379          389

                                                                                           2007          2008      2009        2010        2011        2012         2013       2014        2015       2016          2017
                       Others                           Wholesale, Retail Trade           Source: Dubai Statistics Centre
                             19%                        and Repairing Services
                                                  27%                                                                                Tourism remains robust

                                                                                                     Number of Guests (million)
      Real Estate 7%
                                                                                                                                                       14.9                     15.8
                                                                                                  13.2                       14.2
                                                                                                                                                                                                             11.6

                       10%
  Financial Services                               16%     Transportation, Storage
                                                           and Communication
                             5%
              Hospitality
                                   6%     9%                                                      2014                       2015                      2016                     2017                        9M18
                           Construction   Manufacturing
 Source: Dubai Statistics Centre                                                           Source: Dubai Statistics Centre
                                                                                     Slide 28
                                                                                                                                                                                                                  Slide 28
Dubai Economic Update – softening real estate prices and general business conditions
                                                  Dubai GDP growth                                                                                                 Dubai hospitality
                                                                                                           4.10%
                                                                                                                                                                              (6.1%)
                                                                                                                                               Oct-17
                                                                                3.30%                                                                                   730
                                                                                                                                               Oct-18                                  685                (10.2%)

             2.70%                          2.80%                                                                                        AED
                                                                                                                                                                                                       574
                                                                                                                                                                                                                   515

                                                                                                                                             (4.3%)

                                                                                                                                        79              75

             2016                              2017                             2018P                      2019P                         Occupancy %                   Average daily rate        Revenue per available room

                                       Dubai airport passenger traffic                                                                    UAE real estate – November 18 versus November 17
          2017          2018
                                                                                                                                                      Abu Dhabi                                       Dubai
          8.0 8.0                   7.9 7.6 7.6                         8.1 8.2 8.2 8.4                               7.9
                              7.5                                                         7.2 7.2
                    6.9 6.9                       6.9 6.6         6.8                               6.9 7.0 7.0 6.9
                                                            6.1
Million

                                                                                                                                               (6.4%)

                                                                                                                                                                                             (8.3%)

                                                                                                                                                                                                         (10.1%)
                                                                                                                                        Sale prices          (10.5%)
           Jan       Feb       Mar       Apr       May       Jun          Jul     Aug      Sep       Oct     Nov       Dec
                                                                                                                                        Rentals

Source: Dubai Economic Report, STR Global, Dubai Airports, Reidin property index
                                                                                                                             Slide 29
                                                                                                                                                                                                                     Slide 29
UAE Banking Sector – stable and resilient
                        Snapshot of UAE banking industry                                                                        Key industry indicators

 • As of June 2018, the UAE banking industry, which is the largest banking                     AEDb                                  2014        2015          2016        2017     October-18
   industry in the GCC, comprised of 50 banks, 23 of which were                                    Total assets                      2,288       2,459         2,593       2,694      2,841
   domestically-incorporated.
                                                                                                   Customer deposits                 1,421       1,472         1,563       1,627      1,721
                                                                                                   Loans and advances                1,361       1,466         1,554       1,580      1,646
 • The industry is regulated by the UAE Central Bank, which was
   established in 1980. The UAE Central Bank has a track record of                                 Specific provision                 72          73            79             80       89

   providing systemic support to the banking industry, as and when                                 General provision                  24          27            29             30       34
   needed.                                                                                         Loan to deposit (%)               95.8        99.6          99.4        97.1        95.7
                                                                                                   CAR (%)                           18.2        18.3          18.9        18.9       18.2*
 • As of October 2018, total loans and advances increased by 4.2% over                             Tier 1 ratio (%)                  16.2        16.6          17.3        17.4       16.8*
   December 2017 and deposits increased by 5.8%. The market loan to
                                                                                                   Source: Central Bank of the UAE
   deposit ratio stood at 95.7% as of October 2018.                                                *Sep 18

                        Improving industry asset quality                                                          Government deposits as % of total deposits
                                                                                                      The UAE banking system is one of the least dependent amongst GCC countries on
                                                       95%          96%          94%                  government deposits making it relatively less vulnerable to a decline in liquidity
                                          88%

                                                                                                                      38.0%
                              57%
    44%          48%                                                                                                                                                   28.9%
                                                                                                                                     22.5%
                                                                                                                                                       16.4%
                                                                                                     12.4%                                                                          12.3%

   10.6%        10.4%        9.2%         5.6%         5.0%         5.0%         5.3%

    2011        2012         2013         2014         2015         2016         2017                Kuwait             Qatar     Saudi Arabia          UAE            Oman         Bahrain
           NPL Ratio             Loan Loss Coverage

Source: Moody’s Financial Institutions: Banking System Outlook – United Arab Emirates         Source: Moody’s Financial Institutions GCC Banks: Oman and Bahrain most vulnerable to lower
                                                                                              oil prices

                                                                                        Slide 30
                                                                                                                                                                                      Slide 30
UAE Banking Industry – underlying system credit and deposit appetite has been robust
                                           Gross loans and deposits                                                                               Volume growth – December 17 to October 18
               Gross loans            Deposits                                       5.8%                                           Gross loans       Deposits
                                                                             4.2%                                                                                                                        6.2%
AED billion

                                                                                                                                                         5.8%                               5.7%
                                                                                                  1,721
                                                                         1,627            1,646
                                         1,554     1,563        1,580
              1,466   1,472
                                                                                                                                             4.2%

                 2015                        2016                     2017                   Oct-18                                                Market                                          CBD

                                                  CBD market share                                                                                3 Month EIBOR and UAE loan to deposit ratio
                Gross loans             Deposits                                                  3.2%                              3.00%              3 Month EIBOR                                 2.84%      110.0%
                                                                                                                                                       LDR                                                      108.0%
                                                                                                  3.0%                              2.50%

                                                                                                                                                                                                                         Loan to deposit ratio
                                                                                                                                                       FED 25 bps hike                                          106.0%
                                                                                                                                    2.00%                                                                       104.0%

                                                                                                                  3 Month EIBOR %
                                                                                                                                                                                                                102.0%
               2.6%                                                                                                                 1.50%
                                                                                                                                                                                                                100.0%
                                                                                                                                    1.00%                                                                       98.0%
               2.3%
                                                                                                                                                                                                                96.0%
                                                                                                                                    0.50%
                                                                                                                                                                                                     95.7%      94.0%
                                                                                                                                    0.00%                                                                      92.0%
  Jul-14        Jan-15       Jul-15      Jan-16     Jul-16   Jan-17     Jul-17   Jan-18     Jul-18    Jan-19                             Dec-15      Jun-16      Dec-16   Jun-17   Dec-17   Jun-18       Dec-18

Source: Central Bank of the UAE                                                                                Slide 31
                                                                                                                                                                                                                    Slide 31
You can also read