Management Presentation Deutsche Bank 23rd European Leveraged Finance Conference
←
→
Page content transcription
If your browser does not render page correctly, please read the page content below
Management Presentation

Deutsche Bank 23rd European
Leveraged Finance Conference
5 JUNE 2019
DEUTSCHE BA NK 23 RD A NNUA L EUROPEA N LEVERA GED FINA NCE CONFERENCE | 5 JUNE 2019

Disclaimer

This presentation and any other presentation (the “Presentation”) has been prepared by Selecta Group B.V. (the “Company” and together with its subsidiaries, “we,” “us” or the “Group”) solely for informational purposes and
has not been independently verified. The Company reserves the right to amend or replace this Presentation at any time. This Presentation is valid only as of its date, and the Company undertakes no obligation to update the
information in this Presentation to reflect subsequent events or conditions. This Presentation may not be redistributed or reproduced in whole or in part without the consent of the Company. Any copyrights that may derive
from this Presentation shall remain the sole property of the Company.

These materials do not constitute or form part of, and should not be construed as, any offer for sale or subscription of, or solicitation of any offer to buy or subscribe for any securities of the Company in any jurisdiction.

No representation, warranty or undertaking, express or implied, is made as to, and no reliance should be placed on, the fairness, accuracy, completeness or correctness of the information or the opinions contained in this
Presentation. The Company, or any of its affiliates, advisors or representatives, shall have no liability whatsoever (in negligence or otherwise) for any loss howsoever arising from any use of the Presentation or its contents. The
information contained in the Presentation does not constitute investment advice.

The market and industry data and forecasts included in this Presentation were obtained from internal surveys, estimates, experts and studies, where appropriate, as well as external market research, publicly available
information and industry publications. The Company and its affiliates, directors, officers, advisors and employees have not independently verified the accuracy of any such market and industry data and forecasts and make no
representations or warranties in relation thereto. Such data and forecasts are included herein for information purposes only and no reliance should be placed on, the fairness, accuracy, completeness or correctness of the
information in this Presentation, the opinions expressed herein or any other statement made or purported to be made in connection with the Company or the Group, for any purpose whatsoever. No responsibility, obligation or
liability is or will be accepted by the Company or its affiliates or their respective directors, officers, employees, agents or advisers in relation to this Presentation. To the fullest extent permissible by law, such persons disclaim
all and any responsibility or liability, whether arising in tort, contract or otherwise which they might otherwise have in respect of this Presentation.

Third-party industry publications, studies and surveys generally state that the data contained therein have been obtained from sources believed to be reliable, but that there is no guarantee of the accuracy or completeness of
such data. While the Company believes that such publications, studies and surveys have been prepared by a reputable source, the Company has not independently verified such data. In addition, certain of the industry and
market position data referred to in the information in this Presentation has come from the Company's own internal research and estimates, and their underlying methodology and assumptions may not have not been verified by
any independent source for accuracy or completeness and are subject to change without notice. Accordingly, undue reliance should not be placed on any of the industry or market position data contained in this Presentation.

This Presentation includes “forward-looking statements” that involve risks, uncertainties and other factors, many of which are outside of the Company’s control and could cause actual results to differ materially from the
results discussed in the forward-looking statements. Forward-looking statements include statements concerning the Company’s plans, objectives, goals, future events, performance or other information that is not historical
information. All statements other than statements of historical fact referred to in this Presentation are forward-looking statements. Forward-looking statements give the Company's or the Group's current expectations and
projections relating to its financial condition, results of operations, plans, objectives, future performance and business. These statements may include, without limitation, any statements preceded by, followed by or including
words such as "target," "believe," "expect," "aim," "intend," "may," "anticipate," "estimate," "plan," "project," "will," "can have," "likely," "should," "would," "could" and other words and terms of similar meaning or the negative
thereof. Such forward-looking statements, as well as those included in any other material, are subject to known and unknown risks, uncertainties and assumptions about the Company, its present and future business strategies,
trends in its operating industry and the environment in which it will operate in the future, future capital expenditure and acquisitions. In light of these risks, uncertainties and assumptions, the events in the forward-looking
statements may not occur or the Company's or the Group's actual results, performance or achievements might be materially different from the expected results, performance or achievements expressed or implied by such
forward-looking statements. None of the Company, its affiliates or their respective directors, officers, employees, agents or advisers undertake to publicly update or revise forward-looking statements to reflect subsequent
events or circumstances after the date made, except as required by law.

This Presentation contains financial information regarding the businesses and assets of the Company and the Group. Such financial information may not have been audited, reviewed or verified by any independent accounting
firm. Certain financial data included in this Presentation consists of “non-IFRS financial measures.” These non-IFRS financial measures, as defined by the Company, may not be comparable to similarly titled measures as
presented by other companies, nor should they be considered as an alternative to the historical financial results or other indicators of the Company’s financial position based on IFRS. Even though the non-IFRS financial
measures are used by management to assess the Company’s financial position, financial results and liquidity and these types of measures are commonly used by investors, they have important limitations as analytical tools, and
you should not consider them in isolation or as substitutes for analysis of the Company’s financial position or results of operations as reported under IFRS. The inclusion of financial information in this Presentation should not be
regarded as a representation or warranty by the Company, or any of its affiliates, advisors or representatives or any other person as to the accuracy or completeness of such information’s portrayal of the financial condition or
results of operations of the Group and should not be relied upon when making an investment decision.

This Presentation does not constitute or contain any investment, legal, accounting, regulatory, taxation or other advice.

Due to rounding, numbers presented through out this and other documents may not add up precisely to the totals provided and percentages may not precisely reflect the absolute figures.

                                                                                                                                                                                                                                             2
Presenters
David Flochel   Gabriel Pirona

    CEO             CFO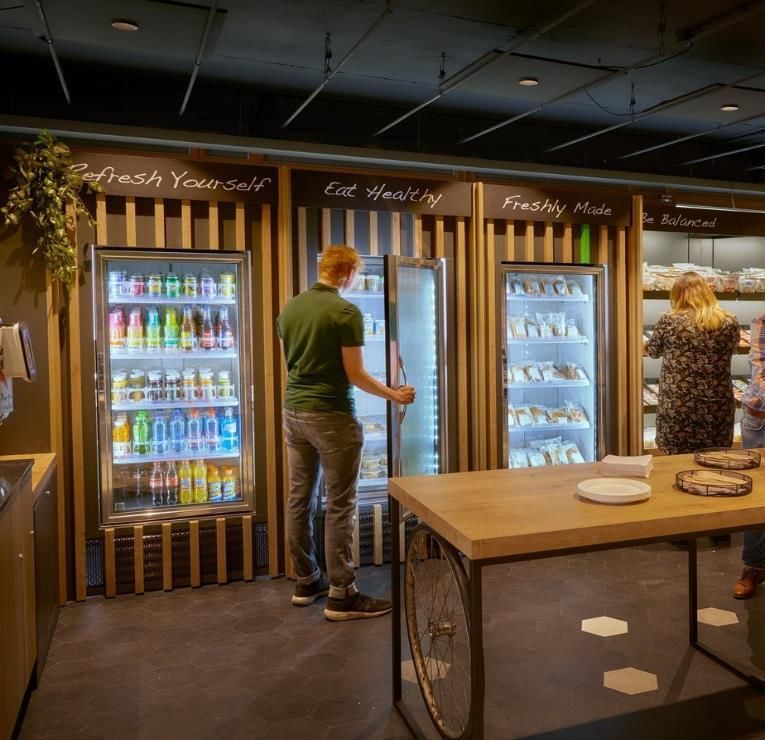
Agenda
01 – H1 FY19 Highlights

02 – Selecta Today

03 – Strategic Initiatives

04 – Financials

05 – FY19 Outlook
01
H1 FY19 Highlights
DEUTSCHE BA NK 23 RD A NNUA L EUROPEA N LEVERA GED FINA NCE CONFERENCE | 5 JUNE 2019

01         H1 Highlights
                  Continued strong performance in H1 FY19

                                             Financial highlights

            • Revenue1                                                                                                            €812.4m, up 6.4% vs H1 FY18
                                                                                                                                                                                           ✓
                 Organic revenue growth up 1.9% YoY in H1FY19 vs 1.3% in H1FY18

                 Organic growth up 5.5% YoY in H1 FY19 vs 1.4% YoY growth
                 in H1 FY18, excluding turnaround markets of France and UK

            • Underlying EBITDA1                                                                                                  €133.0m, up 12.2% vs H1 FY18
                                                                                                                                                                                          ✓
                 Uplift achieved alongside continued investment in growth
                 initiatives and the benefit of the synergy programme

            • Underlying EBITDA1 less net capex                                                                                   €62.5m, up 5.3% vs H1 FY18                              ✓
                 Increase delivered whilst continuing to invest in future growth

     1   At constant foreign currency rates. Constant foreign currency rates applied: CHF/EUR 1.15; SEK/EUR 9.65; GBP/EUR 0.88

                                                                                                                                                                                                                6
DEUTSCHE BA NK 23 RD A NNUA L EUROPEA N LEVERA GED FINA NCE CONFERENCE | 5 JUNE 2019

01        H1 Achievements
             Continued strong performance in H1 FY19

                      Strategic priorities                  H1 progress

                                                       •   Retention rate reached 95.8% in Q2 FY19, demonstrating benefits of focused customer retention
     01         Sales Excellence                           programme
                                                       •   1.8% net gains LTM March 2019

                                                       •   Launched category management and pricing programmes across portfolio using segmentation
     02           Pricing / SMD                            and location-specific pricing

                  Operational                          •   Continued investment in technology and systems to increase efficiencies
     03                                                •   Awarded the 2019 Prize for Operational Excellence by MEDEF in partnership with AFQP in France
                  Excellence                               and ‘Best Coffee Supplier’ in Custice’s (Sweden) annual satisfaction survey awards

                 Technology &
 04                                                    •   Continued successful roll-out of MicroMarkets concept
                  Innovation                           •   Testing newly developed touchscreen technology for unattended self service machines

                    Asset                              •   Proactive portfolio management and refurbishment to extend machine lifecycle
 05                                                    •   Active re-siting of underperforming machines
                  Management

                                                       •   M&A programme on track to deliver 3% to 5% annualised growth
     06                M&A                             •   Good pipeline of further opportunities

                                                       •   Focus on enhanced employee engagement programme
                                                       •   Roll-out of quality service training programmes
     07               People                           •   Highly experienced leadership hire: Andy Ransom, CEO of Rentokil plc, appointed Non-
                                                           Executive Director

                                                                                                                                                                7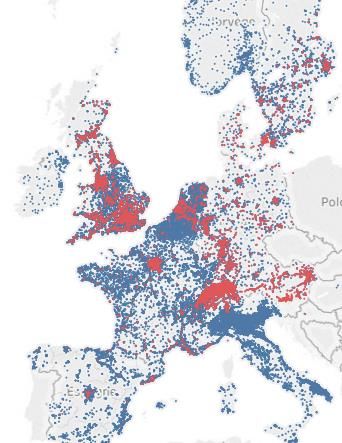
02
Selecta Today
DEUTSCHE BA NK 23 RD A NNUA L EUROPEA N LEVERA GED FINA NCE CONFERENCE | 5 JUNE 2019
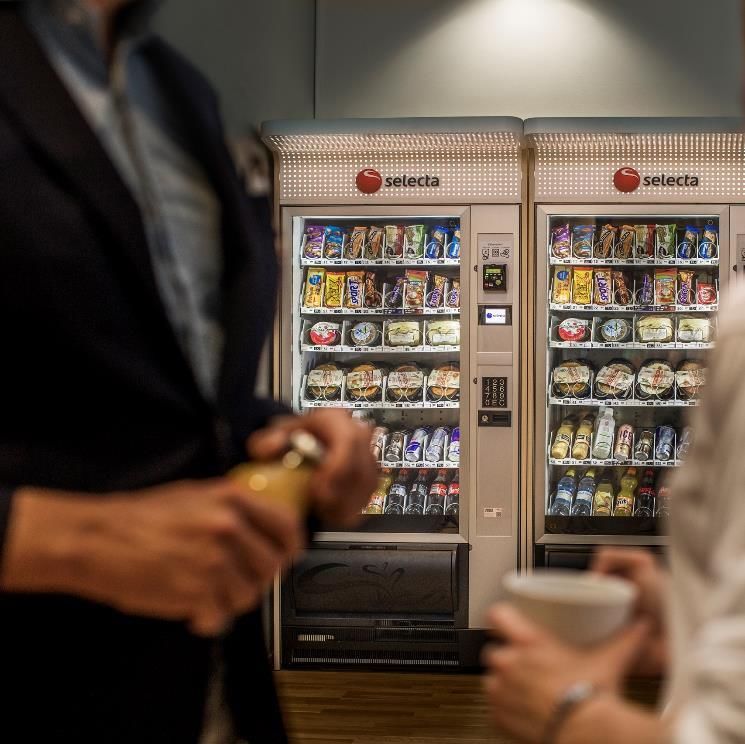
02 The Leading Route Based Unattended Self-Service Retailer in Europe
Who we are What we sell Where we sell it
Other1 10%
• Leading route based unattended Coffee/hot Workplace / Private Segment 49%
drinks 60%
self-service retailer with an installed base of % of FY18 revenue
460k machines serviced by
Impulse 30%
unique logistics network
• #1 or #2 position in 10 core markets, with
typical share of 10-15%
• 3.5x larger than second largest player in
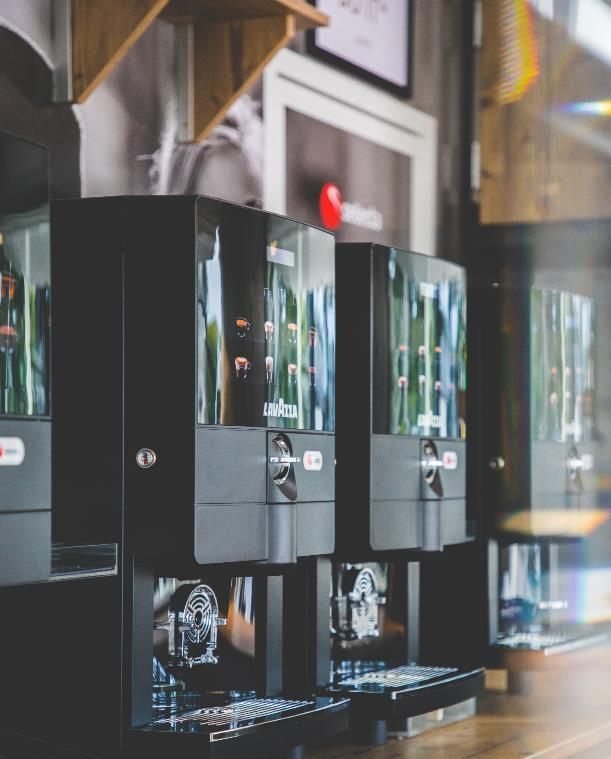
Europe Unique Coffee Brand Portfolio
• Operations in 16 countries covering c.90% of
European GDP and c.75% of the population On-the-Go / Public Segment 35%
Global Premium coffee partnerships
% of FY18 revenue
• Serving over 10 million consumers daily via
more than 3,800 routes
Impulse Offering
• Solid financial position, with long-term
contracts up to 10 years, underpinned by
high customer retention levels and organic
revenue growth ahead of the broader
addressable convenience market Snacks Cold drinks
Trade 16%
% of FY18 revenue
Healthy options Fresh food
1Includes sale of machines to leasing partners, other goods and 3rd party servicing
(mainly technical services)
9DEUTSCHE BA NK 23 RD A NNUA L EUROPEA N LEVERA GED FINA NCE CONFERENCE | 5 JUNE 2019
02 Comprehensive Product & Service Offering Tailor Fit Customer & Consumer Needs
Delivering High Levels Customer Satisfaction
Coffee and hot
Wide drinks accounts
variety of for c.60%(1) of
product total revenues
Coffee / Hot drinks Cold drinks Trading (including coffee
offering Snacks Healthy options Fresh food trading)
Diversified 3rd Party Private Label Local Specialties Premium Global Brands
portfolio of
attractive
brands
covering all
price points
Full Service Partial Service Supply / Technical
Ability to
Offer a • Comprehensive package including installation • Targets smaller office environments • Provide machine, ingredients, consumables
(no service element)
Range of of vending machines (Selecta owns the • Provide machine, ingredients and consumables
machine), regular filling and cleaning, cash (and receives fee/ vending rent) • Offer technical support services under
Service • Client responsible for cleaning and refilling separate contracts negotiated with client
collection and technical maintenance
Capabilities machine (external filling) • Machine is sold to customer
Product quality often cited as one of the key reasons for
Value to choosing Selecta
Selecta average score: 3.9 / 5
premium
Perceived Selecta coffee quality vs. competitors
offering with Great Taste
unique Credentials 11 39 36 14
capabilities at Fresh brews
60% 40% 20% 0% 20% 40% 60%
Instant Bean-to-cup / Exclusive premium concepts
the top-end… Capsules with fresh milk Worse Equal
One of
the best
The best
Source: OC&C report
1Share of FY18 Revenue.
10DEUTSCHE BA NK 23 RD A NNUA L EUROPEA N LEVERA GED FINA NCE CONFERENCE | 5 JUNE 2019
02 Our Route-Based Model
Scale Driven Business Model Creating Attractive Economics
1
Procurement of Machines
and Merchandise
Coffee Roaster, Technical • Selecta procures machines and
Operated spare parts from machine
Cold Drinks & Warehouse & manufacturers and merchandise
Points of Sale
Snacks Suppliers Finishing Centre from FMCG companies
• Company procures centrally
and locally
2
Installation
Product • A technician delivers and
installs the machine
at customer’s site
3 • All relevant technology is set
Installation up and functioning and the
Filling and Cleaning
Merchandiser Cleaning Maintenance Technician concept is configured for the
• Merchandisers visit machines client’s requirements
regularly to refill and clean Refills Replacement
• Data is used to optimise the Repairs
product range within a given 4
machine and telemetry ensures
visits are only scheduled when Maintenance and Repair
machine actually needs refilling
Customer sites • Technicians visit machines to
repair them or perform regular
maintenance
• Technicians increasingly use
telemetry data to ensure quick
and timely visits as soon as
needed
• Scale brings high density of sites
• Enhances dynamic route planning
• Drives efficient and high quality customer service
11DEUTSCHE BA NK 23 RD A NNUA L EUROPEA N LEVERA GED FINA NCE CONFERENCE | 5 JUNE 2019
02 Recent Business Transformation Enabled by Focused Execution
A rich history underpinned by a recent accelerated transformation following acquisition by KKR in 2015
Culture focused on delivery of transformation milestones to deliver above market growth
Q4 2018 Q2 2019
Q4 2017 Q2 2018 • Acquisition of Express Vending
• Continued strong revenue FY’19
• Successful Refinancing • 16 countries in Europe with 460,000 and EBITDA growth vs prior
• Acquisition of Pelican Rouge
points of sale year
• Kick off of integration and • Acquisition of Gruppo Argenta
• Renewal of Nestle Starbucks contract – • Awarded Operational
synergies implementation • Integration of Spain
On the Go Excellence Prize by MEDEF
• Sale of Selecta Finland
• Expansion of MicroMarkets outside Italy in France
• Sale of Custom Pack as non core
• Strong revenue and EBITDA FY’18
• Launch of integration plan • Start of integration in France
growth vs prior year
• Integration of UK, Benelux, Norway • Awarded “Outstanding supplier
• Awarded “Best Coffee
of the year” by Shell
Q1 2018 Supplier” by Custice in Sweden
Q3 2018
Q1 2019
AUG ’18
Acquisition FEB ’18
by SEP ’17
FY’17
FY’16
2015
Award Jan ‘19
AWARDED
Two new premium CUSTICE 2019
“BEST CUSTOMER
partnerships COFFEE SATISFACTION
SUPPLIER” SURVEY
SWEDEN
12DEUTSCHE BA NK 23 RD A NNUA L EUROPEA N LEVERA GED FINA NCE CONFERENCE | 5 JUNE 2019
02 Only Pan-European, Geographically Diversified Unattended Self-Service Retailer
Recent transformative transactions have reinforced #1 position in Europe
Selecta (FY16) Selecta (FY18)2
Central1 North1 South, UK & Ireland1
Revenue
€736.4m €1,518.4m
Sweden Finland
Norway Underlying €115.8m €245.0m
EBITDA
(margin)3 (17.8%) (18.1%)
Denmark Market
share
c. 6% share of c.10%, #1 or #2 in
Netherlands European market 10 core markets
UK Germany
Ireland
Belgium
Luxembourg # of POS
c. 137k c.460k
Austria
France Switzerland
# of
consumers
served c. 6 million Over 10 million
Italy
per day
Spain
# of
employees c. 4,200 c. 9,700
1 North includes Netherlands, Norway, Sweden, Denmark, Finland, Belgium, Luxembourg and Roaster; Central includes Switzerland, Liechtenstein, France, Germany, Austria;
South, UK and Ireland includes UK, Ireland, Spain, Italy and Express Vending.
2 FY16 &FY18 numbers are a pro forma amalgamation of Selecta, Pelican Rouge, and Argenta and excluding Custompack (disposed of in FY18) – all at actual rates
3 Underlying EBITDA margin is % of Net Sales
13DEUTSCHE BA NK 23 RD A NNUA L EUROPEA N LEVERA GED FINA NCE CONFERENCE | 5 JUNE 2019
02 Well Positioned to Take Advantage of Premium Coffee
& On-the-Go Consumption Growth
Supportive tailwinds Addressable convenience and coffee market growth1
(€ in billions)
47.1
GDP 2.5
40.5
36.4 2.3 12.5
MACRO Out-of-Home Eating 2.4
11.1
2.6
10.3
Workforce 2.2
2 11.3
9.1
7.2
15.7 18.2
Coffee Lifestyle 14.5
CONSUMPTION 2017A
Premiumisation 2012A 2022E
PREFERENCES
Packaged food
Health Consciousness Convenience food services Vending (public and semi-public)
Vending (including OCS) Canteens (excluding lunch)
(€ in billions)
Cashless
19.0
TECHNOLOGY Special Features (e.g. Touchscreen)
16.0
14.0
Telemetry
2012A 2017A 2022E
Source: OC&C analysis, Euromonitor Coffee
1 Focus countries are: France, Germany, Italy, Netherlands, Sweden, Switzerland, Spain and the United Kingdom
1403 Strategic Initiatives
DEUTSCHE BA NK 23 RD A NNUA L EUROPEA N LEVERA GED FINA NCE CONFERENCE | 5 JUNE 2019

03        Our Strategic Initiatives Driving Growth and Returns
            Key Pillars Underpin Recent Track Record and Robust Topline Growth

                                                              •   Existing customer retention
     01            Sales Excellence                           •   New business wins

                                                              •   Category management
     02               Pricing / SMD                           •   Smart pricing implementation

                      Operational                             •   Route based model
     03                                                       •   Synergy achievement
                      Excellence

                     Technology &                             •   eWallet, cashless
     04                                                       •   New product concepts – MicroMarkets
                      Innovation

                         Asset                                •   Focus on machine clean up and capital discipline
     05                                                       •   Leverage capex free model and maximise refurbishment capabilities
                      Management

                                                              •   Natural consolidator in a fragmented market structure
     06                    M&A                                •   Internal capabilities

                                                              •   Strong culture of excellence and focus on customer satisfaction
     07                   People                              •   Ongoing investment in training programmes

                                                                                                                                                           16
DEUTSCHE BA NK 23 RD A NNUA L EUROPEA N LEVERA GED FINA NCE CONFERENCE | 5 JUNE 2019
03 Focused Drivers of Organic Growth Sales Excellence
Continued progress in H1 FY19
High Retention Rates Continued Pipeline Growth (€m)
% retention rates1 Net sales
95.8 130.7
129.0
119.5
20.2
94.4 26.3
28.7
93.6 28.4
22.6
28.5
92.5
80.2 82.1
62.3
2,3
Sep '172 Mar '18 Sep '18 Mar '19 Oct-17 Sep-18 Mar-19
Negotiation Agreed Signed
• Strong retention across all countries, with particularly high • Focused approach on sustainable pipeline, new offerings and
levels in Nordics and Belgium value proposition
• Continued benefit from focused customer retention • Benefits from sales force training and coaching programmes
programmes and improved operational performance across all major markets
• H1 FY19 clients retained: • H1 FY19 notable wins include:
1 LTM to end of month
2 Includes estimations for pre-acquisition Pelican Rouge losses
3 H1 losses have been annualised for legacy Pelican Rouge entities
17DEUTSCHE BA NK 23 RD A NNUA L EUROPEA N LEVERA GED FINA NCE CONFERENCE | 5 JUNE 2019
03 Focused Drivers of Organic Growth Sales Excellence
Continued progress in H1 FY19
Continued Net Growth1 Organic Portfolio Turnaround2,3
Sep '17 Mar '18 Sep '18 Mar '19 Q4 FY17 Q2 FY18 Q4 FY18 Q2 FY19
5.8% 6.1% 6.0%
5.3%
-4.2%
-5.6%
-6.4%
-4.2% 464 464
-5.6%
-6.4%
-7.5% 462
460
Gains ARO Losses ARO Net Growth
• Investment in people and training delivering net growth • Accelerating cashless and telemetry rollouts in France and UK following
solid results of 2018 installs
• Increase in business supported by international framework
agreements • Proactive machine park management throughout transitional period
• Net growth in most markets, including the UK • Improved retention rates leading to portfolio net growth
• Two consecutive quarters of portfolio net growth
• Average of six month lag between contract losses/gains and machines in
operation
1 LTM to end of month
2 Number of machines include Express Vending on a pro forma basis through all periods
3 Portfolio adjusted for the one-time disposal of Nespresso machines in France and specific portfolio management in Italy’s OCS channel (reduction of < 1.5€ SMD machines)
18DEUTSCHE BA NK 23 RD A NNUA L EUROPEA N LEVERA GED FINA NCE CONFERENCE | 5 JUNE 2019
03 Pricing / SMD – Significant Opportunity Pricing / SMD
Clear Program Leading to Early Results
Dedicated Programme Sales1/Machine/Day (€)
Significant Opportunity 11.3
11.2
Dedicated Programme Lead
Category
Category
Management B2B2C B2B
Management
Coffee / Hot Pricing Pricing
Impulse
Drinks
Right product in Accelerate Increase customer Increase price to
right machine premium coffee prices at machine B2B customer
concepts rollouts
H1 FY18 H1 FY19
• Programme led by a Central Programme Coordination with strong local capabilities and support
• General pricing opportunities by following price / elasticity principles and a systematic approach
• Price differentiation by applying segmentation and deploying segment-specific and location-specific pricing strategy
• With telemetry, now equipped to better monitor and analyse sales data and unlock pricing capabilities including dynamic pricing
1Revenue is before payment of vending fees and excludes Express Vending in both periods
19DEUTSCHE BA NK 23 RD A NNUA L EUROPEA N LEVERA GED FINA NCE CONFERENCE | 5 JUNE 2019
03 Operational Excellence – Synergies Operational
Excellence
€75m of Synergies across Procurement, SG&A and Operations
On track to achieve €75m annualised saving by the end of calendar year 2020
• Over-delivery and validation of early stage ideas (ML0 and ML1 potentials) enabled early upgrades of synergy programme from €52.5m in January
2018 to €60m in February 2018 and €75m in May 2018
• Synergy programme continues on track to deliver according to the latest plan, reaching €60m run rate by Q2 FY19
Phase of Phase of Saving
Cost Synergy Categories and Savings Implementation Realisation
• Further savings
1 identified as new ML0
ML0 & ML1
and ML1 initiatives
implemented
1• Procurement synergies
Procurement
In-sourcing coffee
€30m 2• production
Consolidation of country
1• HQs and Group HQ
€75m SG&A
Optimisation of overhead
€12m 2• and corporate cost
1• Increase in density
Operations
€33m
2• Best Practice transfer
20DEUTSCHE BA NK 23 RD A NNUA L EUROPEA N LEVERA GED FINA NCE CONFERENCE | 5 JUNE 2019
03 Telemetry – Austrian Case Study Operational
Excellence
Confirmed Benefits & Scalability – Roll-out Underway Across Multiple Geographies
Technology &
Innovation
Austria Selected as Test for Scalability
• Mix of public and private, impulse & coffee
• Challenging geography & legacy points of sale base
• Flat organisation, reliant on group project support
Before ... ... After
• Static route plans based on • Daily, dynamic route planning
experience based on real-time forecasts
• Product assortment issued on • Online management of assortment,
paper, high complaints due to real-time stock control
stock-outs
• Full reporting based on telemetry
• High admin workload, lengthy data with ~100% accuracy
unrealiable closing process
• Centralised pre-kitting in core area
• 63 stock points for 37 refillers (200km) + 23 local stocks
Inventory handling
+80% fill rate per +10% SMD public
time cut by 60%
route (>30% route +7% SMD private
Waste reduced by
savings)
50%
Largest Lightspeed Pre-Kitting Line in Europe
21DEUTSCHE BA NK 23 RD A NNUA L EUROPEA N LEVERA GED FINA NCE CONFERENCE | 5 JUNE 2019
03 Aims to Set Industry Standard for Innovation Technology &
Innovation
Focus on Leveraging Latest Technologies to Enhance Offering
Cashless Payment Systems Selecta User Interface
• Increased convenience • Innovative interactive
vending experience
• Increased # of items sold per machine
• Allows for cost efficient
• Higher customer spending
refurbishment of old
machines
Selecta eWallet
• Unique consumer
experience
• Allows for consumer
interaction and
dynamic promotions
Telemetry
FOODIE’S Micro Markets
• Telemetry enhances benefits of route
based model • Unmanned and unattended, 24h self-service
• Enables dynamic real time refill stores
planning and remote monitoring • Designed for the workplace offering wider
• Increased operational efficiencies product range
• Cuts merchandiser time by up to c.60% • MicroMarkets revenue is c.150% higher than
an equivalent vending machine
• Public roll-out programme completed
22DEUTSCHE BA NK 23 RD A NNUA L EUROPEA N LEVERA GED FINA NCE CONFERENCE | 5 JUNE 2019
03 Investing Efficiently to Grow the Points of Sale Asset Management
Stable Maintenance Capex Requirements with Disciplined Capex for Growth
Maintenance Capex Model Programme Leading to Reduction of Gross Capex Required
Current Portfolio Maintenance Capex
Lifecyle expansions
Third-Party Owned
~100k
No Capex Associated with
Use of equipment over Active machine relocation
Customer-owned machines three cycles thanks to
~22% refurbishment programme
Total
Portfolio
Capex
Gross Cash
Portfolio
New Machines Capex Portfolio
Selecta Owned
Net Cash
~360k
€77m Capex €11m reduction in capex requirement
~78%
Refurbish
€23m
Free cash flow Depreciation
+ €10m p.a. - €1.6 million p.a.
Total
~460k €100m €80m €76m
(Illustrative for €1.5bn revenue level)
23DEUTSCHE BA NK 23 RD A NNUA L EUROPEA N LEVERA GED FINA NCE CONFERENCE | 5 JUNE 2019
03 Selecta is the Natural Consolidator M&A
Strict M&A Criteria & Sizeable Target Pipeline
Fragmented Market Offers Opportunities Natural Consolidator With Proven Track Record
Market share1 (%)
• Selecta well positioned as consolidator in a highly fragmented
18 82 1st market
• We estimate over 10,000 companies across Europe which offer
attractive synergies
24 76 1st
• Route-based model similar to leading European and North
American businesses such as Rentokil, Bunzl and Cott
9 91 1st • Leading scale positions us as “an acquiror of choice” with
significant potential for synergies
11 89 • Clear strategy to add 3-5% of sales per annum through
1st
acquisitions with well defined target types
• Strong execution capabilities with proven track record of
10 91 2nd integrating bolt-on acquisitions to enhance market position
12 88 2nd
On track to achieve M&A growth targets
7 93 1st
2 98 4th
Selecta Competition
Source: OC&C analysis
1 Market share in 2018A # denotes market share
24DEUTSCHE BA NK 23 RD A NNUA L EUROPEA N LEVERA GED FINA NCE CONFERENCE | 5 JUNE 2019
03 Management Team Provides Deep & Broad Experience People
NON-EXECUTIVE EXECUTIVE FUNCTIONAL EXPERTISE
Andy Ransom David Hamill David Flochel Gabriel Pirona
(CEO)
(LSE listed)
(Chairman
(FTSE100) (President
& CEO) & CEO)
Non-Executive & Executive Chairman CEO CFO
Senior Independent Director Joined in 2017 Joined in 2016 Joined in 2018
Joined in 2019 FUNCTIONAL EXPERTISE
Pascal Uffer Ray Sparks Raymond Tunnisen Barbara Bucher
COO Group General Counsel and CPO HR Director
Joined in 2015 Company Secretary Joined in 2014 Joined in 2012
Joined in 2018
REGIONAL LEADERSHIP
Thomas Jan-Marck Michael Bech-
Anthony Giron Wes Mulligan Ana Rodicio Stefano Fanti
Nussbaumer Vrijlandt Jansen
MD France MD UK MD Spain MD Italy
MD DACH MD BeneLux MD Nordics
Joined in 2016 Joined in 2017 Joined in 2009 Joined in 1988
Joined in 1986 Joined in 1995 Joined in 2017
Experience
H&B
Central North South & UK and Ireland
25DEUTSCHE BA NK 23 RD A NNUA L EUROPEA N LEVERA GED FINA NCE CONFERENCE | 5 JUNE 2019
03 Investment case
The Opportunity
Well positioned to take advantage of Focused customer approach yields
premium coffee and on-the-go above market organic growth with
consumption growth bolt-on M&A to accelerate further
Leading market positions with scale Enhancing profitability through
driven business model creating synergies, procurement and opex
attractive economics efficiency, as well as improving cash
generation by reducing capital needs
and creating working capital
efficiencies
Leading the innovation and Experienced management team is
technological development in the delivering strong financial returns
industry
Solid bond price performance
(29/05/18 €97.2 v €102.8 29/05/19)
5,875% Selecta Group B.V. (2024)
2604 Financials
DEUTSCHE BA NK 23 RD A NNUA L EUROPEA N LEVERA GED FINA NCE CONFERENCE | 5 JUNE 2019

04   Key Financials – A Strong Basis for Future Growth
       Revenue and Underlying EBITDA growth momentum

                            Revenue Growth (€m)1                                                                                                                            Underlying EBITDA (€m)1

                                      + 6.4%                                                                                                                                            + 12.2%

                                                               812.4                                                                                                                                                  133.0

                      763.5                                                                                                                                                   118.6

                    H1 FY183                              H1 FY192                                                                                                         H1 FY18                               H1 FY19

                                       + 5.7%                                                                                                                                              + 11.7%

                                                            1,514.8                                                                                                                                                  261.1
                     1,490.3

                                                                                                                                                                              233.7

               LTM March FY182                       LTM March FY192                                                                                                   LTM March FY18                         LTM March FY19

          1At   constant foreign currency rates. Constant foreign currency rates applied: CHF/EUR 1.15; SEK/EUR 9.65; GBP/EUR 0.88
          2   2017 & 2018 are proforma amalgamation of Selecta, Pelican Rouge, Italy Argenta and exclude disposed subsidiaries (Custom Pack).
          32017   based on gross revenue reported before harmonisation of vending fees presentation; 2018 includes the effect of vending fees harmonisation which added 270 basis points of growth (growth like for like was 2.4%)   28
DEUTSCHE BA NK 23 RD A NNUA L EUROPEA N LEVERA GED FINA NCE CONFERENCE | 5 JUNE 2019
04 Strong Momentum – Year on Year Organic Growth
H1 FY18 & H1 FY19
Organic Revenue Growth Organic Underlying EBITDA Growth
5.5%
14.5%
6.6%
1.9%
1.3% 1.4%
0.4%
-1.8%
H1 FY181 H1 FY191 H1 FY18 H1 FY19
4.6%
13.6%
8.3%
1.6%
0.8%
1.1%
0.3% 0.4%
LTM March FY182 LTM March FY193 LTM March FY18 LTM March FY19
1 2017 & 2018 are proforma amalgamation of Selecta, Pelican Rouge, Italy Argenta and exclude disposed subsidiaries (Custom Pack)
2LTM H1’18 vs. LTM H1’17 based on comparable gross sales before harmonization of vending fee presentation
3LTM H1’19 vs. LTM H1’18 based on comparable H1 gross sales (post harmonization of vending fee) and H2 gross sales (pre harmonization of vending fee), per data
available in the financial years FY17, FY18, and FY19. 29DEUTSCHE BA NK 23 RD A NNUA L EUROPEA N LEVERA GED FINA NCE CONFERENCE | 5 JUNE 2019
04 Revenue & EBITDA - Year on Year Strong Momentum
H1 FY18 & H1 FY19
+ 6.8%
Revenue1 812.4
34.5
(€ in millions)
12.6
763.5 5.2
1.4 760.1
-4.9
H1 FY18 Reported Nespresso Working Days H1 FY18 baseline SMD Trade/ Portfolio Growth M&A H1 FY19
+ 16.2%
Underlying EBITDA1
17.9 -12.3
(€ in millions)
133.0
6.6
3.2
118.6 3.1
0.9 114.5
-4.9
H1 FY18 Reported Nespresso Working Days H1 FY18 baseline SMD Trade/ Portfolio Growth M&A Synergies Investment in growth H1 FY19
• 1 At constant foreign currency rates. Constant foreign currency rates applied: CHF/EUR 1.15; SEK/EUR 9.65; GBP/EUR 0.88
30DEUTSCHE BA NK 23 RD A NNUA L EUROPEA N LEVERA GED FINA NCE CONFERENCE | 5 JUNE 2019
04 Liquidity at 31 March 2019
H1 FY19
Liquidity summary At actual rates
• Cash & cash equivalents of €99.9m at 31 March 2019 €m March 2019
• Liquidity summary
Cash & cash equivalents 99.9
• Senior secure notes of €1,313.6m
• €765m senior secured 5.875% Factoring facilities 0.1
• €325m senior secured floating rate notes Reverse factoring facilities 7.5
• CHF250m senior secured 5.875% Revolving credit facility 51.6
Senior notes 1,313.6
• Revolving credit facility: €51.6m drawn at 31 March 2019 to Accrued interest 33.3
finance acquisitions.
Finance leases 36.3
• Group available liquidity1 €198.3m
Other finance debt 19.7
Total senior debt 1,462.1
Net senior debt 1,362.2
Underlying EBITDA last 12 months2 261.1
Leverage ratio
Leverage ratio excluding exit run rate synergies 5.2x
Available liquidity1 198.3
• Pro-forma leverage ratio of 4.7x, stable from end of FY18
€m March 2019
Underlying EBITDA last 12 months2 261.1
Pro-forma leverage ratio (including full synergy programme) 4.7x
1 Includes cash & cash equivalents and unused revolving credit facility
2 LTM Underlying EBITDA at constant currency, on the proforma scope
31DEUTSCHE BA NK 23 RD A NNUA L EUROPEA N LEVERA GED FINA NCE CONFERENCE | 5 JUNE 2019
04 Cash Generation Highlights
H1 FY19 Free cash flow €16.4m, + €59.1m vs H1 FY18 EBTIDA less net capex (constant rates)1
• Significant improvement in net cash generated from operating €m H1 FY19 H1 FY18 Variance %
activities, from €(3.2)m to €82.1m thanks to
Underlying EBTIDA 133.0 118.6 12.2%
• Expanded EBITDA generation
Adjusted Net Capex2 70.5 59.2 19.0%
• Tighter working capital management showing the early results
of the company wide programme to further strengthen the Underlying EBITDA less Net Capex 62.5 59.3 5.3%
structurally negative working capital
• Re-investment in capex upfront in the year to accelerate
growth
Trade working capital €(128.3)m to 31/03/19
• Favourable, structurally negative working capital supports “Selecta….is back to generating free
further growth as a source of funding
• Company wide programme launched to further strengthen
cashflow and its synergy programme
working capital levers is delivering expected results….”
Significant improvement in structural cash generation
• Underlying EBITDA less net capex in H1 FY19 improved by 5.3% vs the May 24th, 2019
prior year as:
• EBITDA expanded in spite of our consistent investment in future
growth (talent capability, technology)
• Increased capex shows the consistent investment in our
portfolio
• Benefits from programme to reduce capital requirements
1 Constant foreign currency rates applied: CHF/EUR 1.15; SEK/EUR 9.65; GBP/EUR 0.88
2 Net capital expenditures is defined as capital expenditures less net book value of disposal of vending equipment
32DEUTSCHE BA NK 23 RD A NNUA L EUROPEA N LEVERA GED FINA NCE CONFERENCE | 5 JUNE 2019
05 Outlook for FY19
Guidance
FY19 guidance upgraded1
Revenue growth 6.0%
Underlying EBITDA €270m - €275m
Free Cash Flow €90m – €100m
1 Constant foreign currency rates applied: CHF/EUR 1.15; SEK/EUR 9.65; GBP/EUR 0.88
33You can also read