Welcome to TTK - TTK Prestige
←
→
Page content transcription
If your browser does not render page correctly, please read the page content below

Welcome to TTK
The TTK Group

                                                                                    Today a Rs25 Billion group
                                                                                    35 product categories and services
                                                                                    •16 manufacturing units
                                           •Manufacturing commenced in 1950         •12000 employees
                                           •Pioneered several categories in India   •Exports to every continent
                                           •Pressure cookers, Gripe water, Maps,
                                           Condoms, ball pens, Toys and Heart
•Started in 1928 as an indenting           Valves.
agency
•Founded by Mr. TT Krishnamachari
•Pioneered organized distribution
•Health care, Foods, Personal care
products, Writing instruments, Ethical
products
•Cadbury’s, MaxFactor, Kiwi, Kraft,
Sunlight, Lifebuoy, Lux, Ponds,
Brylcreem, Kellogg's, Ovaltine,                                 Indian roots, Global Reach
Horlicks, Mcleans, Sheaffer’s,
Waterman’s & many more
Diversified Group Structure
  TTK Prestige Limited     • Consumer durables - Listed

  TTK British Holdings
                       • UK Subsidiary of TTK Prestige Limited
        Limited
                       • Consumer Durables – Unlisted
Horwood Homewares Ltd

                           • Pharmaceuticals, Medical devices, Condoms,
 TTK Healthcare Limited      Consumer products and Foods - Listed

  TTK Services Private
                           • Non-Resident services and KPO
        Limited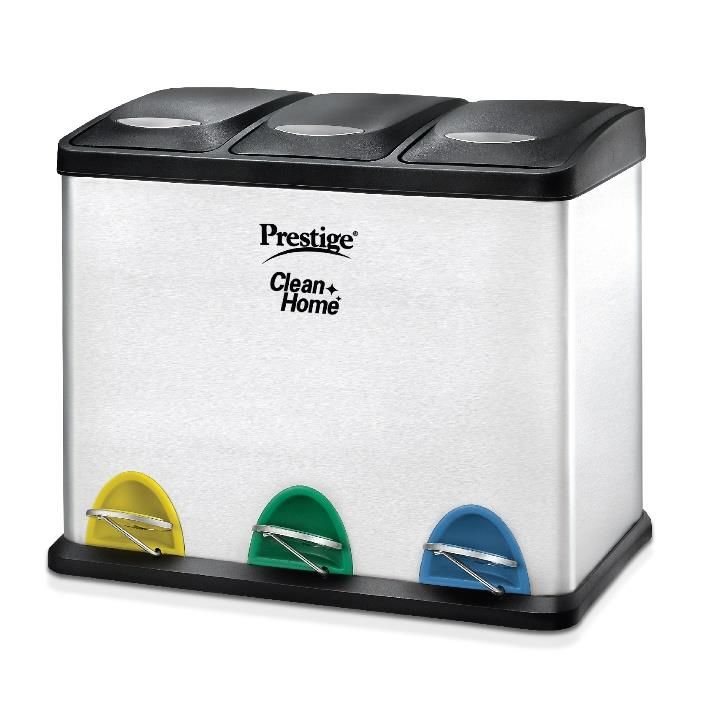
Core values of the group
Trust, Transparency and Knowledge
TTK Prestige Limited
                           Flagship company of TTK
 Incorporated in 1955.
                                    Group

     India’s largest
                                IPO in 1994.
kitchenware company.                                                            Public and
                                                                                Inst , 30%

                           Till 2015 Two brands in
                           the portfolio. Prestige
  3000 strong human
                             and Manttra. Now
                                                                   Promoter ,
        capital                                                       70%
                            added Judge& Stellar
                                 global brands.

11 Manufacturing units
Captive design and tool-    Versatile Distribution
     room facilities              Network

   A unique combination of strong
         manufacturing, design,                      Paid up capital Rs. 138.6 million,
          sourcing, marketing                        27000 shareholders
         &distribution systems.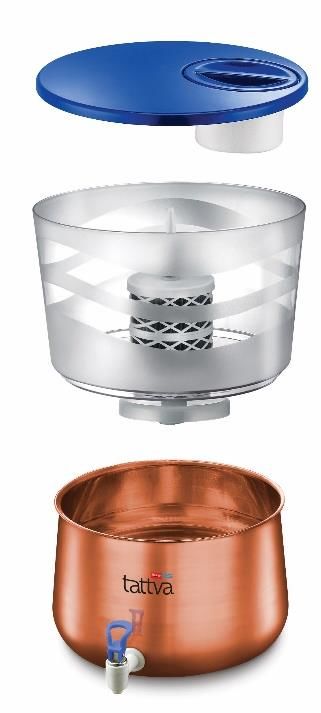
Board of Directors/ Management
Promoter Directors
 • Mr. TT Jagannathan – Chairman
 • Mr. TT Raghunathan – Vice Chairman
 • Dr. TT Mukund

Professional Directors
 • Mr. Chandru Kalro– Managing Director & CEO
 • Mr. K. Shankaran – Director (Corporate Affairs) & Secretary

Independent Directors
 • Mr. R. Srinivasan
 • Mr. Arun Thiagarajan
 • Dr. (Mrs) Vandana Walvekar
 • Mr. Dileep Kumar Krishnaswamy
 • Mr. Murali Neelakantan
 • Mr. Dhruv Moondhra
Sub Board level
 • Mr. V. Sundaresan – Senior Vice President (Finance) & CFO
 • Mr. H.T. Rajan- Chief Manufacturing Officer
                             A WELL-BALANCED BOARD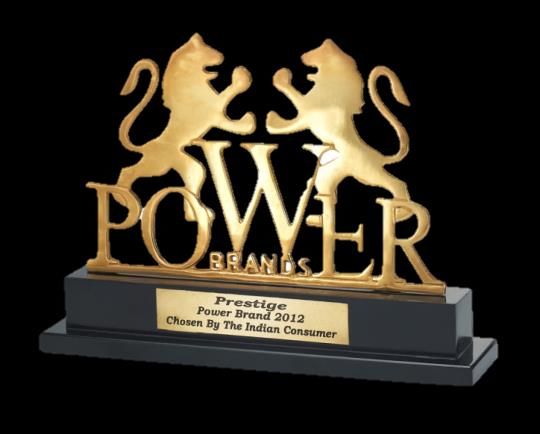
Vision and Values
CORE VISION
• To delight homemakers through Innovation
• To reach every Home with Company’s Products

CORE VALUES
• Quality products at affordable prices
• Trust, Transparency, Knowledge and “Prestige” in whatever we do
• Fair dealings with every stakeholder
• Respect for Environment

CORE STRATEGY
• Providing Total Solutions rather than just a product

The Journey so far …
1955 – Incorporation

     1959 – First Manufacturing unit in Bangalore

        1981 – Second Manufacturing unit in Hosur, Tamil Nadu

         Till 1990 – A single product company – Just aluminum outer lid pressure
         cookers – strong leader in southern India

        1990-94 – Launch of SS Pressure Cookers and Non Stick Cookware

     1990s – Export Thrust – Launch of Manttra Brand

2000-2003 – Period Of turbulences – yet bold Initiatives laying the foundation for brand
extension and explosive growth
The Journey so far …
2006 – Launch of well differentiated inner lid pressure cookers – New capacities in Uttarakhand and
Coimbatore

      2006-2010 – Transformation into a total kitchen solutions provider lead by innovations like
      induction cooktops, Apple Cookers, Microwave Pressure Cookers and a host of appliances

          2010 – 11 Adoption of a simple but powerful vision “A PRESTIGE IN EVERY
          INDIAN KITCHEN “

          2011 - Largest capacity expansion initiative to back the above

      2012 – Company turnover crosses 11 Billion

2012 – Alliances with global high end brands entered for high-end cookware/Store ware/Water
Filters/ Gas-tops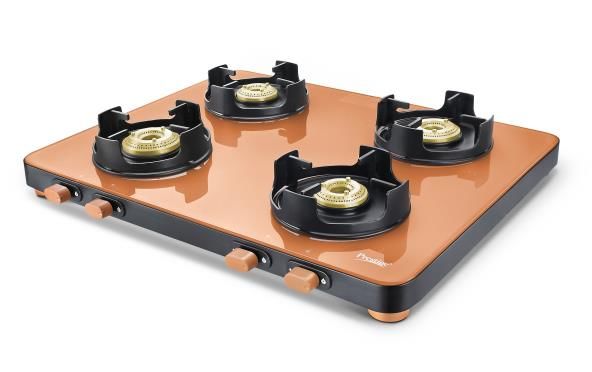
The Journey so far …
2013 –Launch of Microwave cookers met with great success in export market

      2013 – Company turnover crosses Rs 13.8 Billion (28% CAGR in 10 years)

           2013-2015 –Adverse economic conditions and state policies impacted growth

            2015-16 – Got back to double digit growth in most difficult circumstances and increased
            market share across categories, crossed 15 Billion milestone in turnover

           2016 April – Entered new horizons – UK Acquisition & Launch of Cleaning Solutions

      FY 2017- Consolidated turnover crosses Rs.18 billion
      FY 2018- Launched Judge Brand ; Launched Tatwa range of water purifiers; Consolidated turnover close to Rs.20 billion
      FY 2018- Enlarged the Vision to travel beyond Kitchen Domain and adopted an aggressive Long -Range Plan.
      FY 2019- Consolidated turnover crosses Rs.20 billion

Transformation Achieved by the same management team
Product Categories before 2001
Less than 100 SKUsProduct Categories Now Several hundred SKUs
Basic Philosophy that led to
   Turnaround and Growth

Focus on occupying the mindshare of the consumer

     Focus on dominating the kitchen domain with differentiated products & travel beyond Kitchen
     domain

        Focus on Growth, Gaining market share and expanding customer base

        Key Metrics
        •Growth
        •Capital Efficiency
        •Return on capital employed

     Margin is a strategy to growth rather than an end in itself

Margin improvement through improving efficiency.
Pass to consumer “Cost Escalation and not cost of inefficiencies”
Fruits of the Journey We derisked the company from being dependent on a single product and a single market We derisked the manufacturing and sourcing from being dependent on a single location/Few Sources Today we are operating in a market size of Rs 120 Billion as compared to just Rs 5 Billion 10 Years back Total Income(Sales +Other Income) Grew At CAGR Of Around 28% Between 2003–13 from Rs.1.13 Billion to nearly Rs.13.8 Billion. After a brief Lull Crossed Rs.19.7 Billion In Turnover In 2018-19.(Consolidated Rs. 21.0 Billion) Pressure Cooker Volumes Grew From 1 Million To nearly 5 Million Cookware Volumes Grew From 0.4 Million To nearly 5.3 Million Appliances & Cleaning Solutions Became A Significant Part Of The Portfolio – Currently About 47% Of Total Sales Established Clear Leadership In Key Product Categories
Fruits of the Journey

From a negative EBITDA of Rs.61.2 Million to a positive operating
EBITDA Hovering Close To Rs.3.1 Billion

Profit Before Tax Grew From a loss Situation Of Rs. 17.42 Million to a
profit level hovering around Rs. 2.83 Billion

PAT grew from a loss Of Rs.114.7 Million to a positive figure of Rs.1.9
Billion

Net Current Asset Turnover Ratio improved from 1.7 times to nearly 4.0
times

Operating ROCE(without treasury) from negative to 38.5% (after Huge
Capacity Expansion Outlay of Rs.3.5 Billion)

Won Several Awards – Organization As Well As Individual Team
Members
Awards 2018-19
Superbrand Award for 2018-2019

Marketing Excellence Award

Brand of the Year Award

Brand Excellence Award in Home and Kitchen Appliances

Award for Marketing Communication (Business to Consumer)
Strengths of the company
   • 11 manufacturing                                             • Within and outside
     units                                                          India
   • Excellent Product                                            • Dedicated vendors
     development capability                                         within India to
   • Strengths in Deep draw                                         implement our
     of Aluminum and SS                                             designs

                              Manufacturing
                                 Manufacturing        Sourcing

                                              Brand

•Comprehensive Sales and          Marketing          Quality
                                                  Certification
 Marketing network                                                  •India’s first ISO 9001: 2000
•Unique model of                                                     certified Kitchenware
 Exclusive Retail outlets                                            company
•Largest service network                                            •India’s only PED:CE
 in the category                                                     certified company
                                                                    •Pass every relevant
• Innovative approach to
                                                                     global standard on
  on-line and modern
  format stores & Rural                                              manufactured products.
  penetration
The Prestige Brand
Core values of the brand
TRUST, SAFETY, DURABILITY
&SOLUTION ORIENTED
Leaders in Pressure cookers, Microwave Pressure Cookers
cookware, Induction Tops, Rice Metal Spoon friendly cookware
cookers & Value added Gas tops. Product Clip on range of Pressure Cookers
Innovations Impact bonded cookers and cookware
Prestige is a Super Brand Duplex Gas tops & Hob tops
Average 75 new SKUs launched every year
Marketing
innovations
India’s Largest
• Exchange schemes Kitchen appliance
brand
• Display schemes
• Turnover & Profits
• Retail • Product portfolio
• Rural Penetraton • Reach
• No. of customersTotal Industry we operate in :- 15850 Crores (At Market Operating Prices)
The Prestige product portfolio –
     widest in the industry
  Preparation before                              Kitchen
       cooking            Food preparation
                                                supplements   Kitchen Hardware   Cleaning
                                                                                 Solution
                               Pressure
        Chopping                                 Heaters           Chimneys
                               cooking
                                                                                  Electrical
        Blending               Cooking           Toasting
                                                                  Store-ware
        Grinding               Sautéing,        Beverage                            Non-
                               frying etc        makers                           Electrical
       Processing                Baking

Mixer grinders         Pressure cookers      Kettles          Complete           Complete
Food Processors        Non stick cookware    Pop up           kitchen            Cleaning
Choppers               LPG gas Stoves        Toasters         Solutions.         Solution
Blenders               Induction Cook tops   Sandwich                            Range
Juicers                LPG Hobs              toasters
Wet Grinders           Hob-Tops              Coffee Makers
Knives                 OTG’s                 Tea Makers
                       Rice Cookers          Roti Makers
                       Barbecues
Distribution Structure
Traditional Modern
Own Retail Institutions Online
Trade Trade
Prestige Smart
Direct Dealers Hypermarkets Kitchen Offline CSD Market Place
and Online
Authorized Re- Corporate and
Supermarkets Direct Sell
distributors Govt.
Oil Marketing
Shop in Shop
Companies
Rural
Marketing
Teleshopping
CompaniesDistribution
Structure with multiple
National presence Large sales force channels
400 direct & 1000
28 branch locations Own retail
indirect
Over 250,000 sq. ft of Product/
Modern format
warehousing Territory/Channel focus
Committed and well
Several thousand outlets qualified sales Traditional retail
management
CSD
Oil Marketing
Rural
TeleshoppingChannel contributions
4%
CSD
3%
Others
49% Traditional Trade
Own Retail
10%
Traditional Large Format
Trade Institutions
5%
Rural Rural
Ecommerce
2% Others
Institutions Large
Format CSD
Own
13% Retail
14%Retail initiative
Pioneering effort Nationalpresence Results of the Retail initiative
• First kitchen • 574 outlets in 333
appliance brand towns Quick reach of new products
Brand is today seen in a new light.
Show cases the brand in the intended and complete format for
High conversion High efficiency/sq. 365 days
ratio ft
• 60% of walk-ins •Over Rs. 10,000/sq. ft. Unique engagement with the customer.
actually buy
Unmatched on ground presence and a unique listening post.
Greater leverage with trade – both traditional and modern
Direct contact with format.
Ability to grow
customer
beyond market
• Ability to launch new growths Lower cost of sales in the long run.
productsInnovation – The key growth to success SOME KEY INNOVATIONS • Clip-On Pressure Cooker: “India’s First Multi Utility Pressure Cooker” • E-Gas HobTop: “India’s First Electronically Controlled Convertible Gas Stove ” •PIC 3.1 V3: “India’s Only Induction Cooktop with Whistle Counter and Keep warm Function” • Milk Boiler: “India’s Only Automatic Milk Boiler”
Microwave Coffee Maker
A Breakthrough Innovation

       Microwave compatible Coffee Maker

          Innovated and developed in-house

           Patent Pending

          A potential growth driver for export market & TN

       Makes 2 Cup of Coffee in 4 minutes
Breakthrough Products in Traditional Business • Clip-On Mini Pressure Cooker • Deluxe Pro Pressure Cooker (5 Safety Features) • Tri Ply Cookware
Breakthrough Products in Appliances Business

 • Edge Gas Stoves

 • Digital and Non Digital Black
   and Gold Hobtops

                   AI Frame Gas Stoves 2, 3 and 4 burner

 • Aata Kneader Cum Chopper
Breakthrough Products in Appliances Business • Kitchen Hoods • Sandwich Makersand Grills • Kettles • Hand Blender and Mixers
Launch of Cleaning Solutions Business:
Electric Range

 • Vacuum Cleaners

 • Fruit and Vegetable
   Cleaner

 • Hero Mop
Launch of Cleaning Solutions Business:
Non Electric Range

• Water Purifiers

• Magic Mops
Launch of Cleaning Solutions Business:
Non Electric Range
    • Waster Segregation
      Dustbins
Factors That Lead to Growth
and Sustainability Since 2003-04
Economy was growing
Consistent increase in
General economic between 8-9% for a
number of middle
factors period of about 6 to 7
income groups
years till 2010-11.
Growing disposable
Rural employment
income in the hands of
guarantee scheme/DBT
consumerFactors That Lead to Growth
and Sustainability Since 2003-04
New consumers added New consumers added
Consumer behavior
from lower income group from semi urban/satellite
factors
in urban centers rural areas
Demand arising out of
Shifting preference to addition to new families , The breed of domestic
quality products & marriage and transfers , cook and domestic help
Informed buying modernization and vanishing
improvements to kitchen
Change in home style
from closed kitchens to
open kitchensFactors That Lead to Growth
and Sustainability since 2003-04
Offering innovated
Driving growth Close contact with and differentiated
through Innovation consumer products ahead of
competition
Expanding Innovative
Offering of wide
distribution – width, marketing and sales
range and total
depth and promotion
kitchen solutions
innovative channels strategies
Ensuring that
Dealers enjoy real
Dealer Loyalty Economies of scale
profits and higher
ROIFINANCIALS
SALES TREND (INR MILLION)
                                (NET OF DISCOUNTS)
21000

                                                                                                                    19680
19000

                                                                                                       17465
17000

                                                                                          16036

15000                                                                        14879

                                                                13442
13000                                 13106
                                                   12515

11000
                         10618

9000

             7335
7000

5000

3000

1000
        2010-11     2011-12      2012-13      2013-14      2014-15      2015-16      2016-17      2017-18      2018-19
45000.0
40000.0
35000.0
30000.0 19680.0
17464.5 Total
25000.0 OTHERS
16036.4
14879.3 Cleaning
APPLIANCES
20000.0 13106.4 13442.4
661.5
334.4 COOKWARE
12515.2
578.2
252.5 COOKERS
10617.5 564.3
118.1
15000.0 563.3
0.0 9210.9
445.1
0.0 529.7
0.0 7985.9
364.1
0.0 6986.7
7334.7 6376.0
10000.0 282.8
0.0 5423.5
5516.6 5336.6
4302.4 3016.1
207.0
0.0 2696.1 2812.0
2485.2 2627.1
2674.5 2315.6 2142.7
5000.0 2124.8
1456.3 6457.1
4829.1 5004.0 5312.9 5671.2 5835.9
3907.6 4671.8
2996.9
0.0
2010-11 2011-12 2012-13 2013-14 2014-15 2015-16 2016-17 2017-18 2018-19EBITDA (BEFORE EXCEPTIONAL ITEMS) TREND (INR MILLION)
3300.0
3100.0 3114.8
2900.0
2700.0
2500.0 2485.4
2300.0
2100.0
2016.5
1932.7
1900.0
1700.0 1681.0
1543.4
1500.0
2013-14 2014-15 2015-16 2016-17 2017-18 2018-19EBITDA(before exceptional items) MARGIN TREND
17.00%
16.00%
15.83%
15.00%
14.23%
14.00%
13.00% 12.99% 12.99%
12.57%
12.00%
11.00% 11.12%
10.00%
9.00%
8.00%
2013-14 2014-15 2015-16 2016-17 2017-18 2018-19Key Facts FY 2018-19
Introduced Judge Brand of
Exports continued to register New Category of Cleaning
Cookers ,Cookware ,Gas Stoves
growth Solutions growing well.
& Appliances
Annual EBITDA margin before
Company registered annual
Performance better than exceptional items grew smartly
domestic growth of 12.00% -
peers from 14% in the PY to 16%
greater than GDP growth.
during the CY.
Non-Traditional channels like
E-Commerce and Rural
Channels continued to record
high growths, enhancing the
reach/penetration of our
Products.Key Facts Relating to FY 2018-19 Rural and E-Commerce Sales registered high growths Same stores growth in PSK’s was encouraging A host of New Models/New Products in all categories – overall 100 SKUs introduced. New Advertisement campaign showing results. Higher Capacity utilisation leading to better Profit Margins
TTK PRESTIGE LIMITED
                    GIST OF INFORMATION TO BE SHARED WITH ANALYSTS - Q2 of FY 2019-20

                                    HIGHLIGHTS OF PERFORMANCE (STANDALONE)
                                Q2                                                  1ST HALF
         Sales          PBT           EBITDA          PAT             Sales           PBT          EBITDA          PAT
         Value         Growth         Growth         Growth           Value          Growth        Growth         Growth
        Growth                                                       Growth
          Q2            Q2             Q2             Q2             1st Half        1st Half      1st Half        1st
                                                                                                                   Half
        3.86%          4.17%          6.04%          49.3%            3.71%          3.70%          5.27%
                                                                                                                  30.19%

GENERAL BACKDROP FOR Q2 OF FY 2019-20
A. GENERAL ECONOMY
 Overall ecnomic growth continued to be sluggish during Q2 as reflected in the downward revision of GDP growth for FY 20
 Rural Demand situation continued to be under stress
 Bountiful monsoon across geographies raising hopes for a better 2nd half-year
 E-Commerce channel operations more stable
 Heavy Discounting in Large Format stores remains an issue for entry level products
 Export markets continue to be sluggish
 Corporate Tax cuts expected to leave more cash surplus for investments in the future.
B. SPECIFIC TO COMPANY
 Slowdown in Rural Demand impacted the key thrust area of the company
 Broad basing the Large Format channel continues and is yielding good results
 Revised trade policies have gained more acceptance
 E-Commerce contribution continued to grow strongly
 Improved EBITDA Margins
 Siginificant Improvement in PAT consequent to lowering of corporate tax

KEY PERFORMANCE HIGH LIGHTS OF QUARTER ENDED 30TH SEPTEMBER 2019
(AS COMPARED TO Q2 OF PREVIOUS YEAR)
 Domestic Sales grew by around 5% from Rs.537 Crs to Rs.563 Crs
 Export Sales down by around 31% from Rs.15.30 Crs to Rs.10.59 Crs.
 Total Sales grew by around 4% from Rs. 552 Crs to Rs.574 Crs
 EBITDA grew by 6.04% from Rs.87.41 Crs to Rs. 92.69Crs
 EBITDA margins was around 16.16%
 Profit before Tax grew by 4.17% from Rs.80.25 Crs to Rs.83.6 Crs.
 Profit after Tax grew by about 49.30% from Rs. 53.77 Crs to Rs.80.28 Crs
 EPS stood at Rs.57.92 (PY Q2 38.79)
KEY BUSINESS FACTS FOR Q2 OF 2019-20
By and large volume growth seen across categories. Value growth varied on account of product mix
Introduced 33 new SKUs during the quarter
Cleaning Solutions business continues to grow well
Growth in Appliances was better than Traditional categories
Prestige Xclusive chain strength stood at 574 contributing significantly to total sales
The company continues to carry substantial free cash
Long-term settlement arrived with Hosur Unit workmen with improved productivity norms
KEY PERFORMANCE HIGH LIGHTS OF HALF YEAR ENDED 30TH SEPTEMBER 2019
(AS COMPARED TO 1ST OF HALF OF PREVIOUS YEAR)
Domestic Sales grew by around 5% from Rs.940 Crs to Rs.984 Crs
Export Sales down by around 23% from Rs. 30.78 Crs to Rs.23.58 Crs
Total Sales grew by around 4% from Rs. 971 Crs to Rs.1007 Crs
EBITDA grew by 5.27% from Rs147.56 Crs to Rs. 155.34 Crs
EBITDA margins was around 15.42%
Profit before Tax grew by 3.7% from Rs.133.84 Crs to Rs.138.80 Crs
Profit after Tax grew by about 30.19% from Rs. 89.67 Crs to Rs.116.75 Crs
EPS stood at Rs.84.22 (PY Q2 64.69)
Consolidated turnover grew by 3.52% from Rs.1031.2 Crs to Rs.1067.50 Crs
Consolidated Profit after Tax stood at Rs.116.15 Crs (PY Q2 Rs.89.32 Crs)
Consolidated EPS was Rs. 83.79 (PY Rs.64.44)
SALES BREAK UP -STANDALONE (Rs. Crs)
Q2 Q2 GROWTH 1st Half 1st Half GROWTH
2019-20 2018-19 2019-20 2018-19
COOKERS 182.05 188.48 -3% 321.92 338.57 -5%
COOKWARE 94.69 88.53 7% 159.27 149.95 6%
APPLIANCES 279.19 256.16 9% 491.76 449.51 9%
OTHERS 17.66 19.1 -8% 34.24 33.11 3%
TOTAL 573.59 552.27 4% 1007.19 971.14 4%
PROPORTION TO Q2 Q2 1st Half 1st Half
SALES 2019-20 2018-19 2019-20 2018-19
COOKERS 31.74% 34.13% 31.96% 34.86%
COOKWARE 16.51% 16.03% 15.81% 15.44%
APPLIANCES 48.67% 46.38% 48.82% 46.29%
OTHERS 3.08% 3.46% 3.40% 3.41%
TOTAL 100.00% 100.00% 100.00% 100.00%
UK SUBSIDIARY - HORWOOD
The uncertainty over Brexit deal continues to affect UK economy
Recorded double digit growth in Q2 due to new channel penetration/new products
Investments being made to improve marketshare and multi-channel presence
Better performance as compared to peers
Acquired 51% stake in new EcoSoul Life business through stepdown subsidiary
GOING FORWARD
Improvement in consumer demand seen in September 2019 and October 2019 aided by festive season
As a result of good monsoon, recovery is expected in the remaining quarters
More number of new SKUs will be launched in the ensuing quartersFor the Quater Ended 30th September 2019
(Rs. Million)
STANDALONE CONSOLIDATED
19-20 18-19 19-20 18-19
Sales 57359.0 55227.0 60630.0 46120.0
Other Income 4401.0 3877.0 4540.0 4059.0
EBITDA 9269.0 8741.0 9365.0 6255.0
EBITDA % on Sales 16.16 15.83 15.45 13.56
PROFIT BEFORE TAX (Before Exceptional Items) 8360.0 8025.0 8365.0 5439.0
PROFIT BEFORE TAX (Before Exceptional Items) % on Sales 14.57 14.53 13.80 11.79
PROFIT AFTER TAX 8028.0 5377.0 8034.0 5350.0
PROFIT AFTER TAX % on Sales 14.00 9.74 13.25 11.60For the Half Year Ended 30th September 2019
(Rs. Million)
STANDALONE CONSOLIDATED
19-20 18-19 19-20 18-19
Sales 100719.0 97114.0 106750.0 103120.0
Other Income 1259.0 1112.0 1263.0 1092.0
EBITDA 15534.0 14756.0 15620.0 14858.0
EBITDA % on Sales 15.42 15.19 14.63 14.41
PROFIT BEFORE TAX (Before Exceptional Items) 13880.0 13384.0 13804.0 13338.0
PROFIT BEFORE TAX (Before Exceptional Items) % on Sales 13.78 13.78 12.93 12.93
PROFIT AFTER TAX 11675.0 8967.0 11615.0 8932.0
PROFIT AFTER TAX % on Sales 11.59 9.23 10.88 8.66GOING FORWARD
We Are Now

  No. 1 Brand in         No. 1 Brand in        No. 1 Brand in
 Pressure cookers         Cookware            Value added Gas
                                                   Stoves

                      India’s only company
   No. 1 Brand in     to offer the complete   No 1 Brand in
Induction Cook tops     Induction Cooking     Rice Cookers
                             solution

                         India’s largest
                       Kitchen appliance
                           company
WE ARE COMMITTED TO TAKE THIS LEADERSHIP POSITION EVEN FURTHER!
Manufacturing
Invested about Rs.3.5 billion between FY 2010-11 and FY 2013-14

Innovation/Development costs – revenue in nature - about 1.5% of sales

We have doubled pressure cooker capacity between 2012 & 2014

We have quadrupled Cookware capacity 2012 & 2014

All our investments comprise state of the art manufacturing infrastructure and plant

We have started indigenous production of some appliances and cookware hitherto
imported

Capex plan over next 3 years from FY 19 till FY 21– Rs. 2.0 billion. Capacity expansion
of SS cookers/Kitchenware projects in Gujarat/Coimbatore completion in FY 20
New Growth area – Cleaning Solutions
                              Electrics                                                       Non Electrics

  Floor Care       Air Care           Home care      Kitchen          Floor         Kitchen            Home                Bathroom

                                           Steam                                       Cutlery                              Tile Scourer
    Electric Mop    Air Purifiers                                     Magic mops                       Carpet Brush
                                          cleaners    Fruit and Veg                    Cleaner
                                                         Cleaner
      Vacuum                              Window                                    Premium Bottle                          Toilet Brush
                                                                      Spray mops        Brush           Floor Brush
      cleaners                            cleaners
                                                        Water
      Floor                                                                           Microfiber         Household         Hockey Brush
                                                       purifiers      Stick Mops        Cloth             Gloves
     polishers

                                                                       Squeeze                            Window              Plunger
                                                                                    Garbage Bag
                                                                        mops                              Cleaner

                                                                       Dry Mop       Dish Brush           Ladder

                                                                                       Kitchen
                                                                        Brooms                          Dustpan Set
                                                                                        Wiper

                                                                                       Kitchen
                                                                      Floor Cloth                      6in1 Cleaning Set
                                                                                        Wipes

                                                                                        Water             Flip bins
                                                                                       Purifiers

                                                                                                        Mop Holder
                                                                                                         Duster &
                                                                                                          sponge
Opportunities Strong Fundamentals Of Indian Economy despite some slowdown since Jan 2019 • Expected GDP growth of around 7 % from FY 19-20 New Infrastructure//Rural Development Initiatives –Ujwala, Electrification, etc Shift In Income Groups – Direct Benefit Transfer aids increase in consumer base Top Of The Pyramid Market Segment Additional Product Categories In The Kitchen/Specific Home Space Rural Markets Preference To Branded Quality Products Adjacencies to Kitchen Domain/Home
Opportunities
Vast Untapped Market – Categories And Geographies

Leveraging the fast-growing On-Line Channel To Broaden Customer Base

Select Export Markets For Specific Products –Leveraging UK acquisition

Opportunities For faster growth through rural markets

Strong Long-Term Resource Base Gives Freedom To Explore Strategic Inorganic
opportunities (acquisitions) – domestic & global – Company has adequate cash

Global Scale Capacity For Cookers & Cookware To Meet Growth Needs – Domestic And
Export –Further expansion planned

GST poised to provide level playing platform and better opportunities for branded
players
Challenges

Slower recovery in consumer sentiment

Weak Global Markets

Pressure On Disposable Income

Lower GDP Growth Since 2011-12

Proliferation Of Regional Brands & Their Trade Practices

Possible Down Trading Warranting Low Price Point Products

Entry Of MNC’S/Branded Domestic National Players In Appliances Segment

Channel Churn & Channel Management
Key Strategy of TTK Prestige in the
  Current Scenario& Expected Impact
Drive consumer interest by well differentiated offerings

Leverage Brand strength to enter select categories transcending Kitchen Domain

Target domestic growth rate in excess of GDP growth rate

Not to indulge in unnatural pricing – ‘down’ to push the product or ‘up’ to just to increase
profits by masking operational inefficiencies

Create a pull by making consumer see value for money

Pass on increase in in-put costs without much lag

Use savings in costs for improving brand salience and also to shore up free cash

Continue to Innovate – Launch in excess 100 new SKUs in FY 20
Key Strategy of TTK Prestige in the
Current Scenario & Expected Impact
Increase geographical penetration in under-penetrated markets in non-south and select non-urban markets
Multiple Brand Strategy to be relevant to all consumer segments
Inorganic opportunities ( acquisition) that can add to long-term stake-holder value – Company has sufficient free-cash to fund this.
Leverage on-line for new customer reach
Maximise the potential of Prestige Xclusive network
Use the advantage of scale for competitive input cost management
Higher labour productivity across manufacturing locations to drive cost-advantage. Right sizing
already implemented in Old factories.
Improve internal efficiencies especially in logistics and warehouse management
Leverage scale of economies to improve margins
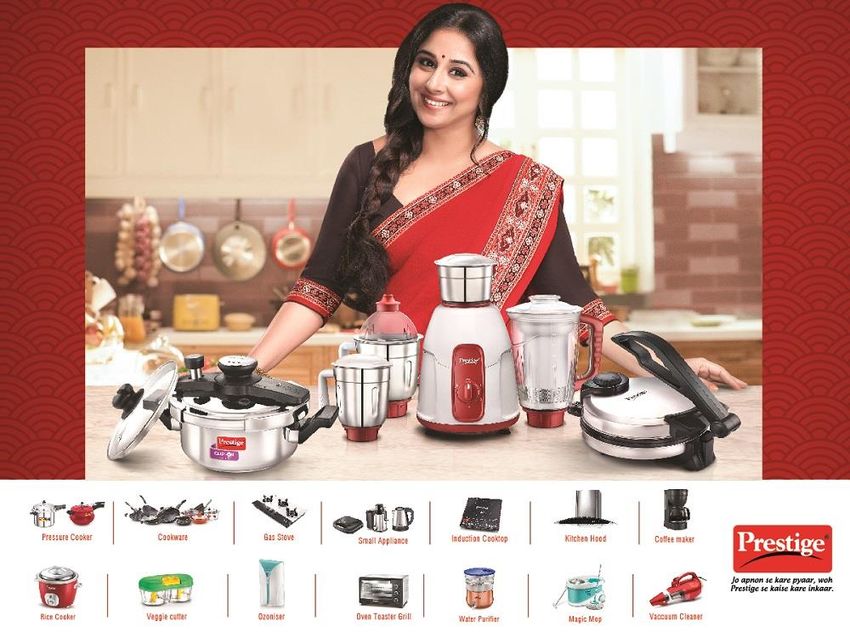
Return on Operating Capital (net of treasury deployment)slated to improveOur Response to Challenges We believe that we will strike a balance between Opportunities And Challenges We have already broad based our Product Range as well as consumer base – seeing impressive growths In non-south Markets We will continue to widen our product range and consumer base in the kitchen domain and expand foot-prints in Cleaning Solutions Range Strengthening and calibrated scaling of Prestige Xclusive network Across India New Brand Campaign with Ms. Vidya Balan as Brand Ambassador & further distinguishing us from competition with differentiated products.
New Brand
  Ambassador
  and proposition

:- The brand has a new brand
ambassador

:- The new proposition would be
floating with the core thought
being “ Jo Apnon se kare pyar, who
Prestige se kaise kare inkaar ”
Our Response to Challenges
We are making significant investments in innovation, human resource development, logistics and service

Wherever required consultants of global repute engaged

We have clocked in a CAGR of over 28% till 2013. Thus our base has already increased.

For the current, focus is to ward off volatile consumer sentiments and stay ahead of the competition. While margin
may fluctuate within a small band, market share gain is the goal

 For the long-term, depending on the general economic conditions and aided by the Govt’s new policy initiatives we
 expect to maintain decent growth rates with a healthy return on the expanded asset base. Targeting doubling of
 revenues by FY 23.
 Will look for inorganic opportunities through acquisition – overseas as well as domestic
SAFE HARBOUR

THIS PRESENTATION MAY CONTAIN STATEMENTS WHICH ARE FUTURISTIC
IN NATURE. SUCH STATEMENTS REPRESENT THE INTENTIONS OF THE
MANAGEMENT AND THE EFFORTS BEING PUT IN BY THEM TO REALISE
CERTAIN GOALS. THE SUCCESS IN REALISING THESE GOALS DEPENDS ON
VARIOUS FACTORS BOTH INTERNAL AND EXTERNAL. THEREFORE THE
INVESTORS ARE REQUESTED TO MAKE THEIR INDEPENDENT JUDGEMENTS
BY TAKING INTO ACCOUNT ALL RELEVANT FACTORS BEFORE TAKING ANY
INVESTMENT DECISIONS.
Thank you
You can also read