RESULTS PRESENTATION FEBRUARY 26, 2019 - Metro Bank
←
→
Page content transcription
If your browser does not render page correctly, please read the page content below
RESULTS PRESENTATION
FEBRUARY 26, 2019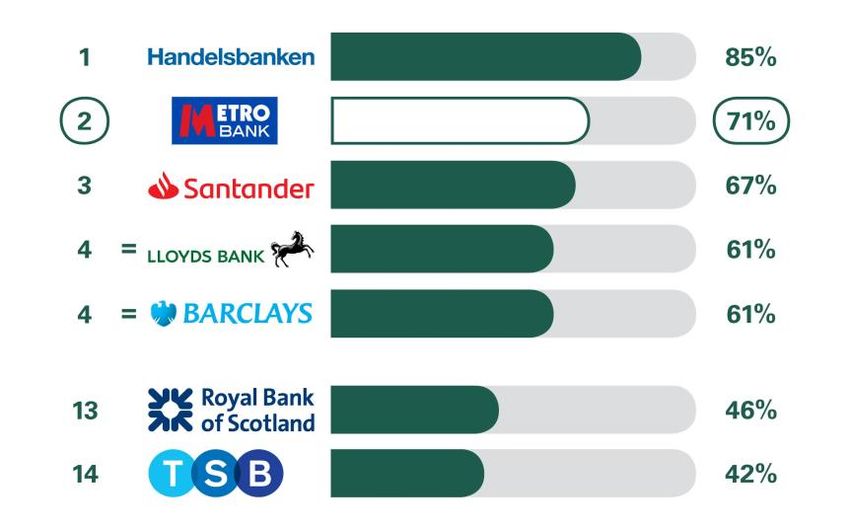
Metro Bank Today

         The revolution        •   Opening stores, entering new markets, expanding digital capabilities,
          continues…               growing deposits, and creating FANS

       …delivering strong
       earnings growth…
                               •   Strong deposit and loan growth drives 140% increase in Underlying PBT

      …but environment is      •   Continue to operate in a highly competitive lending environment that has put
        challenging…               pressure on our margins

                               •   Optimise the balance between growth, profitability and capital efficiency
    …and so we are evolving
        our strategy…
                               •   Increasing our focus on SME businesses underpinned by Capability &
                                   Innovation Fund £120m win

    …while ensuring a robust   •   Plan to raise c.£350m of equity in 2019 with committed standby
      capital position for         underwriting to ensure a well capitalised balance sheet primed for the
            growth                 future…

2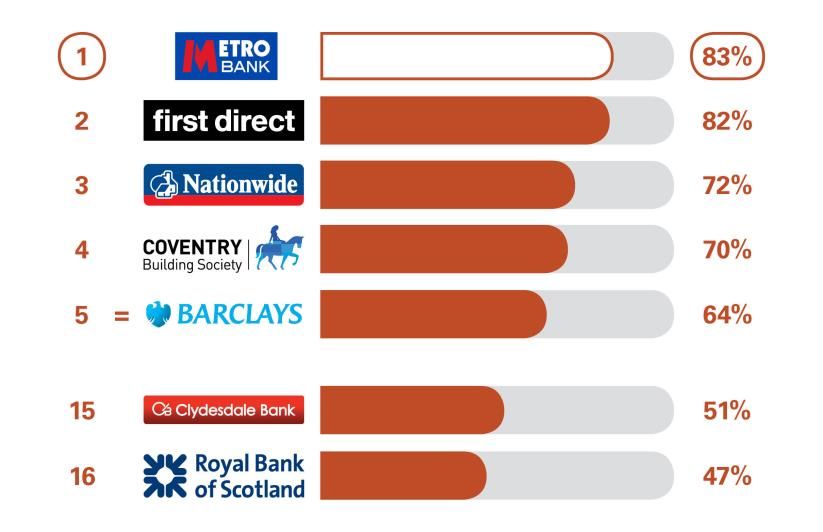
The Revolution Continues

    Another Year of Progress

    Service Delivery
    Recognition                                                           Number 1 For Overall Quality of   Best All Round Personal        Best Digital
                                                                           Service in Personal Banking(1)      Finance Provider         Onboarding Strategy

                                                          Cost of deposits (bps)         82                 79                  54              61

    Growth of Low Cost                                                                                                          11.7
                                                                                                                                                15.7
    Sticky Deposits                                                                                         8.0
                                                                                         5.1
                                                                    Deposits (£b)

                                                                                        2015                2016                2017            2018

                                                                   Cost of risk (bps)    29                 10                    11                 7

                                                                                                                                                14.2
    Low Risk Lending                                                                                                              9.6
                                                                                         3.5                 5.9
                                                                          Loans (£b)

                                                                                         2015               2016                 2017            2018

3       (1) Source: CMA Service Quality Surveys published February 2019
We continue to create FANS
Number one service for personal customers… …and well positioned to challenge for the top spot in SME
Personal Current Accounts: Overall Quality of Service(1) Business Current Accounts: Overall Quality of Service(1)
Award winning customer service… …and award winning colleague engagement
of colleagues think Metro Bank is a
96% great place to work in our annual voice
of the colleague survey
Best Digital Finalist at
Onboarding British Bank
Strategy Awards
Best All Round 5-star rated
Personal Finance standard current
Provider account
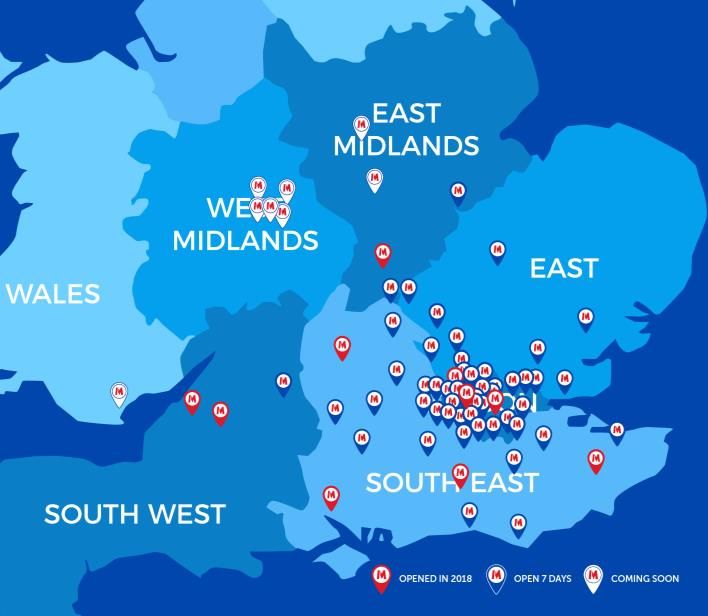
4 (1) Source: CMA Service Quality Surveys published February 2019As we expand our physical network & digital footprint to deliver an
integrated customer experience
Increasing Customer
Stores Digital
Acquisition
Digital Investment in 2018 Customer Accounts
1,620
(‘000)
• Insights launched
1,217
• International payments functionality added
915
• Current Account opening online launched
655
• Instant Access Savings application 447
275
Dec-13 Dec-14 Dec-15 Dec-16 Dec-17 Dec-18
Average 10% market share of
new business current
accounts in London(2)
+10 Stores New Market Expansion 2nd highest rated
in 2018 Bristol, Southampton and banking app &
Northampton in 2018, with
~c.8 Stores in Birmingham and the Midlands overall(1) 15% of SME switchers in
2019 excl. C&I London(2)
an opportunity in 2019
funded stores
33% of current account holders used 86% brand awareness in London(3)
66% of customers used a store in 2018 physical & digital in the last 90 days 54% brand awareness in the UK(4)
(1) iOS app store (2) MarketVue Business Banking from Savanta, YE Q1 2018 – YE Q4 2018. Base size: new BCAs 162-266, switchers 33-47. Data weighted by region and turnover to be representative of businesses in
5 Great Britain. (3) Figures from YouGov Plc. Total sample size was 1,002 adults. Fieldwork was undertaken between 19-21 February 2019. The figures have been weighted and are representative of all London adults (aged
18+). (4) Figures from YouGov Plc. Total sample size was 2,095 adults. Fieldwork was undertaken between 19-20 February 2018. The figures have been weighted and are representative of all GB adults (aged 18+).Delivering strong growth in deposits, loans and profit
FY 2018 FY 2017 YoY %
Customer accounts 1.6m 1.2m 33%
Customer deposits £15.7b £11.7b +34%
Net average deposit growth
per store per month
£5.9m £6.3m (6)%
Loan to deposit ratio 91% 82% +9pp
Net customer loans £14.2b £9.6b +48%
Underlying profit before tax £50m £21m +140%
Cost of risk 7bps 11bps -4bps
Customer NIM + Fees 2.67% 2.69% -2bps
6With a liquid, deposit-funded balance sheet
£’m Annual
FY 2018 FY 2017 Growth
Loans and advances to customers 14,235 9,620 48%
Treasury assets(1) 6,604 6,127 • Liquid balance sheet with a 91%
loan to deposit ratio and 139%
Other assets(2) 808 608
liquidity coverage ratio
Total assets 21,647 16,355 32%
• 93% of the liquidity and
Deposits from customers 15,661 11,669 34% investment portfolio is cash,
Deposits from central banks 3,801 3,321 government bonds and AAA-
Debt securities 249 - rated instruments(3)
Other liabilities 533 269 • TFS drawings of £3.8b invested
Total liabilities 20,244 15,259 33% in low-risk liquid treasury assets
Shareholders’ funds 1,403 1,096 • IFRS 9 adopted from 1 January
Total equity and liabilities 21,647 16,355 32% 2018. Immaterial impact on
CET1 after transitional relief
Capital adequacy & liquidity coverage ratios: • IFRS 16 adopted from 1 January
CET1 capital ratio 13.1% 15.3% - 2019 with an expected £313m
Regulatory leverage ratio 5.4% 5.5% - impact on RWAs
Risk weighted assets 8,936 5,882 +52%
Loan to deposit ratio 91% 82% -
Liquidity coverage ratio 139% 141% -
(1) Investment securities, cash & balances with the Bank of England, and loans & advances to banks.
7 (2) Property, plant & equipment, intangible assets and other assets
(3) Remainder is all investment gradeDriven by core deposit growth
TOTAL CUSTOMER DEPOSIT GROWTH SPLIT OF DEPOSITS BY DIVISION
£15.7b
£4.1b £4.7b
Fixed term: Demand: £7.4b
£11.7b savings current accounts Retail
accounts
£8.0b £15.7b £15.7b
£5.1b
£8.2b
Commercial
82 79 54 61
£6.9b Demand:
2015 2016 2017 2018 savings accounts
Cost of deposits (bps)
AVERAGE DEPOSIT GROWTH PER STORE PER MONTH (£m)
5.3 5.7 6.3 5.9
7.4
6.3 6.6 6.6 6.3
5.9 6.2 6.2
5.5 5.7 5.6 5.5
5.3 5.0 4.7
4.0
Q1 Q2 Q3 Q4 Q1 Q2 Q3 Q4 Q1 Q2 Q3 Q4 Q1 Q2 Q3 Q4
2015 2016 2017 2018
Average for the year
8Underpinning our continued low risk lending
DIVERSIFIED LENDING PORTFOLIO STRONG ASSET QUALITY
Retail: 69% of portfolio Commercial: 31% of portfolio (12bps)
0.27%
£0.3b £0.3b
£2.3b
£1.4b 0.15%
£9.9b £4.4b NPL Ratio
£7.3b
£2.7b 2017 2018
Residential mortgages Professional BTL Non-performing loans £26m £21m
Retail mortgages BTL Commercial loans
Consumer lending Asset & Invoice finance
CONSERVATIVE DEBT TO VALUE PROFILE LOW COST OF RISK (bps) 16 bps
30% 29% UK high-
street bank
Average retail DTV: 61%
Average commercial DTV: 59% average(1)
20% 21% 11bps
19% 20% (4bps)
15% 16%
7bps
11%
9%
4% 3%
2% 1%
Less than 51-60% 61-70% 71-80% 81-90% 91-100% More than 2017 2018
50% 100%
2017 2018
9 1) As of YE2018.Underlying profit before tax growth of 140% year on year
FY FY Annual
£’m
2018 2017 Growth
Net interest income 330.1 241.0
Fees and other income 63.3 49.1
Net gains on sale of assets 10.7 3.7
• Positive operating jaws with income
Total revenue 404.1 293.8 38% growth (+38%) outpacing cost (+31%)
Operating expenses (301.0) (231.4) • 35% increase in depreciation and
amortisation reflects investment in stores
Depreciation and amortisation (45.1) (33.4)
and digital technology
Operating Cost (346.1) (264.8) 31%
• Expected credit loss expense of £8.0m
Expected credit loss expense(1) (8.0) (8.2) remained low, reflecting low-risk lending
and focus on preserving cost of risk
Underlying profit before tax 50.0 20.8 140%
• Modest improvement in Customer NIM to
Underlying taxation (13.4) (4.9) 2.21% reflects competition in the
Underlying profit after tax 36.6 15.9 130% residential mortgage market, offset by
higher Loan to Deposit ratio
Underlying EPS basic 39.4p 18.8p
• Cost of deposits rose by 7bps annually,
Ratios materially below the impact of base rate
Net interest margin 1.81% 1.93% rises in November 2017 and August 2018
Customer net interest margin(2) 2.21% 2.19% (50bps), reflecting our service driven
Customer net interest margin(2) + fees 2.67% 2.69% approach
Cost of Deposits 0.61% 0.54%
Underlying cost to income ratio 86% 90%
Cost of Risk 0.07% 0.11%
(1) Credit impairment charges for FY 2017 (2)Customer NIM eliminates the distortions created by TFS drawings, excludes Tier 2 debt expense, and provides a real
10 measure of how effectively the customer deposits are being put to work.Maintaining a solid capital position
CET1 ratio of 13.1% maintains headroom above our minimum target of 12%
Capital generation Capital consumption
• Total capital ratio of 15.9% supported by equity raise and • 48% growth in lending is the primary driver of capital
Tier 2 debt issuance, and is above our minimum total consumption in 2018
capital requirement of 13.0% • RWA adjustment impacted RWAs by £900m
• Internal capital generation is improving, benefitting from
151% increase in PAT
CET1 AND TOTAL CAPITAL BRIDGE
3.7% 0.4% (0.7%) (0.5%)
(3.6%)
2.8%
(1.5%) 15.9%
15.3%
14.6%
13.1%
CET1% Dec- Equity Retained Intangibles/ Porfolio Lending CET1% Dec- RWA Adj. CET1% Dec- Debt Total Capital
17 Issuance Earnings Other Acquisition Growth/ Mix 18 Pre-Adj 18 Post-Adj Issuance % Dec-18
11RWA adjustment
Adjustment Management Actions
• Quality of assets is unchanged • Completed a review of classification and risk-
weighting across the commercial loan portfolio
• Risk-weights assigned to certain exposures under
the Credit Risk Standardised Approach were • Supported by a “big four” accountancy firm to
revised review the way in which the loan book is classified
• This resulted in a one-off increase in RWAs of • Implementing changes to our internal procedures:
£900m:
• External assurance firm will conduct a
• c. two-thirds of this increase resulted from regular review of our risk-weightings going
commercial loans secured on property as a forward
secondary source of repayment
• Recruitment of additional expertise
• c. one-third resulted from certain professional
• Received initial notification that the PRA and FCA
buy-to-let exposures to portfolio
intend to investigate the circumstances and
landlords/houses in multiple occupation
events that led to the RWA adjustment
• These adjustments have been included in
reported RWAs at December 2018
12STRATEGIC UPDATE AND OUTLOOK
Business model centered around creating FANS through our
     integrated customer experience

                                                        •     Growth retail bank model for modern-day banking centred around an
      Creating FANS through our                               integrated physical and digital experience, “bricks & clicks”
         service-led culture…                           •     Independent CMA survey showed that 83% of personal current account
                                                              customers would recommend us to a friend or family member(1)

        … attracting diversified,                        •     Diversified across commercial/retail with 61bps cost of deposits for FY 2018
      low-cost, sticky deposits…                         •     Current accounts make up 30% of total deposits at FY 2018

        … that enable us to grow                         •     Simple lending products for retail and business
          low-risk, diversified                          •     Customer-centric underwriting focused on low-risk, with 7bps cost of risk
                lending…                                       and 15bps NPL ratio

      …delivering low-risk, high-
                                                         •     FY 2018 underlying profit before tax of £50m up 140% yoy
          quality earnings

14    (1)   Source: CMA Service Quality Surveys published February 2019
2019 is a year of evolution for Metro Bank
Our Core Strengths Key Challenges
• Competitive environment has
Creating FANS through put margins under pressure
our service-led culture… Changed • Macro uncertainty
operating • Continued low interest rate
environment environment
• Ongoing increasing regulatory
… attracting diversified, creating
obligations – MREL, IFRS 16,
headwinds
low-cost, sticky deposits… IFRS 9, PSD II, Open
Banking, GDPR
… that enable us to grow
low-risk, diversified lending… • Operational transformation
required to improve scope for
Specific operational leverage and
challenges efficiency
…delivering low-risk, for Metro • Timing of AIRB approval
Bank • Changed return hurdle rate in
high-quality earnings
certain asset classes
… And building on our core strengths, we are taking action …
15Evolved our strategy to balance growth, profitability and capital
efficiency through an integrated customer experience
Balance growth, profitability and capital efficiency through an
1
integrated customer experience
2 3 4
Rebalance lending Expand range of
mix to optimise services to create Improve cost
capital allocation new sources of efficiency
and returns income
161 Balance growth, profitability and capital efficiency
Moderate deposit and
c.20% • Reduce proportion of higher cost term deposits
associated cost
deposit • Concentrate on relationship current accounts as well as
growth given
growth per variable accounts
prevailing margin
annum
environment
Maintain 85- • Balance loan growth to optimise capital efficiency and
Manage 90% in the profitability
LTD ratio medium to • Transition to slower deposit growth during 2019 may
long term result in temporary LTD ratio in excess of 90%
• Manage store openings (c.8 per annum plus C&I funded
c.8 stores
Store growth stores) to support more investment in digital whilst
per annum
integrated with digital allowing existing stores to mature resulting in higher
plus C&I-
origination and contribution to profitability
funded store
fulfilment • In addition, enter new markets to give new expansion
growth
opportunities using C&I funding
172 Rebalance lending mix towards mortgages and SME to optimise
capital allocation and returns
Overall mix shift to elevate ROE Lending will continue to be built around low risk
mortgages which are cost-efficient and high
ROE
Using C&I funding to broaden business
services, creating opportunities for further SME
and commercial trading business lending
Mortgages 67% 70-75%
Reduce proportion of lower ROE commercial
real estate
Business and
commercial As risk-reward trade off in consumer unsecured
31% 20-25% lending normalises, we will grow unsecured
Consumer lending and credit cards
unsecured 2% 3-7%
2018 2023+
183 Expand fee income through new value added services,
especially for SMEs
Development of SME lending supports capital-light fee income generation
Fee & commission income (% deposits)(1)
Broaden service offering to
deepen customer relationships
0.72 e.g. online business account
opening, expand payments and cash
0.56 management offering
0.46 0.45 Increase penetration of fee-paying
services using digital origination
e.g. integrated payments platform,
on-demand cash collection
Leverage API gateway to offer
innovative fee-paying services
e.g. launch digital ecosystem for
SMEs (digital tax, accounting, etc.)
Metro Bank 1 Bank 2 Bank 3
19 1 FY2018, Net fee and commission divided by average deposits.4 We must increase cost efficiency by driving our operational
leverage now we are achieving scale
We have identified specific initiatives that will enable
Historical Operating Costs(1) us to scale our growth more efficiently
£346m
Operations
£265m
Operations
IT, Digital and
Design
Total savings (%) 100
E.g., integrated
IT, Digital and
Design Head Office automation, adoption of
Head Office Back office 25-30 IVR, shared services
Front Office /
Front Office / Distribution across footprint
Distribution
Stores E.g., Enhanced IDM,
Stores
Stores 20-25
assisted digital
2017 2018 servicing functionality
Cost:income ratio to fall to 55%-60% by 2023 Front office 12-17 E.g., Operating model
simplification to reflect
% 85-90 lending mix shift and
Other 3-7 application of integrated
approach
55-60 Further initiatives 25-30 E.g., Purchasing and
procurement
Benefit profile skewed towards outer years as
digitisation and automation initiatives deliver; but quick
wins to generate momentum in 2019/2020
2019 2023
20 (1) UnderlyingCapability & Innovation Funding
The C&I funding brings the … supporting our three strategic … in a financially
future forwards…. initiatives…. prudent way
▪ Winner of the top award for the Increase coverage ▪ No “Day 1” capital
C&I fund to over two-thirds impacts
Re- of UK SME hot
▪ £120m grant accelerates Metro balanced spots from c.30% ▪ Co-investment
Bank’s growth to become an “at lending currently(1) commitment of
scale” SME challenger by £240m, of which 75%
2025
UK SME hot spots(1)
capitalised
▪ Three main pillars of the Bid ▪ Short-term P&L drag
UK first end to end payments and
but turning positive as
– Accelerating national store New accounts receivable platform
revenue from new
coverage via expanding to sources
Commercial credit card capabilities kicks in
the North with 30 new stores of fee
income ▪ Store opening phased
– Launching game changing Mobile cash pick-up and drop off
over five years with C&I
digital capabilities e.g., funding the first 18
digital tax submission, online months of frontline
account opening New scalable platforms for roles
– Building capabilities to Improved SME lending
▪ Plan to fund 2 stores
serve larger, more complex cost
in 2019, with the
SMEs e.g., sweeping / efficiency E2E digital account remaining balance by
pooling, trade finance opening 2023
21 (1) Charterhouse SME Finance and Banking Report, 2016. Increased coverage includes incremental growth from C&I funding and planned growthMaintaining a strong capital position to support our growth plan
Capital planning
• Plan to raise c.£350m of equity capital in 2019
• Committed standby underwriting by RBC Capital Markets, Equity raise of c.£350m to strengthen capital position
Jefferies, and Keefe, Bruyette & Woods in place to support this
equity raise CET1 Tier 2 MREL eligible debt
TCR + MREL 15.9% >21.5%
• Expected to launch in H1 2019
CET1 13.1% >12%
• In order to meet transitional MREL requirement by 1 January Leverage 5.4% >4%
2020, we also plan to raise c.£500m of MREL eligible debt in Ratio
2019
500 500
• IFRS 16 adopted from 1 January 2019 with an expected £313m
impact on RWAs 350 248
248
Capital policy and assumptions
• Committed to maintaining a strong capital position to support our 1,521
growth plan, including our C&I commitments 1,171
• Target a minimum CET1 ratio of 12% and regulatory
leverage ratio greater than 4% Capital Resources 2019 Equity Raise 2019 MREL Capital Resources
Dec 31 2018 issuance Jan 1 2020
• Continue to work with the PRA on AIRB migration for residential
mortgages. Successful completion expected, but not before
2021
• Meet interim MREL requirement plus buffers of 21.5% on 1 Jan
2020, and end-state MREL requirement plus buffers of 22.5%
from 1 Jan 2022
Total P2A requirement of 1.52%. MREL calculations (2020: 18% of RWAs + buffers, 2022: 2 x (P1+P2A)+buffers; subject to review). Regulatory buffers = 1% CCyB
22
and 2.5% CCB (as of 1 Jan 2019). Excludes any confidential buffers.Our medium-term guidance
Deposit growth c.20% per annum, c.2% share of the market by 2023
c.8 new stores a year plus C&I funded store growth (2
Store growth
stores in 2019)
Average deposits per store
>£4m
per month
Loan to deposit 85% – 90%
Cost of risk 15bps – 30bps through the cycle
Cost to income 55% – 60% by 2023
Capital 12% minimum CET1 ratio and leverage ratio >4%
RoE Low double digit RoE by 2023
23Summary
2019 is a year of evolution for Metro Bank
We will remain a high-growth, low-risk, integrated “bricks & clicks” model focused on
creating FANS…
… but we will build on our core strengths whilst adapting to the challenging operating
environment…
… and leveraging the £120m award from the C&I fund to accelerate our plans for SME…
… whilst delivering cost efficiencies, and balancing growth, profitability and capital
efficiency…
… delivering growing profitability through our unique focus on creating FANS
24Q&A
APPENDIX
QoQ performance
                                                        Q4              Q3             QoQ
£’m
                                                       2018            2018           Growth

Net interest income                                    88.9            84.8                                  •      Customer NIM + fees 1bp increase to 2.67% driven by
Fees and other income                                  18.3            16.2                                         13% growth in fees and other income due to actions
                                                                                                                    taken to extend the range of services
Net gains on sale of assets                             2.0             4.0
                                                                                                             •      Customer NIM reduced by 2bps to 2.19% in Q4
Total revenue                                         109.2           105.0              4%                         reflecting continued competition in the mortgage
                                                                                                                    market, and rising cost of deposits in line with
     Operating expenses                               (87.1)          (76.2)                                        expectations following the August base rate rise
     Depreciation and Amortisation                    (12.9)          (11.7)                                 •      Underlying PBT softened in Q4 as mentioned in the
Operating Cost(1)                                     (96.0)          (87.9)             9%                         January trading update, driven by reversal of
                                                                                                                    operating jaws
Expected credit loss expense                           (2.0)           (2.0)
                                                                                                                      •      Income growth of 4% owing to lower customer
Underlying profit before tax                           11.2            15.1            (26)%                                 NIM and a slowdown in some volumes in
                                                                                                                             November and December as certain transaction
Underlying taxation                                    (4.2)           (3.5)                                                 behaviour slowed (FX, early repayment
Underlying profit after tax                             7.0            11.6            (40)%                                 charges)
                                                                                                                      •      Cost growth of 9% owing to investment spend
Underlying earnings per share                          7.2p           11.9p
                                                                                                                             in stores and technology as well as additional
Ratios                                                                                                                       project costs relating to regulatory change and
Net interest margin                                   1.76%           1.77%                                                  scaling the back-office
Customer net interest margin(2)                       2.19%           2.21%                                  •      Expected credit loss expense of £2.0m remained low,
Customer net interest margin(2) +                                                                                   reflecting previous run rates
                                                      2.67%           2.66%
fees
Cost of Deposits                                      0.67%           0.61%
Underlying cost to income ratio                        88%             84%
Cost of Risk                                          0.06%           0.06%

             1)Underlying costs including Depreciation and Amortisation
27           (2)Customer Deposit NIM eliminates the distortions created by TFS drawings and debt expense, and provides a real measure of how effectively the customer deposits are
             being put to work.
We have identified a set of initiatives to support our targeted
55-60% cost income ratio by 2023
2021+
2020+
2019
Rollout scheduling optimisation New self-serve ATM and card printing functionalities – more convenient
Stores Lean workflow improvements for customers, more efficient for Metro Bank
Additional app functionalities – to do the same
Store redesign to fit future needs of communities and customers
Front Cost optimisation to reflect lending mix shift
office Lean workflow improvements
New digital servicing journeys to offer customers greater choice of channel
IVR, and scripts in the call
(e.g., one customer information system, to streamline tasks and provide better
centres, to improve first-call
Back service to FANS)
resolution for customers
office Process automation in the back office
Lean workflow improvements
Moving back office functions to shared service locations across Metro
Bank markets
Cost optimisation in support Process automation in head office support functions
functions (e.g., HR, IT) – grow with
Head
existing cost base
office
Lean workflow improvements
Test environment automation and simplification to reduce time to
Shift to lower-cost in-house
Digital & market
colleagues / nearshoring
IT Purchasing excellence initiatives focused on IT and related areas given
Lean workflow improvements
proportion of external spend as digital investment grows
28We are facing headwinds posed by the prevailing operating
environment
Current headwinds for a low risk, deposit … growing into increased regulatory
funded model… requirements
Interest rate environment Regulatory requirements change
Bank of England base rate Non-G/D-SIB Requirement(2) • MREL
significantly
8% • Interest rates 21.5% 22.5% increasing
near historically 3.5% 3.5% Capital funding
low levels 13.0% buffers
requirements
4%
• Rate rises 18.0% 19.0% (P1 +
P2A) • External
delayed further x2 environment
0% into the future currently
amid Brexit Total capital Interim MREL End state driving cost of
2007 2009 2011 2013 2015 2017
uncertainty requirement from 1 Jan MREL
ex. MREL 2020 from 1 Jan
debt up
2022 (3) significantly
Competitive environment • Intense
Pace of regulatory change
Mortgage spreads tightening(1) competition in Costs associated with regulatory projects such as:
mortgage pricing
1.5% GDPR
• TFS and now ring- PSDII and Open Banking
fencing (trapped IFRS 9
1.0% liquidity) have IFRS 16
AIRB
driven competition
One-Time Passcode & Authorised Push Payment fraud
and margin Operational Continuity In Resolution compliance
0.5% compression CMA Retail Banking remedies package
Jun 17 Nov 17 Apr 18 Sep 18
(1) Monthly interest rate of UK monetary financial institutions sterling 2 year (75% LTV) fixed rate mortgage to households (Source: Bank of England) against 2Y fixed vs. 3M
29 GBP LIBOR (Source: Bloomberg). (2) Subject to Partial Transfer / Bail-in regime. (3) Subject to reviewAnnual cohorts start and grow faster(1)
Average Store Deposits
Months open
1 4 7 10 13 16 19 22 25 28 31 34 37 40 43 46 49 52 55 58 61 64 67 70 73 76 79 82 85 88 91 94
2010 2011 2012 2013 2014 2015 2016 2017
(1) 2010 excludes Holborn. Data as at 31 December 2018. Excludes stores opened in the last 12 months
30Capital, funding and liquidity
CET1 TARGET VS REQUIREMENTS AS PERCENTAGE OF RWAs(1) FUNDING SPLIT(2)
Target CET1
ratio of c.12%
£0.2b £0.3b
Retail deposits £3.8b
1.0% Countercyclical buffer
Business and commercial £7.4b
2.5% Capital Conservation buffer
deposits
1.1% Tier 1 component of P2A TFS funding
10.6%
Debt securities
6.0% Tier 1 component of P1
Repo £8.2b
End-state minimum Tier 1 requirement
LOAN TO DEPOSIT RATIO LIQUIDITY RESOURCES BY RATING(3)
91% AAA AA- to AA+ A- to A+ Lower than A-
82% £0.1b
74% £0.1b
69%
£0.6b
£9.6b
£4.1b
£3.3b
2015 2016 2017 2018
(1) Refers to Tier 1 requirement vs CET1 capital target because we currently have no AT1 in our capital stack. 6.0% Tier 1 component of P1 = 4.5% CET1 requirement +
31 1.5% AT1 allowance (currently all CET1). 1.1% Tier 1 component of P2A = 75% of total 1.5% P2A (2) At 31 Dec 2018 (excludes equity) (3) At 31 Dec 2018 (excludes
cash and cash equivalents)Retail mortgage portfolio (1/2)
TOTAL RETAIL MORTGAGES - OWNER OCCUPIED AND BTL SPLIT TOTAL RETAIL MORTGAGES DEBT-TO-VALUE PROFILE
£6.2b £9.6b Average retail mortgage lending
28% 27%
73% 76% DTV is 61% vs 60% in 2017
23%
20% 20%
18% 18% 18%
14%
11%
27% 24%
2% 1% 1% 0%
Less than 51-60% 61-70% 71-80% 81-90% 91-100% More than
2017 2018 50% 100%
OO BTL 2017 2018
TOTAL RETAIL MORTGAGES REPAYMENT TYPE TOTAL RETAIL MORTGAGES GEOGRAPHIC SPLIT
£6.2b £9.6b 54% Greater London 9.8%
52% South east 3.9%
5.6%
South west
48% 6.1% 44.3%
£9.6b
East of England £9.6b
46% £4.1b
7.7%
North west
West Midlands
22.7%
Rest of UK
2017 2018
Interest only Capital and interest
At 31 Dec 2018
32Retail mortgage portfolio (2/2)
OWNER-OCCUPIED RETAIL MORTGAGES
DEBT-TO-VALUE PROFILE REPAYMENT TYPE GEOGRAPHY
31%
29%
69% 70%
Greater London 10%
22%
South east 4%
19% 19%
17% 16% 16% 6%
16%
South west 41%
12% 31% 30%
7%
East of
England
2% 1% North west 8%
1%0%
West Midlands
< 50% 51-60% 61-70% 71-80% 81-90% 91-100% >100% 2017 2018
24%
2017 2018 Interest only Capital and interest Rest of UK
RETAIL BUY-TO-LET
DEBT-TO-VALUE PROFILE REPAYMENT TYPE GEOGRAPHY
26%
25%24% 25%
95% 95% Greater London
22%
20% 20% 10%
19% South east
4%
South west 6%
£9.6b
£4.1b
East of England 4%
8% 5% 54%
6% North west
5% 5%
2% 1%
1% 1% West Midlands
2017 2018 17%
< 50% 51-60% 61-70% 71-80% 81-90% 91-100% >100% Rest of UK
Interest only Capital and interest
2017 2018
At 31 Dec 2018
33Commercial lending
DEBT-TO-VALUE PROFILE INDUSTRY SECTOR
36% Industry Sector 31 Dec 31 Dec
33% 2018 (£m) 2017 (£m)
24% Real estate (rent, buy and sell) 2,547 1,704
22% 21%
18% Legal, accountancy and 384 304
12% 11%
consultancy
7%
7% Health and social work 217 214
4%3%
1%1% Hospitability 235 185
< 50% 51-60% 61-70% 71-80% 81-90% 91-100% >100%
Real estate (management of) 72 104
2017 2018
Retail 99 84
GEOGRAPHY
Construction 60 69
Greater London 1% 3%
4% Investment and unit trusts 1 21
4%
South east 6%
Recreation, cultural and sport 19 18
South west
£9.6b
Real estate (development) £4.1b52 26
East of England
18%
North west Education 15 4
64%
West Midlands Other 127 83
Rest of UK
34 At 31 Dec 2018Disclaimer
This presentation (the "Presentation") does not constitute or form part of an offer or invitation to sell or a solicitation of an offer to buy or subscribe for or otherwise acquire any securities in any
jurisdiction or an inducement to engage in investment activity. There shall be no offers or sales of shares or other securities in any jurisdiction in which such offer or sale would be unlawful prior to
registration or qualification under the securities laws of such jurisdiction. Any securities offered by Metro Bank plc (the "Company") will not be registered under the U.S. Securities Act of 1933 (the
"Securities Act") and may not be offered or sold in the United States absent registration under the Securities Act or an applicable exemption to registration. The Company does not intend to make any
public offering of its securities in the United States.
The matters described in this Presentation are subject to discussion and amendment, and neither it nor any part of it shall form the basis of, or be relied on in connection with, any contract to purchase or
subscribe for any securities of the issuer or any subsidiary or affiliate of or related to the Company nor shall it or any part of it form the basis of or be relied on in connection with any contract or
commitment whatsoever. This Presentation does not, and is not intended to, constitute or form part of, and should not be construed as, an offer or invitation to sell, or a solicitation of an offer to
purchase, subscribe for or otherwise acquire, any securities of Company, nor shall it or any part of it form the basis of or be relied upon in connection with or act as any inducement to enter into any
contract or commitment or investment decision whatsoever.
To the extent available, the industry, market and competitive position data contained in this presentation come from official or third party sources. Third party industry publications, studies and surveys
generally state that the data contained therein have been obtained from sources believed to be reliable, but that there is no guarantee of the accuracy or completeness of such data. While the Company
reasonably believes that each of these publications, studies and surveys has been prepared by a reputable source, the Company has not independently verified the data contained therein. In addition,
certain of the industry, market and competitive position data contained in this presentation come from the Company's own internal research and estimates based on the knowledge and experience of the
Company's management in the markets in which the Company operates and the current beliefs of relevant members of management. While the Company reasonably believes that such research and
estimates are reasonable and reliable, they, and their underlying methodology and assumptions, have not been verified by any independent source for accuracy or completeness and are subject to
change. Accordingly, reliance should not be placed on any of the industry, market or competitive position data contained in this presentation.
The information contained in this document does not purport to be comprehensive. None of the Company or its subsidiary undertakings or affiliates, or their directors, officers, employees, advisers or
agents accepts any responsibility or liability whatsoever for/or makes any representation or warranty, express or implied, as to the truth, fullness, fairness, accuracy or completeness of the information in
this presentation (or whether any information has been omitted from the presentation) or any other information relating to the Company, its subsidiaries or associated companies, whether written, oral or
in a visual or electronic form, and howsoever transmitted or made available or for any loss howsoever arising from any use of this presentation or its contents or otherwise arising in connection therewith.
To the fullest extent permissible by law, such persons disclaim all and any responsibility or liability, whether arising in tort, contract or otherwise, which they might otherwise have in respect of this
presentation. This presentation has not been verified and is subject to verification, correction, completion and change without notice.
The information and opinions contained in this presentation are provided as at the date of the presentation, are subject to change without notice and do not purport to contain all information that may be
required to evaluate the Company. None of the Company or its subsidiary undertakings or affiliates, or their respective directors, officers, employees advisers or agents, or any other party undertakes or
is under any duty to update this presentation or to correct any inaccuracies in any such information which may become apparent or to provide you with any additional information. No reliance may, or
should, be placed for any purpose whatsoever on the information contained in this presentation or on its completeness, accuracy or fairness. Recipients should not construe the contents of this
presentation as legal, tax, regulatory, financial or accounting advice and are urged to consult with their own advisers in relation to such matters.
This presentation contains forward-looking statements. Forward-looking statements are not historical facts but are based on certain assumptions of management regarding our present and future
business strategies and the environment in which we will operate, which the Company believes to be reasonable but are inherently uncertain, and describe the Company’s future operations, plans,
strategies, objectives, goals and targets and expectations and future developments in the markets. Forward-looking statements typically use terms such as "believes", "projects", "anticipates", "expects",
"intends", "plans", "may", "will", "would", "could" or "should" or similar terminology. Any forward-looking statements in this presentation are based on the Company's current expectations and, by their
nature, forward-looking statements are subject to a number of risks and uncertainties, many of which are beyond the Company’s control, that could cause the Company’s actual results and performance
to differ materially from any expected future results or performance expressed or implied by any forward-looking statements. As a result, you are cautioned not to place undue reliance on such forward-
looking statements. Past performance should not be taken as an indication or guarantee of future results, and no representation or warranty, express or implied, is made regarding future performance.
Some of the information is still in draft form and will only be finalised, if legally verifiable, at a later date. The Company undertakes no obligation to release the results of any revisions to any forward-
looking statements in this presentation that may occur due to any change in its expectations or to reflect events or circumstances after the date of this presentation and the parties named above disclaim
any such obligation.
35You can also read