Cheniere Energy, Inc - Capital Allocation Update

Page created by Greg Burton
 
CONTINUE READING
Cheniere Energy, Inc - Capital Allocation Update
Cheniere Energy, Inc.
Capital Allocation Update

September 2021

NYSE American: LNG
Cheniere Energy, Inc - Capital Allocation Update
Safe Harbor Statements
Forward-Looking Statements
This presentation contains certain statements that are, or may be deemed to be, “forward-looking                   •   statements that our Trains, when completed, will have certain characteristics, including amounts of liquefaction
statements” within the meaning of Section 27A of the Securities Act of 1933, as amended, and Section 21E               capacities;
of the Securities Exchange Act of 1934, as amended. All statements, other than statements of historical or         •   statements regarding our business strategy, our strengths, our business and operation plans or any other plans,
present facts or conditions, included or incorporated by reference herein are “forward-looking                         forecasts, projections or objectives, including anticipated revenues, capital expenditures, maintenance and operating
statements.” Included among “forward-looking statements” are, among other things:                                      costs, free cash flow, run rate SG&A estimates, cash flows, EBITDA, Consolidated Adjusted EBITDA, distributable cash
•   statements regarding the ability of Cheniere Energy Partners, L.P. to pay or increase distributions to its         flow, distributable cash flow per share and unit, deconsolidated debt outstanding, and deconsolidated contracted
    unitholders or Cheniere Energy, Inc. to pay or increase dividends to its shareholders or participate in            EBITDA, any or all of which are subject to change;
    share or unit buybacks;                                                                                        •   statements regarding projections of revenues, expenses, earnings or losses, working capital or other financial items;
•   statements regarding Cheniere Energy, Inc.’s or Cheniere Energy Partners, L.P.’s expected receipt of           •   statements regarding legislative, governmental, regulatory, administrative or other public body actions, approvals,
    cash distributions from their respective subsidiaries;                                                             requirements, permits, applications, filings, investigations, proceedings or decisions;
•   statements that Cheniere Energy Partners, L.P. expects to commence or complete construction of its             •   statements regarding our anticipated LNG and natural gas marketing activities;
    proposed liquefied natural gas (“LNG”) terminals, liquefaction facilities, pipeline facilities or other
                                                                                                                   •   statements regarding the outbreak of COVID-19 and its impact on our business and operating results, including any
    projects, or any expansions or portions thereof, by certain dates or at all;
                                                                                                                       customers not taking delivery of LNG cargoes, the ongoing credit worthiness of our contractual counterparties, any
•   statements that Cheniere Energy, Inc. expects to commence or complete construction of its proposed                 disruptions in our operations or construction of our Trains and the health and safety of our employees, and on our
    LNG terminals, liquefaction facilities, pipeline facilities or other projects, or any expansions or portions       customers, the global economy and the demand for LNG; and
    thereof, by certain dates or at all;
                                                                                                                   •   any other statements that relate to non-historical or future information.
•   statements regarding future levels of domestic and international natural gas production, supply or
                                                                                                                   These forward-looking statements are often identified by the use of terms and phrases such as “achieve,” “anticipate,”
    consumption or future levels of LNG imports into or exports from North America and other countries
                                                                                                                   “believe,” “contemplate,” “continue,” “could,” “develop,” “estimate,” “example,” “expect,” “forecast,” “goals,” ”guidance,”
    worldwide, or purchases of natural gas, regardless of the source of such information, or the
                                                                                                                   “intend,” “may,” “opportunities,” “plan,” “potential,” “predict,” “project,” “propose,” “pursue,” “should,” “subject to,”
    transportation or other infrastructure, or demand for and prices related to natural gas, LNG or other
                                                                                                                   “strategy,” “target,” “will,” and similar terms and phrases, or by use of future tense. Although we believe that the
    hydrocarbon products;
                                                                                                                   expectations reflected in these forward-looking statements are reasonable, they do involve assumptions, risks and
•   statements regarding any financing transactions or arrangements, or ability to enter into such                 uncertainties, and these expectations may prove to be incorrect. You should not place undue reliance on these forward-
    transactions;                                                                                                  looking statements, which speak only as of the date of this presentation. Our actual results could differ materially from
•   statements regarding the amount and timing of share repurchases;                                               those anticipated in these forward-looking statements as a result of a variety of factors, including those discussed in
•   statements relating to the construction of our proposed liquefaction facilities and natural gas                “Risk Factors” in the Cheniere Energy, Inc. and Cheniere Energy Partners, L.P. Annual Reports on Form 10-K filed with the
    liquefaction trains (“Trains”) and the construction of our pipelines, including statements concerning the      SEC on February 24, 2021, which are incorporated by reference into this presentation. All forward-looking statements
    engagement of any engineering, procurement and construction ("EPC") contractor or other contractor             attributable to us or persons acting on our behalf are expressly qualified in their entirety by these ”Risk Factors.” These
    and the anticipated terms and provisions of any agreement with any EPC or other contractor, and                forward-looking statements are made as of the date of this presentation, and other than as required by law, we
    anticipated costs related thereto;                                                                             undertake no obligation to update or revise any forward-looking statement or provide reasons why actual results may
                                                                                                                   differ, whether as a result of new information, future events or otherwise.
•   statements regarding any agreement to be entered into or performed substantially in the future,
    including any revenues anticipated to be received and the anticipated timing thereof, and statements
    regarding the amounts of total LNG regasification, natural gas, liquefaction or storage capacities that        Reconciliation to U.S. GAAP Financial Information
    are, or may become, subject to contracts;                                                                      The following presentation includes certain “non-GAAP financial measures” as defined in Regulation G under the
•   statements regarding counterparties to our commercial contracts, construction contracts and other              Securities Exchange Act of 1934, as amended. Schedules are included in the appendix hereto that reconcile the non-
    contracts;                                                                                                     GAAP financial measures included in the following presentation to the most directly comparable financial measures
                                                                                                                   calculated and presented in accordance with U.S. GAAP.
•   statements regarding our planned development and construction of additional Trains or pipelines,
    including the financing of such Trains or pipelines;
         2
Cheniere Energy, Inc - Capital Allocation Update
Agenda

    Introduction              Randy Bhatia
                              Vice President, Investor Relations

    Company Highlights        Jack Fusco
                              President and Chief Executive Officer

    Capital Allocation Plan   Zach Davis
                              Senior Vice President and Chief Financial Officer

    Q&A

3
Cheniere Energy, Inc - Capital Allocation Update
Company Highlights
Jack Fusco, President and CEO
Cheniere Energy, Inc - Capital Allocation Update
5 Years: From Developer to World Class LNG Operator

            1,700+                                       #2                                                  ~200%                                                              1,520
            CARGOES EXPORTED FROM                        SECOND LARGEST                                      INCREASE IN LNG                                                    FULL-TIME EMPLOYEES
            CHENIERE PROJECTS                            LIQUEFACTION PLATFORM                               SHARE PRICE
                                                         GLOBALLY

            +5 mtpa                                      36                                                  ~$14 bn
            INCREASE IN RUN RATE                         COUNTRIES & REGIONS                                 CONS. ADJ. EBITDA
            PRODUCTION CAPACITY                          DELIVERED TO FROM                                   GENERATED SINCE 2016                                                                                 CCL Train 3 SC
                                                         CHENIERE

            >6,500 TBtu                                  10%+                                                                                                     COVID-19 Pandemic
            OF NATURAL GAS NOMINATED                     OF GLOBAL LIQUEFACTION
            TO SPL/CCL                                   CAPACITY
                                                                                                                                             1,000th Cargo

                                                                                                                          CCL Train 2 SC
            25%                                                                                             SPL Train 6 FID
            TOP QUARTILE SAFETY
            PERFORMANCE                                                                      SPL Train 5 SC
                                                                                   CCL Train 1 SC

                                                          CCL Train 3 FID
                            100th Cargo
       SPL Train 2 SC                   SPL Train 4 SC
5   SPL Train 1 SC                                                          Note: Graph reflects cumulative LNG production from Sabine Pass & Corpus Christi. Consolidated Adjusted EBITDA is a non-GAAP measure. A definition of this non-
                    SPL Train 3 SC                                          GAAP measure and a reconciliation to Net income attributable to common stockholders, the most comparable U.S. GAAP measure, is included in the appendix.
Cheniere Energy, Inc - Capital Allocation Update
“All of the Above” Capital Allocation Strategy
                                           Cheniere has reached its cash flow inflection point, enabling execution on balance sheet,
    GUIDING PRINCIPLES
                                                                      capital return, and growth priorities

                                        Position Cheniere Capital Complex for Future Success
                                        ▪ Plan for ~$1 billion of annual debt repayment until investment grade credit metrics
      Strengthen Balance Sheet
                                        ▪ Target investment grade balance sheet by early-to-mid 2020s
                                        ▪ Long term sustainable balance sheet supports financial flexibility

                                        Create Shareholder Value through Financially Disciplined Organic Growth
      Fund Financially                  ▪ Plan to FID Corpus Christi Stage 3 in 2022
      Disciplined Growth                ▪ Further organic growth with commitment to disciplined investment parameters
                                        ▪ Develop environmental solutions opportunities along the LNG value chain

                                        Sustainable Return of Shareholder Capital
      Return Capital to                 ▪ Initiating quarterly dividend at $0.33/share declared today
      Shareholders
                                        ▪ Plan to grow dividend at mid-single digits, in line with S&P 500 average growth rate
                                        ▪ Share repurchases resumed in Q3. Reset $1 billion share buyback program in Q4 for 3 years

6                  Capital Allocation      Operational Excellence      ESG and Climate         Growth and Strategy
Cheniere Energy, Inc - Capital Allocation Update
Achieving Excellence Across the Cheniere Platform
    Confident in continued successful execution and ability to achieve                                                                          Sabine Pass Train 6 substantial completion expected in Q1 2022,
      financial results at the high end of the 2021 guidance ranges                                                                                 roughly one year ahead of schedule and within budget

     Full Year 2021 Guidance                                                                       +>$700MM
     Consolidated Adj. EBITDA, $ in billions
                                                                                                               $4.9

                                                                                $4.6
                                                                                                               $4.6
                                                $4.4

                $4.2
                                                                               $4.3

                                                $4.1

                $3.9

      November 2020                    February 2021                       May 2021                     August 2021

      2021 outlook supported by improved global LNG pricing, strong
      execution of forward LNG sales, and increased expected production

Note: Consolidated Adjusted EBITDA is a non-GAAP measure. A definition of these non-GAAP measures and a reconciliation to Net income (loss) attributable to common stockholders, the most comparable U.S. GAAP measure, is included in the appendix.

7                                                 Capital Allocation                           Operational Excellence                               ESG and Climate                               Growth and Strategy
Cheniere Energy, Inc - Capital Allocation Update
Cheniere’s Leadership on Climate & Sustainability
                Guided by our Climate & Sustainability Principles, we are a company that can help meet the world’s energy needs
                                               while integrating sustainability into our business

     Climate and Sustainability Principles                   Quantification, Monitoring, Reporting,                                  Cargo Emissions Tags
             established in 2018                                   and Verification (QMRV)

                            Science

                 Supply               Operational
                 Chain                Excellence

                                                            Collaboration with natural gas suppliers and academic        Cheniere plans to provide estimated greenhouse gas
                          Transparency
                                                           institutions to quantify, monitor, report, and verify GHG      emissions data associated with each LNG cargo to
                                                                    emissions at natural gas production sites                             customers in 2022

      Collaboratory to Advance Methane                           Corporate Responsibility Reports                                   GHG Life Cycle Analysis
         Science Co-Founded in 2018

   First-of-its-kind shipping study to directly measure    Annual Corporate Responsibility reports which highlight     First-of-its-kind peer-reviewed, LNG life cycle assessment
methane emissions from an LNG carrier completed in 2021     Cheniere’s resiliency, responsible operations and ESG       published in the American Chemical Society Sustainable
                                                                                    initiatives                                      Chemistry & Engineering Journal

8                                     Capital Allocation   Operational Excellence             ESG and Climate              Growth and Strategy
Cheniere Energy, Inc - Capital Allocation Update
Corpus Christi Stage 3

       Continued Commercial Momentum Across Platform                                                  Corpus Christi Stage 3 Progress
    ~45 mtpa platform ~90% contracted through mid-20s and ~85% longer term                  Competitive Advantages Drive Confidence in 2022 FID

            Term LNG sales executed in 2021 with diverse customer base                     Brownfield Economics
                          to increase cash flow visibility:
                                                                                    Corpus Christi Stage 3 to leverage significant in-place infrastructure
        ✓    Multiple European Utilities           ✓   Supermajor

        ✓    Asian Utility                         ✓   North American Producer             Tailored Solutions

        ✓    Latin American Utility                ✓   LNG Marketer                 Stage 3 expected to be underpinned by FOB, DES, and IPM contracts
                                                                                    with customers from Europe, Asia, and North America

                                                                                           Bridging Volumes
                        Creditworthy Counterparties
                                                                                    Differentiated platform enables market-leading flexibility for customers to
            ~4.5 mtpa of available long-term contracts to support Stage 3
                                                                                    procure early volumes without a condition precedent necessary

                                                                                           ESG Leadership
                                                                                    ESG leadership and action emerging as strategic commercial
                                                                                    differentiator, helping secure term LNG sales in 2021

                             Expect FID of Corpus Christi Stage 3 in 2022 once investment parameters are met

9                             Capital Allocation           Operational Excellence   ESG and Climate              Growth and Strategy
Cheniere Energy, Inc - Capital Allocation Update
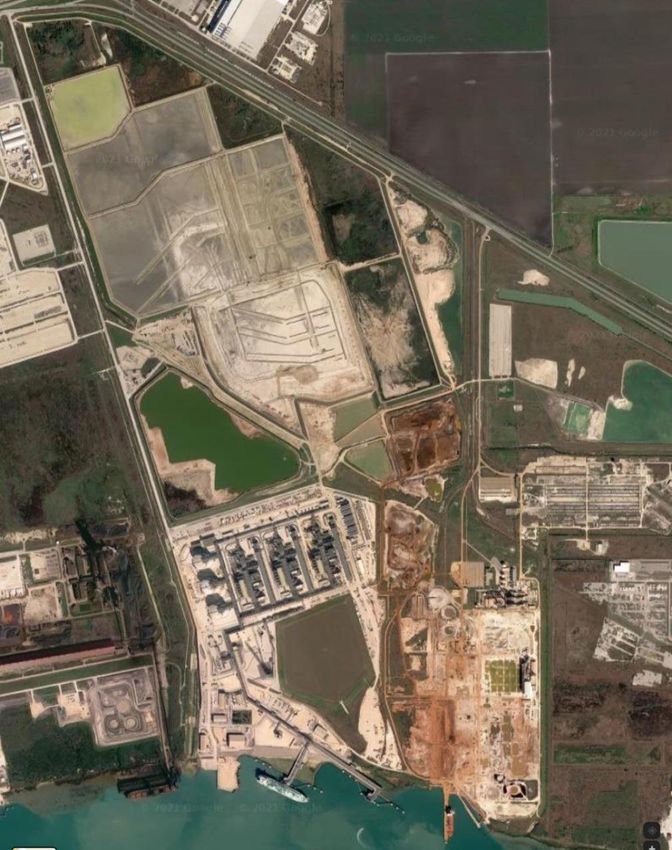
Potential Growth Opportunities at Corpus Christi and Sabine Pass
                                                                        LNG Platform Growth Strategy
                                                       • Corpus Christi Stage 3 is shovel-ready and represents an incremental ~10+ mtpa of
                                                         liquefaction capacity
                                                       • Additional potential expansions at Corpus Christi and Sabine Pass would be designed to
                                                         leverage shared infrastructure to deliver cost competitive LNG capacity additions

       Stage 3                                         • Significant land position in Corpus Christi and Sabine Pass provides potential development
                                                         and investment opportunities for further liquefaction capacity expansion beyond Stage 3 at
                                                         strategically advantaged locations with proximity to pipeline infrastructure and resources

                                                        Illustrative Future Growth Potential

                                                                              10+ mtpa            1-2 mtpa
                                                             ~45 mtpa
                             Additional Land
                              For Expansion

        Trains 1-3
                                                          9-Train Platform    CCL Stage 3       Debottlenecking     Potential Future      Potential Future
                                                                                                                  Corpus Christi Growth Sabine Pass Growth

                                                       Potential development of significant future brownfield capacity additions

10               Capital Allocation            Operational Excellence         ESG and Climate             Growth and Strategy
Capital Allocation Plan
Zach Davis, Senior Vice President and CFO
Cheniere’s Capital Allocation Plan

              Today we are announcing an “All of the Above” Capital Allocation Plan

                DEBT                                                           SHARE
      A                                  B      DIVIDEND                C                           D       GROWTH
              PAYDOWN                                                       REPURCHASE

     Target ~$1 Billion Annually Until           Initiation of          Share Repurchase Program   Invest in Robust Organic Growth
        Investment Grade Metrics         Inaugural Quarterly Dividend       Reset to $1 Billion        in Corpus Christi Stage 3

          Started This Year                  Declared Today             Restarted This Quarter          Target FID Next Year

12
Cheniere Has Reached Its Cash Flow Inflection Point
                                                                                              Capital Expenditure Needs Have Been                                                   … Accelerating Distributable Cash Flow
     Unprecedented Period of                                                                  Greatly Reduced…                                                                      and Opportunity for Capital Returns
     Investment Concludes
     ▪ To date, Cheniere has invested
       ~$30 billion of capital and

                                                                                                                                                                            Distributable Cash Flow
Capital Allocation Plan Efficiently Utilizes Projected DCF
Capital return strategy expected to deliver significant value to both equity and debt stakeholders by creating a sustainable
     balance sheet, providing financial flexibility for growth and increasing run-rate distributable cash flow per share
Capital Allocation Plan Through 2024 Targets Investment Grade (“IG”) Metrics, Stage 3 FID and Meaningful Shareholder Returns

                  ~$10 bn                                                                                                                                                                                                         Unallocated excess cash over time
                                                                                                                                                                                                                                  may be allocated to accelerate debt
                                                        A
                                                                                                                                                                                                                                 paydown and share repurchase goals
                                                                ~$4 bn                                                                                                                                                                       in near term

                                                                                                      B       ~$1 bn
                                                                                                                                                   C        ~$1 bn
                                                                                                                                                                                                 D                                                     ~$2 bn
                                                                                                                                                                                                         ~$2 bn

           2021 - 2024 DCF (1)                            Debt Paydown                                      Dividend                              Share Repurchases                                      Stage 3(2)                     Additional Cash Available

 Capital Return Element Breakdown                                                                                                                                                                 Capital through 2024                           Annual $ / Share
  ▪A ~$1 bn debt paydown per year until Cheniere reaches IG metrics                                                                                                                                          ~$4 bn                                      ~$4 / sh
     ▪B    $1.32 / share, annualized dividend initiated with targeted mid-single digit growth                                                                                                                ~$1 bn                                      ~$1 / sh
     ▪C    $1 bn share repurchase program to reset for another 3 years in Q4                                                                                                                                 ~$1 bn                                      ~$1 / sh
                     −      Share repurchases commenced in Q3 under previous authorization
 Total Base Capital Return                                                                                                                                                                                   ~$6 bn                                     ~$6 / sh
  ▪D Stage 3 equity funding(2)                                                                                                                                                                               ~$2 bn                                      ~$2 / sh
 Additional Cash Available (Additional Capital Returns, Growth, Debottlenecking, ESG)                                                                                                                        ~$2 bn                                      ~$2 / sh
 Total Cash Available                                                                                                                                                                                       ~$10 bn                                    ~$11 / sh

      Note: $ in bn unless otherwise noted. Distributable Cash Flow per Share (“DCF”) is a non-GAAP measure. We have not made any forecast of net income on a run-rate basis, which would be the most directly comparable measure under GAAP, and we are unable to
            reconcile differences between these run-rate forecasts and net income. See Slide 27 for further detail on run-rate guidance. Future dividends will be subject to Board of Directors approval.
14    (1) “DCF” stands for Distributable Cash Flow. Assumes CMI sales at strip through 2023, $2.25 / MMBtu thereafter.
      (2) Figure represents ~2.5 years of Stage 3 funding (illustratively assumed FID in 2H 2022 through 2024). Stage 3 expected to be complete 5 years after FID.
Cheniere’s Substantial Run-Rate Cash Generation
Fast approaching 9 trains in operation and projected run-rate distributable cash flow of ~$2.6 – ~$3.0 billion per year

                                                                                                                                                 Annual Capital Allocation
                                                                                                                                                  ▪ ~$0.2 - ~$0.6 bn of additional capital annually:
                                                                                                                                                     – Excess cash after liquidity, Stage 3, other growth or ESG initiatives
                                                                                                    ~$0.2 - ~$0.6 bn
                 Run-Rate Annual                                                                                                                       needs
                 DCF Guidance of                                                                                                                     – May accelerate debt paydown and share repurchase goals in near term
                 ~$2.6 - ~$3.0 bn
                                                                                                                                                D▪ Expected Stage 3 equity contributions to average ~$0.8 bn annually
                                                                                                         ~$0.8 bn                                   – Assumes Stage 3 FID in 2022
                                                                                                                                                    – Based on ~50/50 debt to equity funding

                                                                                                                                                C▪ ~$0.3 bn of annual share repurchases
                                                                                                         ~$0.3 bn                                   – 3-year program
                                                                                                                                                    – May be accelerated with excess capital allocation
                                                                                                         ~$0.3 bn                               B▪ ~$0.3 bn of dividends paid to shareholders annually
                                                                                                                                                    – Expected to grow in mid-single digits annually
                                                                                                                                                    – May grow faster once balance sheet goals met

                                                                                                                                                A▪ ~$1.0 bn of debt paydown annually
                                                                                                         ~$1.0 bn
                                                                                                                                                    – To be prioritized until investment grade metrics
                                                                                                                                                    – May be accelerated with excess capital allocation

              Run-Rate DCF / Year                                                         Capital Allocation Uses / Year

             Sustainable shareholder returns expected to grow further once initial balance sheet goals are met by early-to-mid-2020s

     Note: Distributable Cash Flow per Share (“DCF”) is a non-GAAP measure. We have not made any forecast of net income on a run-rate basis, which would be the most directly comparable measure under GAAP, and we are unable to reconcile differences
15   between these run-rate forecasts and net income. See Slide 27 for further detail on run-rate guidance. Dividends will be subject to Board of Directors approval.
Capital Allocation Priorities
                                                ▪ Prioritize targeting investment grade leverage metrics by early-to-mid-2020s (less than 5x
            Long-Term Sustainable                 consolidated debt-to-EBITDA)
     A
                Balance Sheet                   ▪ Maintain investment grade balance sheet to support financial flexibility for growth, commercial
                                                  efforts, capital market access and steady shareholder return objectives

                                                ▪ Provide steady and meaningful capital returns to our shareholders in addition to growth and
                                                  stronger balance sheet
                                                ▪ Initiate quarterly dividend in Q3 with plan to grow at mid-single digit growth rate through mid-
     B
                  Meaningful                      2020s, in line with S&P 500 average yield and growth rate
                                                   – $0.33 Q3 dividend ($1.32 annualized) to be paid on November 17th, 2021
              Shareholder Returns
     C                                          ▪ Reset share repurchase program to $1 billion for an additional 3 year authorization
                                                   – Share repurchases commenced in Q3 under previous authorization; reset to $1 billion in Q4
                                                   – Structured to be opportunistic on share price dislocations and support run-rate DCF per share

                                                ▪ Corpus Christi Stage 3: ~10+ mtpa shovel-ready brownfield expansion project
                                                ▪ Committed to maintaining disciplined capital investment parameters consistent with CCL Train 3
     D          Accretive Growth                  and SPL Train 6
                                                ▪ Approach funding of growth such that it also supports balance sheet goals
                                                ▪ Continued focus on ESG initiatives supporting long-term sustainability of assets

Projected ~$10 billion of cumulative DCF enables achievement of all capital allocation priorities to create long-term sustainable value

16
A       Balance Sheet Strategy Built for Sustainability
             As one of the largest U.S. natural gas transportation holders and end consumers, global LNG operators and
             LNG vessel charterers, it is imperative to Cheniere’s long-term strategy to be an investment grade company
 Cheniere’s Path to Investment Grade Metrics
             Consolidated EBITDA Growth                                                                         Consolidated Debt Paydown                                                                           Investment Grade Metrics

                                                 ~$6.7 bn                                                                                                                                                                                            ~4.9x
                                                (With Stage 3)                                                                                                                                                                                 (Prior to Stage 3)
                                                                                                                                  ~$4.0 bn
                                                                                                                                    ( YTD(1) )                                                                            ~5.6x
                                                  ~$5.5 bn                                                                                                                                                                                            ~4.7x
                                                  (9T Only)                                                                                                                                                                                       (With Stage 3)
                            $4.6 - $4.9 bn
           ~$4.0 bn                                                                                                                 $~3.5 bn

             2020A              2021E             Run-Rate                                                                       Debt Paydown                                                                             9-Train          Pro Forma Capital Allocation
                                                                                                                                                                                                                      (S tatus Quo)              (Debt Paydown)

Large portion of EBITDA growth is hard-wired from                                                   Target ~$1 billion of debt paydown per year until
                                                                                                                                                                                                              Targeting consolidated leverage of
B    Inaugural LNG Dividend

                                                                                                                FLEXIBILITY FOR
           INAUGURAL YIELD                                   DIVIDEND GROWTH
                                                                                                               FUTURE GROWTH
     ▪   $0.33 Q3 dividend equates to yield of         ▪   Expected annual dividend growth rate        ▪   Dividend size reflects not only other
         ~1.5%, above S&P 500 yield of ~1.3%               target of mid-single digits, in-line with       capital allocation needs, but provides
                                                           S&P 500 dividend growth rate                    flexibility for Cheniere to pursue future
     ▪   Provides for stable shareholder cash return                                                       growth opportunities in a fiscally
                                                       ▪   Cheniere plans to continue growing
     ▪   Sized with consideration of other capital         return to shareholders                          responsible manner through cycles
         allocation priorities                                                                         ▪   Dividend meaningful, but modest in
                                                       ▪   Growth rate can be revised upward in
     ▪   Provides opportunity for yield-focused            mid-2020s once initial capital allocation       comparison to distributable cash flow
         equity investors to participate in the            objectives are reached (ex: IG metrics)
         Cheniere story at LNG

                    Dividend initiation represents steady shareholder returns consistent with our long-term contracted profile

18
C     LNG Share Repurchase Plan
 Reset share repurchase program back to $1 billion beginning in Q4
         – Restarted share repurchases in Q3 under previous 2019 authorization, which since inception has repurchased ~7 million shares for over $400 million
         – Cheniere has also reduced run-rate share count by ~40 million shares through opportunistic redemption of two convertible notes with the CEI Term Loan
           raised in 2020 (since repaid)
 Provides flexible and tax efficient shareholder return
         – Share repurchases can be accelerated with excess cash after growth initiatives have been accounted for
 Actual share repurchase timing expected to vary each quarter
         – Capital to be allocated to share repurchases each quarter with actual amount purchased based on projected return embedded in LNG share price
         – Program provides ability to be opportunistic based on valuation dislocations or accelerated repurchases with excess cash

Run-Rate Share Count Reduction (in million shares)
                    ~300

                                                  ~(50)
                                                                                  ~255
                                                                                                                                                  ~245
                                                                                                                 ~(10)

           Original Run-Rate Share           CEI Term Loan +               Status Quo Run-Rate               $1 bn Buyback               Run-Rate Share Count
                Count (2019)                     Buybacks                      Share Count                      Program                  with Capital Allocation

                           Aim to repurchase shares beyond $1 billion over time and continue to increase run-rate DCF per share

19
D       Stage 3 Progressing to Anticipated FID in 2022
                       Commitment to accretive growth and reaching FIDs only when investment parameters are met
                                                                                                                                                                                                                                        Pro Forma including
                                                                                                                                                               Run-Rate 9-Trains                          CCL Stage 3                       CCL Stage 3
     Cheniere’s Disciplined Investment Parameters

                     Highly Contracted                                                                                                                                                                  ~$1.1 bn - ~$1.2 bn                  ~$6.4 - ~$6.9 bn

     ✓               Targeting 85% to 95% of liquefaction capacity under long-term                                                                                    ~$5.3 - ~$5.7 bn
                                                                                                                                            Adjusted
                     contracts with creditworthy customers that can pay back
                                                                                                                                             EBITDA
                     unlevered costs in ~10 years                                                                                           Forecast

                     Value Accretive

     ✓
                                                                                                                                                                                                                                             ~$3.5 - ~$4.0 bn
                     Earn attractive unlevered returns at the project level under                                                                                                                       ~$0.9 bn - ~$1.0 bn
                                                                                                                                                                      ~$2.6 - ~$3.0 bn
                     conservative LNG market margin scenarios that can out-earn
                                                                                                                                               DCF
                     CEI cost of equity / return in prevailing LNG stock price
                                                                                                                                             Forecast

                     Credit Accretive

     ✓               Target conservative funding at 50/50 debt to equity to create
                     credit accretive growth that is supportive of IG metrics goal
                                                                                                                                             Expected Stage 3
                                                                                                                                              Project Metrics
                                                                                                                                                                                     ~$600 - $700 / Ton(1)                         ~6x Capex / EBITDA(1)

     Note:    Distributable Cash Flow per Share (“DCF”) and Adjusted EBITDA are non-GAAP measures. We have not made any forecast of net income on a run-rate basis, which would be the most directly comparable measure under GAAP, and we are unable to
20            reconcile differences between these run-rate forecasts and net income. See Slide 27 for further detail on run-rate guidance.
     (1)      Unlevered cost before financing costs and contingency.
Summary Capital Allocation
                                                                                            Status Quo(1)                                                         Capital Return                                                                        Growth + Capital Return
                                                                                                                                                                                                                                                                            (2)
                                                                                        9 Train Run-Rate                                9 Train Run-Rate                               % Δ vs. Status Quo                         9 Trains + CCL Stage 3                               % Δ vs. Status Quo

      Consolidated Debt                                                                          ~$31 bn                                        ~$27 bn                                        ~(10)%                                           ~$31 bn                                               –

      Consolidated EBITDA                                                                ~$5.3 - ~$5.7 bn                                 ~$5.3 - ~$5.7 bn                                          –                                    ~$6.4 - ~$6.9 bn                                       ~20%
      Consolidated Leverage                                                                 ~5.4x - ~5.8x                                   ~4.8x - ~5.0x                                      ~(10)%                                       ~4.5x - ~4.9x                                      ~(20)%

      DCF / Share                                                                            ~$10 - ~$12                                     ~$11 - ~$13                                        ~15%                                         ~$15 - ~$17                                        ~45%
      Share Count                                                                              ~255 mm                                         ~245 mm                                          ~(5)%                                          ~245 mm                                          ~(5)%

     Run-Rate DCF / Share                                                                                                                                         Run-Rate Debt / EBITDA
 ($ / share)

                                                                                              ~$4

                                                                                                                                                                                                                          ~0.7x
                                                         ~$2

                                                                                                                                                                                                                                                               ~0.2x
                                                                           ~45%                                                   ~$15
                                                                                                                                 - ~$17                                               ~5.4x
                                                                                                                                                                                     - ~5.8x                                           ~(20)%
                   ~$10
                   - ~$12                                                                                                                                                                                                                                                                              ~4.5x
                                                                                                                                                                                                                                                                                                      - ~4.9x

               Run-Rate Today                    Capital Allocation                         Stage 3                            Pro Forma                                        Run-Rate Today                      Capital Allocation                        Stage 3                             Pro Forma

                        “All of the Above” Capital Allocation Plan designed to reach ~$16 DCF / share on a run-rate basis
      Note:       Run rate EBITDA and Distributable Cash Flow per Share (“DCF”) figures assume further contracting and CMI sales of $2.00 / MMBtu for the low end of the range and $2.50 / MMBtu for the high end of the range. DCF and Adjusted EBITDA are non-GAAP measures. We have not made any
                  forecast of net income on a run-rate basis, which would be the most directly comparable measure under GAAP, and we are unable to reconcile differences between these run-rate forecasts and net income. See Slide 27 for further detail on run-rate guidance.
21    (1)         Prior to capital allocation realized year-to-date through 2021.
      (2)         Assumes Stage 3 run-rate achieved ~5 years after FID.
Cheniere Energy, Inc.
Appendix
Underpinned By Long-Term Creditworthy Contracts
Breadth and Depth of Counterparties                                                                                                                                                         External Long-Term Customers(2)
 ▪     Over $6 billion of annual fixed-fee, take-or-pay style revenues(1)
                                                                                                                                                                                                                                NR 5%
 ▪     All customers rated as investment grade by at least two of the three major agencies (S&P, Moody’s,
                                                                                                                                                                                                                                AA- to AA+ Rated
       Fitch) or deemed investment grade by lenders(2)                                                                                                                                                                          27%

 ▪     Average portfolio rating of A- / A3 / A- by S&P / Moody’s / Fitch respectively(2)                                                                                                                                        A- to A+ Rated
                                                                                                                                                                                                                                24%
 ▪     Average remaining life of contracts ~18                          years(2)
                                                                                                                                                                                                                                BBB- to BBB+ Rated
                                                                                                                                                                                                                                44%

Long-Term Customers
     Sabine Pass Liquefaction: Trains 1-6
                                                                                                                                                                                                                                   SPA To Be
                                                                                                                                                                                                                                   Determined
     (A+ / Aa2 / AA-)            (BBB / Baa2 / BBB)                (AA / Aa2 / AA-)             (NR / Baa3 / BBB-)               (A / A1 / AA-)             (BBB / Baa2 / NR)          (NR / NR / NR)        (A / A2 / BBB+)      (Investment Grade)

     Corpus Christi Liquefaction: Trains 1-3

      (BBB / Baa2 / BBB)          (BBB / Baa2 / BBB)             (BBB+ / Baa1 / A-)           (BBB+ / Baa1 / BBB+)            (BBB+ / Baa1 / BBB+)              (BBB+ / A3 / A-)        (BBB / Baa3 / BBB)     (NR / NR / NR)           (A+ / A1 / A+)

     Corpus Christi Liquefaction: Stage 3                                                                                                      Cheniere Marketing (SPAs Assignable to Projects)

          (BB+ / Ba1 / BB+)                         (A- / A3 / NR)                        (NR / NR / NR / BBB (high)(3))                                                       (AA- / Aa3 / AA)              (NR / Baa2 / BBB+)

                                              Contracted portfolio is foundation of Cheniere’s long-term sustainable cash flow profile
      Note:    Ratings denote S&P, Moody’s, Fitch and subject to change, suspension or withdrawal at anytime and are not a recommendation to buy, hold or sell any security.
      (1)      Includes long-term, mid-term, and short-term SPAs and IPM agreements.
23    (2)      Includes long-term SPAs and IPM agreements.
      (3)      Represents credit rating from DBRS Morningstar.
Balance Sheet Strategy Accelerates Ratings Progress
     Focus on simple consolidated credit metrics for corporate entities CEI and CQP
         – Target less than 5x consolidated debt-to-EBITDA by early-to-mid-2020s to achieve investment grade credit metrics
     Pay down ~$4 billion of consolidated debt through 2024 to reach targeted
Cheniere Debt Summary
                              Cash Balance: ~$1.8 bn(1)

 Cheniere Energy, Inc.                                                                                                       Cheniere Energy, Inc.
 ~$0.63 bn Convertible Notes due 2045 (4.250%)
 $2.00 bn Senior Unsecured Notes due 2028 (4.625%)
                                                                                                                            (NYSE American: LNG)
 $1.25 bn Senior Secured Revolving Credit Facility due 2022                                                                                                                                                                                Cheniere Corpus Christi Holdings, LLC
 (undrawn)                                                                                                                                                                                                                                 $1.25 bn Notes due 2024 (7.000%)
                                                                                                                                                                                                                                           $1.50 bn Notes due 2025 (5.875%)
                                                                                                                                                                                                                                           $1.50 bn Notes due 2027 (5.125%)
                                                                                                                                                                                                                                           $1.50 bn Notes due 2029 (3.700%)
                                                                                CQP GP                                                                                                    Cheniere Corpus                                  ~$2.72 bn Notes due 2039(2)
                                                                                                                              Cheniere Marketing                                                                                           $1.20 bn Working Capital Facility due 2023
                                                                                (& IDRs)                                                                                                  Christi Holdings                                 ~$1.78 bn Credit Facility due 2024

 Cheniere Energy Partners, L.P.
 $1.10 bn Notes due 2026 (5.625%)                                   Cheniere Energy
 $1.50 bn Notes due 2029 (4.500%)                                                                                                                                Corpus Christi                                        Cheniere Corpus
 $1.50 bn Notes due 2031 (4.000%)                                     Partners, L.P.
                                                                                                                                                                  Liquefaction                                          Christi Pipeline
 $0.75 bn Senior Secured Revolving                                (NYSE American: CQP)
 Credit Facility due 2024

                                                                                                                                                                                    Sabine Pass Liquefaction, LLC
                                                                        Cheniere Creole                                               Sabine Pass                                   $1.00 bn Notes due 2022 (6.250%)
              Sabine Pass LNG                                                                                                                                                       $1.50 bn Notes due 2023 (5.625%)
                                                                         Trail Pipeline                                               Liquefaction                                  $2.00 bn Notes due 2024 (5.750%)
                                                                                                                                                                                    $2.00 bn Notes due 2025 (5.625%)
                                                                                                                                                                                    $1.50 bn Notes due 2026 (5.875%)
                                                                                                                                                                                    $1.50 bn Notes due 2027 (5.000%)                                             Publicly Traded Equity
                                                                                                                                                                                    $1.35 bn Notes due 2028 (4.200%)
                                                                                                                                                                                                                                                                 Operating Entity
                                                                                                                                                                                    $2.00 bn Notes due 2030 (4.500%)
                                                                                                                                                                                    $0.80 bn Notes due 2037 (5.000%)                                             Non-Operating Entity
                                                                                                                                                                                    $1.20 bn Working Capital Facility due 2025

     Note:    This organizational chart is provided for illustrative purposes only, is not and does not purport to be a complete organizational chart of Cheniere. Total commitments for Term Loan, Credit, and Working Capital facilities are shown above and are
              inclusive of undrawn balances.
25   (1)      Unrestricted cash balance as of June 30, 2021. Includes unrestricted cash of $1.2 bn held by Cheniere Energy Partners, L.P.
     (2)      Includes 4 separate tranches of notes reflecting a range of interest rates from 2.742% to 4.800%. Amount and range of interest rates pro forma for $0.75 bn senior secured amortizing issuance that took place August 2021.
Run-Rate Guidance

                                                                                                                                                                                                                                                                                                 9 Trains +
                                                                                                                                                                                                                                                                         (1)
                                                                                                                                                                                               9 Trains                                  CCL Stage 3                                           CCL Stage 3
                                                                                                                                                                                                (Full Year)                                          (Full Year)                                          (Full Year)
                                                                                                                                                                                                 SPL T1-6                                               Stage 3                                            SPL T1-6
                                                                                                                                                                                                 CCL T1-3                                                                                                  CCL T1-3
 ($ bn)                                                                                                                                                                                                                                                                                                      Stage 3

CEI Consolidated Adjusted EBITDA                                                                                                                                                     $5.3 - $5.7)                                            $1.1 - $1.2)                                        $6.4 - $6.9)

     Less: Distributions to CQP Non-Controlling Interest                                                                                                                        $(0.9) - $(1.0)                                                             $0.0)                           $(0.9) - $(1.0)

     Less: CQP / SPL Interest Expense / Maintenance Capex / Other                                                                                                                                    $(1.0)                                                 $0.0)                                           $(1.0)

     Less: CEI / CCH Interest Expense / Maintenance Capex / Other                                                                                                                                    $(0.8)                                               $(0.2)                                            $(1.0)

CEI Distributable Cash Flow                                                                                                                                                          $2.6 - $3.0)                                          $0.9 - $1.0)                                          $3.5 - $4.0)

     Note:   Numbers may not foot due to rounding. Range driven by production range of 4.9 – 5.1 MTPA per train and marketing margin of $2.00 - $2.50 / MMBtu. Additional assumptions include 80/20 profit-sharing tariff with SPL/CCH projects, $3.00 / MMBtu Henry Hub, 5.00% interest rates for
             refinancings, and assignment of an additional SPA to SPL as committed by CEI prior to Train 6 substantial completion. Average tax rate as percentage of pre-tax cash flow expected to be 0-5% in the 2020s and 15-20% in the 2030s. Consolidated Adjusted EBITDA, Distributable Cash Flow,
26           Distributable Cash Flow per Share and Distributable Cash Flow per Unit are non- GAAP measures. A definition of these non-GAAP measures is included in the appendix. We have not made any forecast of net income on a run rate basis, which would be the most directly comparable
             measure under GAAP, in part because net income includes the impact of derivative transactions, which cannot be determined at this time, and we are unable to reconcile differences between these run rate forecasts and net income.
     (1)     Assumes 50 / 50 debt / equity funding. Range drive by further contracting and CMI sales margin of $2.00 - $2.50 / MMBtu.
Forecasting Points
General Assumptions
▪    Production range of 4.9 – 5.1 mtpa per train
▪    CMI sales assume range of $2.00 - $2.50 / MMBtu and include 80 / 20 profit-sharing tariff with SPL / CCL projects
▪    Long-term Henry Hub price of $3.00 / MMBtu
▪    Refinancing rate of 5.00% for maturing debt
▪    Assignment of one additional SPA to SPL as committed by CEI prior to Train 6 substantial completion

Dividend Assumptions
▪    $0.33 dividend ($1.32 annualized) to be paid in November 17th, 2021

Stage 3 Assumptions
▪    FID of 2H 2022
▪    Production capacity of >10 mtpa across 7 Trains
▪    Contracted capacity includes signed IPMs and one assignable SPA
▪    Further contracting and CMI sales assume range of $2.00 - $2.50 / MMBtu

Tax Assumptions
CEI Cash Tax Payments Begin                                                                                                     Early – Mid 2020s
CEI 2020 – 2030 Tax Rate Percentage of Pre-Tax Cash Flow                                                                            0 – 5%
CEI 2031 – 2040 Tax Rate Percentage of Pre-Tax Cash Flow                                                                           15 – 20%

▪    2020 – 2030 CEI tax rate primarily due to “80% NOL limitation” on NOLs generated post-enactment of Tax Cuts and Jobs Act
▪    As of December 31, 2020, CEI’s NOL carryforward is equal to ~$15 billion

27
Market Dynamics Point to a Tightening LNG Market
     LNG capacity additions tapering off as markets continue to expand                               Supply growth has been curtailed, with FIDs on >90 mt of projects
                        and legacy supply depletes                                                                    delayed or cancelled in 2020

     Annual LNG Capacity Additions(1)                                                                Volume of LNG Project FIDs by Year
     Surplus market conditions in 2020 were compounded by COVID-19 pandemic                          ~100 mtpa of forecasted LNG supply project FIDs stalled by market conditions in
                                                                                                     2020(2)
     Rapid market recovery, weather-driven demand and supply constraints have
     resulted in a swing to a tight market in 2021                                                   Few FIDs expected this year beyond Qatar’s NFE expansion
     Underlying market fundamentals point to structural market tightness in 2022+                    Current market conditions favor easier-to-progress expansion projects with
     and in the mid-term market                                                                      bridging volumes, as buyers seek volume and project certainty
                                                                                                           mtpa
       mtpa                                                                                                                                                               Up to 100 mtpa of FIDs
                      2017 to 2020 = 116 mt                                                          100                                                                     were forecasted
      50
                                                                                                      90

                                                                                                      80
      40                                                                                                                                                                    71
                                                                                                      70
                                                                         2021-2024 = 48 mt
      30                                                                                              60

                                                                                                      50

      20                                                                                              40
                                                                                                                                        30                                                     32
                                                                                                                  27             29
                                                                                                      30                 23                    22                  21            Total FIDs
      10                                                                                              20

                                                                                                      10                                              4      3                      3.3
       0                                                                                               0
              2017       2018        2019        2020        2021        2022         2023    2024                2011   2012   2013   2014   2015   2016   2017   2018   2019     2020       2021

      Sources: Cheniere Research, GIIGNL, Wood Mackenzie for historical figures.
28    (1) Capacity additions include project debottlenecking.
      (2) Next period of rapid supply growth (mid/late 2020’s) likely deferred / moderated.
Market Fundamentals Support LNG Growth for Decades

                                           Driven by growing economies and demand for secure, affordable and cleaner-burning fuels

     Global LNG Supply Outlook                                                                                                                      Natural Gas Drivers
     70 mtpa of incremental LNG supply needed by 2030 and 225 mtpa needed by 2040
                                                                                                                                                           Displacing Coal and Oil
     700                                                                                  LNG Trade
                                                                                           Forecast                                                 Meeting the desire of growing economies worldwide to displace
                                                                                                                                                    less clean-burning fuels with secure, affordable natural gas

                                                                                                                                New Supply
     600                                                                                                     +225 mtpa

     500                                                                                                                                                   Enabling Renewables

                                                                                                                                                    A functional role in meeting energy demand and stabilizing energy
     400
                                                                                                                                                    systems
                                                                                                                                                    • Balancing renewables

                                                                                                                               Under Construction
                                                                                                                                Operational and
     300                                                                                                                                            • Meeting seasonal demand

     200                                                                                                                                                   Climate Scenario Analysis

     100                                                                                                                                            Incremental LNG supply required to meet growing LNG demand
                                                                                                                                                    under multiple long-term climate scenarios analyzed
                                                                                                                                                    • Natural gas expected to play major role in energy transition
       -                                                                                                                                            • Resiliency and sustainability of natural gas demand for decades
           2010            2015               2020              2025               2030              2035               2040

29    Source: Cheniere Research estimates (July 2021), Wood Mackenzie for historical figures. Area chart includes all recent FIDs through February 2021 (up to and including QG NFE).
Reconciliation to Non-GAAP Measures
Regulation G Reconciliations
This presentation contains non-GAAP financial measures. Consolidated Adjusted EBITDA, Distributable Cash Flow, Distributable Cash Flow per Share, and Distributable Cash Flow per Unit are non-GAAP financial measures that we use to facilitate comparisons of operating performance
across periods. These non-GAAP measures should be viewed as a supplement to and not a substitute for our U.S. GAAP measures of performance and the financial results calculated in accordance with U.S. GAAP and reconciliations from these results should be carefully evaluated.
Consolidated Adjusted EBITDA is commonly used as a supplemental financial measure by our management and external users of our consolidated financial statements to assess the financial performance of our assets without regard to financing methods, capital structures, or historical
cost basis. Consolidated Adjusted EBITDA is not intended to represent cash flows from operations or net income as defined by U.S. GAAP and is not necessarily comparable to similarly titled measures reported by other companies.
We believe Consolidated Adjusted EBITDA provides relevant and useful information to management, investors and other users of our financial information in evaluating the effectiveness of our operating performance in a manner that is consistent with management’s evaluation of
financial and operating performance.
Consolidated Adjusted EBITDA is calculated by taking net income attributable to common stockholders before net income attributable to non-controlling interest, interest expense, net of capitalized interest, changes in the fair value and settlement of our interest rate derivatives, taxes,
depreciation and amortization, and adjusting for the effects of certain non-cash items, other non-operating income or expense items, and other items not otherwise predictive or indicative of ongoing operating performance, including the effects of modification or extinguishment of
debt, impairment expense and loss on disposal of assets, changes in the fair value of our commodity and FX derivatives prior to contractual delivery or termination, non-cash compensation expense, and non-recurring costs related to our response to the COVID-19 outbreak which are
incremental to and separable from normal operations. The change in fair value of commodity and FX derivatives is considered in determining Consolidated Adjusted EBITDA given that the timing of recognizing gains and losses on these derivative contracts differs from the recognition of
the related item economically hedged. We believe the exclusion of these items enables investors and other users of our financial information to assess our sequential and year-over-year performance and operating trends on a more comparable basis and is consistent with management’s
own evaluation of performance.
Distributable Cash Flow is defined as cash received, or expected to be received, from Cheniere’s ownership and interests in CQP and Cheniere Corpus Christi Holdings, LLC, cash received (used) by Cheniere’s integrated marketing function (other than cash for capital expenditures) less
interest, taxes and maintenance capital expenditures associated with Cheniere and not the underlying entities. Management uses this measure and believes it provides users of our financial statements a useful measure reflective of our business’s ability to generate cash earnings to
supplement the comparable GAAP measure.
Distributable Cash Flow per Share and Distributable Cash Flow per Unit are calculated by dividing Distributable Cash Flow by the weighted average number of common shares or units outstanding.
We believe Distributable Cash Flow is a useful performance measure for management, investors and other users of our financial information to evaluate our performance and to measure and estimate the ability of our assets to generate cash earnings after servicing our debt, paying cash
taxes and expending sustaining capital, that could be used for discretionary purposes such as common stock dividends, stock repurchases, retirement of debt, or expansion capital expenditures. Management uses this measure and believes it provides users of our financial statements a
useful measure reflective of our business’s ability to generate cash earnings to supplement the comparable GAAP measure.
Distributable Cash Flow is not intended to represent cash flows from operations or net income (loss) as defined by U.S. GAAP and is not necessarily comparable to similarly titled measures reported by other companies.
Non-GAAP measures have limitations as an analytical tool and should not be considered in isolation or in lieu of an analysis of our results as reported under GAAP and should be evaluated only on a supplementary basis.

Note:
We have not made any forecast of net income for fiscal years 2022-2024 or on a run rate basis, which would be the most directly comparable financial measure under GAAP, in part because net income includes the impact of derivative transactions, which cannot be determined at this
time, and we are unable to reconcile differences between run rate Consolidated Adjusted EBITDA and Distributable Cash Flow and income.
                          Consolidated Adjusted EBITDA                                                                                                                                          Consolidated Adjusted EBITDA and Distributable Cash Flow
                          The following table reconciles our Consolidated Adjusted EBITDA to U.S. GAAP results for the six months ended June 30, 2021 and full years 2016 - 2020 (in            The following table reconciles our actual Consolidated Adjusted EBITDA and Distributable Cash Flow to Net
                          millions):
                                                                                                                                                                             Six Months
                                                                                                                    Year Ended December 31,                              Ended June 30,                                                                                                  Full Year
                                                                                                       2016          2017            2018          2019         2020                2021                                                                                                    2021
                          Net income (loss) attributable to common stockholders                 $      (610)    $    (393)      $    471      $    648     $     (85)    $            64        Net income attributable to common stockholders                                   $      0.8 - $         1.2
                            Income (loss) attributable to non-controlling interest                      (55)         956             729           584          586                  376         Net income attributable to non-controlling interest                                    0.7 -           0.8
                            Income tax provision (benefit)                                                  2             3           27           (517)         43                       (4)    Income tax provision                                                                   0.1 -           0.3
                            Interest expense, net of capitalized interest                              488           747             875          1,432        1,525                 724         Interest expense, net of capitalized interest                                                          1.5
                            Loss on modification or extinguishment of debt                             135           100              27            55          217                   59         Depreciation and amortization expense                                                                  1.0
                            Interest rate derivative loss (gain), net                                    10               (7)         (57)         134          233                       1      Other expense, financing costs, and certain non-cash operating expenses                0.5 -           0.1
                            Other expense (income), net                                                 -             (18)            (48)          25          112                  (10)       Consolidated Adjusted EBITDA                                                     $      4.6 - $         4.9
                          Income from operations                                                $       (30)    $   1,388       $   2,024     $   2,361    $   2,631     $         1,210         Distributions to Cheniere Partners non-controlling interest                            (0.6) -        (0.7)
                          Adjustments to reconcile income from operations to                                                                                                                     SPL and Cheniere Partners cash retained and interest expense                           (1.5) -        (1.4)
                          Consolidated Adjusted EBITDA                                                                                                                                           Cheniere interest expense, income tax and other                                                       (0.7)
                            Depreciation and amortization expense                                      174           356             449           794          932                  494        Cheniere Distributable Cash Flow                                                 $      1.8 - $         2.1
                            Loss (gain) from changes in fair value of commodity and FX
                            derviatives, net                                                            (37)           33             77           (355)        215                  711
                            Total non-cash compensation expense                                          35            28             76           123          108                   61
                            Impairment expense and loss (gain) on disposal of assets                     13            19                 8         23               6                    (1)
                            Legal settlement expense                                                    -             -                   7         -            -                   -
                            Incremental costs associated with COVID-19 response                         -             -               -             -            69                  -
          30              Consolidated Adjusted EBITDA                                          $      155      $   1,824       $   2,641     $   2,946    $   3,961     $         2,475
Investor Relations Contacts

Randy Bhatia
Vice President, Investor Relations – (713) 375-5479, randy.bhatia@cheniere.com

Frances Smith
Manager, Investor Relations – (713) 375-5753, frances.smith@cheniere.com

Zak Broderick
Senior Analyst, Investor Relations – (713) 375-5308, zak.broderick@cheniere.com

© 2021 Cheniere Energy, Inc. All Rights Reserved
You can also read