European Telecom And Cable: Sector Outlook And Hot Topics - April 2018
←
→
Page content transcription
If your browser does not render page correctly, please read the page content below
European Telecom And Cable:
Sector Outlook And
Hot Topics

Osnat Jaeger
Director & Lead Analyst

Matthias Raab
Senior Director, Analytical Manager

EMEA Corporate Ratings

April 2018
EMEA Telecom & Technology Team
                                                                                            THIERRY GUERMANN
                                                                                            DIRECTOR, Stockholm
                                                                                            thierry.guermann@spglobal.com

                                                                                              SANDRA WESSMAN
                                                                                              ASSOCIATE, Stockholm
        OSNAT JAEGER                                                                          sandra.wessman@spglobal.com
        DIRECTOR, London
        osnat.jaeger@spglobal.com

        EJIKEME OKONKWO
                                                                                                                                               Moscow
        ASSOCIATE, London                                                Stockholm
        ejikeme.okonkwo@spglobal.com

        PAUL REILLE
        GRADUATE, London                                                                                                                       SVETLANA ASHCHEPKOVA
        paul.reille@spglobal.com                                                                                                               ASSOCIATE DIRECTOR, Moscow
                                                                                                                                               svetlana.ashchepkova@spglobal.com

                                                                               MATTHIAS RAAB
                                                                               SENIOR DIRECTOR, ANALYTICAL MANAGER,
                                            London                             Frankfurt
                                                                               matthias.raab@spglobal.com

     MARK HABIB                                                                LUKAS PAUL
                                                             Frankfurt
     DIRECTOR, Industry Specialist, Paris                                      ASSOCIATE DIRECTOR, Frankfurt
     mark.habib@spglobal.com                         Paris                     lukas.paul@spglobal.com

                                                                              GABRIEL ZWICKLHUBER
     XAVIER BUFFON                                                            Graduate, Frankfurt
     DIRECTOR, Paris                                                          gabriel.zwicklhuer@spglobal.com
     xavier.buffon@spglobal.com

     JUSTINE MIQUEE
     ASSOCIATE, Paris                                         Milan
     justine.miquee@spglobal.com
                  Madrid                                                                                                                                            TOMMY TRASK
                                                                                                                                                                    DIRECTOR, Dubai
     THIBAUD LAGACHE                                                                                                                                                tommy.trask@spglobal.com
     ASSOCIATE, Paris                                                                                                          Istanbul
     Thibaud.lagache@spglobal.com
                                                                                                                                                                    RAWAN OUEIDAT
                                                                                                                                                                    ASSOCIATE DIRECTOR, Dubai
                                                                                                                                                                    rawan.oueidat@spglobal.com

                                                                                                                OMEGA COLLOCOTT                                  Tel-Aviv
                                                                                                                DIRECTOR, Johannesburg
                                                                                                                omega.collocott@spglobal.com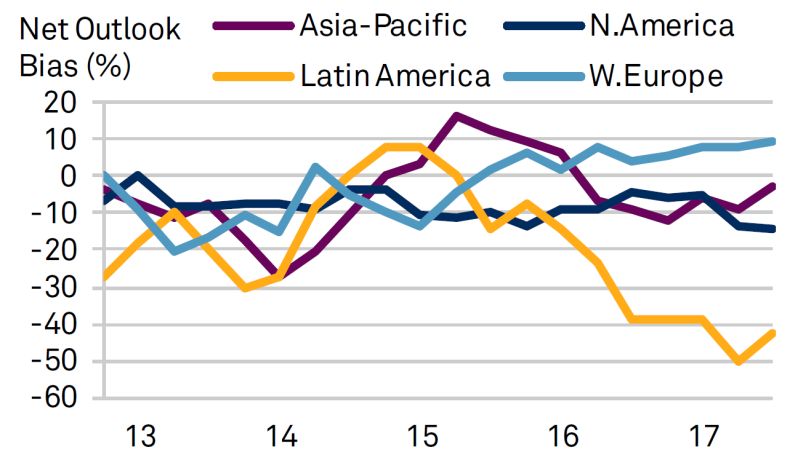
Agenda

1. Macro Picture
2. Key Themes and Trends
3. Ratings and Outlook Distribution

                                      3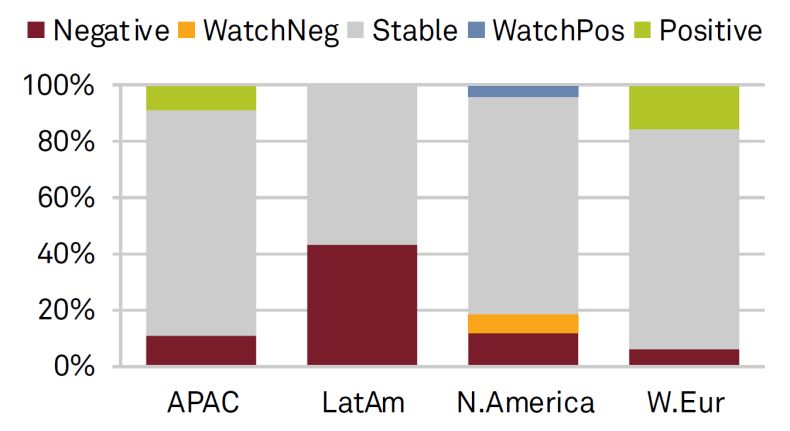
Macro Picture

                4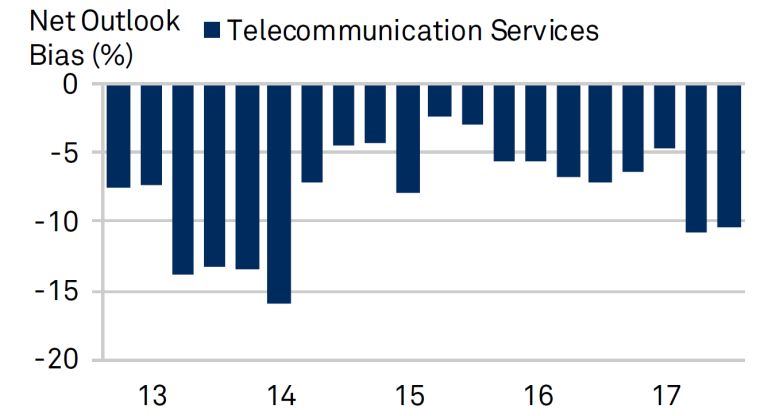
Global Telecom’s Rating Distribution & Outlook

 Source: S&P Global Ratings: Industry Top Trends 2018: Telecommunications – November 16, 2017.

                                                                                                 5
European Macroeconomic Improvement Clouded By Brexit
S&P European Economic Forecasts Overall - Macroeconomic prospects in the Eurozone, but not
the U.K., have improved as political uncertainty has eased.
Real GDP Unemployment This is broadly reflected in a stable credit outlook across most
Baseline forecast Baseline forecast
nonfinancial corporate sectors as well as banks and insurance.
(%) 2017a 2018f 2019f 2017a 2018f 2019f Risks and imbalances - The top risks in Europe relate to Brexit,
de-globalization, populism, asset price volatility, as well as
Germany 2.5 2.4 1.9 3.8 3.5 3.4 geopolitical risk; for the Middle East and Africa the top risks are
external debt, geopolitics, and the Fed rates.
France 2.0 2.2 1.8 9.4 8.8 8.4
Italy 1.5 1.5 1.3 11.3 10.8 10.3 Macroeconomics conditions - Eurozone growth is being led by
domestic demand and investment, and is becoming increasingly
Spain 3.0 2.7 2.3 17.2 15.1 14.1 inclusive across the region. Confidence in the U.K economy is
slipping, with few evident signs of compromise in the Brexit
Netherlands 3.2 2.8 2.2 4.9 4.1 3.7
negotiations so far.
Belgium 1.7 1.8 1.6 7.2 6.4 6.2
Financing conditions - Credit conditions in Europe remain very
Eurozone 2.5* 2.3 1.9 9.1 8.2 7.8 relaxed and likely to remain so, especially in the Eurozone, in
absence of a pick-up in underlying inflation. While not
U.K. 1.7 1.3 1.5 4.4 4.5 4.6 expected, further weakening in the U.S. dollar may push back
the end of the ECB's asset purchase program.
Switzerland 1.0* 2.3 1.7 3.2 3.0 2.9
Israel 3.1 3.2 3.2 4.5 4.4 4.4
*S&P Forecast.
Source: S&P Global Economics, Oxford Economics – April 2018.
6Key Themes
7Stable Outlook on Balanced Credit Drivers
Driver Risk Opportunity
Competition Remains intense in most markets,
among telcos and with cablecos
Fixed services Secular cord cutting and pay-TV Uptake of fiber, more regular price
disruption by OTT increases, and penetration of bundling and
content
Mobile services Roaming phase out and Higher data volumes helping to stabilize
commoditization of voice/SMS prices
Investment/Costs Capex to remain high on fixed network Modest margin improvements from cost-
upgrades. Increasing content costs. cutting and synergies from prior M&A
Financial policy Rising demand for shareholder returns Conservative policies from first half of the
decade largely maintained to date
Regulation Tough M&A approval requirements and Bulk of MTR cuts already absorbed
risk of increased asset regulation
Macro economic Brexit Mildly positive European macro prospects.
Low interest rates support liquidity/FOCF.
But what will drive future growth?
Private & Confidential 8Financial Outlook for European Telecoms (2017-2018)
POSITIVE, BUT LOW GROWTH DRIVEN BY CABLE MODEST MARGIN GROWTH AHEAD
SUSTAINED HIGH INVESTMENTS RISING FREE OPERATING CASH FLOW
Note: Telcos – top 13 telecom companies; Cablecos – top 9 cable companies; f-Forecast
Source: S&P Global Ratings
9Top 5 European Telcos: Return to growth in 2017
Operational KPIs
Revenue growth YoY (%) S&P adj EBITDA margin (%)
43.7%
37.4%
33.2% 31.1% 33.1%
4.3% 2014A 2014A
2.5%
0.4% 2015A 2015A
2016A 2016A
-0.9% -0.6%
2017A 2017A
Vodafone Deutsche Orange Telecom Telefonica
Telekom Italia Vodafone Deutsche Orange Telecom Telefonica
Telekom Italia
S&P adj CAPEX/sales (%) IMPROVING, BUT UNCERTAIN GROWTH PROSPECTS
27.8%
25.8% Revenue growth YoY (%),
19.6% organic Q1-17 Q2-17 Q3-17 Q4-17
18.2% 16.8% 2014A Vodafone 0.2% 3.5% 2.7% 3.7%
2015A Deutsche Telekom 5.7% 6.1% 1.1% 2.7%
2016A Orange 0.8% 1.4% 0.9% 1.8%
2017A
Telecom Italia 2.6% 3.7% 1.8% 2.8%
Telefonica 1.5% 3.1% 4.0% 4.8%
Vodafone Deutsche Orange Telecom Telefonica
Telekom Italia All organic growth relates to constant FX and perimeter.
DT organic growth relates to constant perimeter
Source: Company data adjusted by S&P Global Ratings
TI and VOD 2017 figures as per S&P forecasts
10Modest Decline in Leverage Expected
Leverage trends and ratings thresholds for European telecom operators
• Since peaking in 2015 on low FOCF, currency movements and pension adjustments, leverage has declined,
creating more ratings headroom.
• We expect telco leverage will continue to decline through EBITDA growth and in same cases through positive
discretionary cash flow.
• S&P base case typically excludes M&A.
Rating
S&P Adj. Debt/EBITDA 2015 2016 2017 2018f 2019f
expectation
BT Group PLC 3.1x 3.0x 2.8x ~2.7x - 2.8x ~2.7x - 2.8xSector Hot Topics
Content
• Attracting interest as a differentiator, but less effective in Europe than the U.S.
• Economics can be challenging with sport rights inflation and OTT’s deep pockets
Regulation of M&A
• In-market consolidation faces regulatory resistance
• Regulators likely more receptive to convergent or cross-border consolidation, but
convergent M&A complicated by valuations and cross-border lacks key synergies
Regulation of Assets
• Asset unbundling to asset spins, likely negative to business profiles => loss of network
differentiation
• Credit impact could boil down to valuations and use of proceeds
5G
• Not in current forecasts, but fiber deployments will be a stepping stone
• Lot’s of potential, but compelling use cases still needed to justify investment
Private & Confidential 12How Important Is Content?
We currently give little credit to content strategies in our forecasts
• Is the difference with the US customer spending insurmountable, or an opportunity for
European telcoms?
Revenue ($) per Cable and IPTV
$1,600
$1,400
$1,200
$1,000
$800
$600
$400
$200
$0
2012Y
2013Y
2014Y
2015Y
2016Y
2017Y
2012Y
2013Y
2014Y
2015Y
2016Y
2017Y
2012Y
2013Y
2014Y
2015Y
2016Y
2017Y
2012Y
2013Y
2014Y
2015Y
2016Y
2017Y
2012Y
2013Y
2014Y
2015Y
2016Y
2017Y
2012Y
2013Y
2014Y
2015Y
2016Y
2017Y
United Kingdom Germany France Spain Italy US*
Premium Cable revenues per subscribers IPTV Revenue per subscriber
Source: SNL – Media & Communications Industry Forecast Tables.
Private & Confidential 13Financial Policy Will Be Key To Cash Flow Led De-Levering
THE STOXX EURO 800 TELECOM INDEX HAS FALLEN 27% IN LAST 3 YEARS • Shareholders may grow
impatient with equity
trading at 3-year lows
• Will telcos keep discipline
on dividends, as we expect
in our forecast?
WILL DIVIDEND INCREASES MODERATE … … AND BE FULLY FUNDED BY FOCF?
Telco Cash Dividend Growth
15%
10%
5%
0%
-5%
-10%
-15%
-20%
-25%
-30%
2013 2014 2015 2016 2017 2018 2019 2020
Note: Telcos – top 13 telecom companies; f-Forecast
Source: S&P Global Ratings
14Q&A
15Appendix
16Ratings, Outlooks
and Distributions
17European Telco Ratings and Outlook
European Telco Ratings Distribution European Telecoms Outlook Distribution
7
6 1
3
5
4 2018
3 2016
2 6
15
1
0
A A- BBB+ BBB BBB- BB+ BB BB- B+ B
Stable Positive Negative Watch Neg
• Our outlook remains "stable" (~2/3 of outlooks stable) and little rating change over the last 12 months
• Outlook as of April 23, 2018: Six Positive, Three Negative, One CreditWatch Negative
• Incumbent telco business profiles have remained resilient.
• Leverage has decreased, and should benefit from modest FOCF gains.
18European Cable Ratings and Outlook
European Cable Companies Ratings Distribution Cable Companies Outlook Distribution
8
7 1
6 1
5 Stable
2018
4
2016 Negative
3
2 Watch Pos
1
0 13
BBB- BB BB- B+ B
• Our outlook remains "stable” (~90% of outlooks stable)
• Outlook as of April 23, 2018: Mostly stable after downgrades of Altice and subsidiaries, positive bias driven by Com
Hem, Negative by VodafoneZiggo
• We expect continued, high leverage and weak Financial Profiles due to aggressive leverage and M&A policies from
parents Liberty and Altice
19BRP and FRP Top Telcos vs. Cable Operators 1Q18
Excellent
Liberty Global PLC Deutsche Telekom Swisscom AG Telenor ASA
BB-/Stable/-- (BBB+/Stable/A-2) (A/Stable/A--) (A/Stable/A-1)
Telefonica S.A. Telia (A-/Negative/A-
(BBB/Stable/A-2) 2)
Vodafone
Strong
(BBB+/Stable/A-2)
BUSINESS RISK PROFILE
Orange
(BBB+/Stable/A-2)
BT Group/EE Ltd.
(BBB+/Negative/A-2)
Unitymedia UPC Holding TDC Telekom Austria Proximus S.A.
BB-/Stable/-- BB-/Stable/-- (BBB-/Watch Neg/A-3) (BBB/Positive/A-2) (A/Stable/A-1)
VodafoneZiggo Group Virgin Media Koninklijke KPN N.V.
Satisfactory
BB-/Negative/-- BB-/Stable/-- BBB-/Positive/A-3
Altice N.V. Telenet Group Telecom Italia
B/Stable/-- BB-/Stable/-- (BB+/Positive/B)
Com Hem Hldg AB
BB/Watch Pos/---
United Group B.V. RCS & RDS
B/Stable/-- BB-/Stable/--
Fair
Tele Columbus AG
B/Stable/--
Highly Leveraged Aggressive Significant Intermediate Modest Minimal
FINANCIAL RISK PROFILE
As ofAsOct.
of April 23, 2018
11, 2016 20Rating Migration
EMEA telco ratings actions since 1Q 2016
6
5
4
3
2 Upgrade
1 Downgrade
0
1Q 2016 2Q 2016 3Q 2016 4Q 2016 1Q 2017 2Q 2017 3Q 2017 4Q 2017 1Q 2018 2Q 2018 (as
of 23-April-
2018)
Org Legal Name Rating Action Rating Prior Rating Rating Date Driver of change
SFR Group SA Downgrade B/STABLE B+/WATCH NEG 19-Apr-18 Rating action on parent
Altice International S.a.r.l. Downgrade B/STABLE B+/WATCH NEG 19-Apr-18 Rating action on parent
Altice Luxembourg SA Downgrade B/STABLE B+/WATCH NEG 19-Apr-18 Rating action on parent
High leverage and negative free cash
Downgrade B/STABLE B+/WATCH NEG 19-Apr-18
Altice N.V. flow
Matterhorn Upgrade B+/STABLE B/STABLE 29-Mar-18 Improved credit quality
Ownership increase by Deutsche
Upgrade BB/POSITIVE BB-/POSITIVE 28-Mar-18
Hellenic Telecom Telekom
Adverse developments in Italian
Outlook change BB-/NEGATIVE BB-/STABLE 23-Mar-18
Wind Tre S.p.A. wireless market
TDC A/S CreditWatch BBB-/WATCH NEG BBB-/STABLE 13-Feb-18 Possible takeover
VodafoneZiggo Group B.V. Outlook change BB-/NEGATIVE BB-/STABLE 31-Jan-18 Rising debt and dividends
Hellenic Telecom Upgrade BB-/POSITIVE B+/POSITIVE 24-Jan-18 Sovereign rating action
SFR Group SA CreditWatch B+/WATCH NEG B+/NEGATIVE 16-Jan-18 Rating action on parent
Altice International S.a.r.l. CreditWatch B+/WATCH NEG B+/NEGATIVE 16-Jan-18 Rating action on parent
Altice Luxembourg SA CreditWatch B+/WATCH NEG B+/NEGATIVE 16-Jan-18 Rating action on parent
Altice N.V. CreditWatch B+/WATCH NEG B+/NEGATIVE 16-Jan-18 Uncertain deleveraging capacity
Com Hem Sweden AB (publ) CreditWatch BB/WATCH POS BB/POSITIVE 11-Jan-18 Merger Announcement
Mobile TeleSystems CreditWatch BB/WATCH NEG BB/WATCH DEV 4-Jan-18 Rating action on parent
Mobile TeleSystems Downgrade BB/WATCH DEV BB+/WATCH NEG 12-Dec-17 Rating action on parent
Bahrain Telecommunications Company Downgrade B+/STABLE BB-/NEGATIVE 5-Dec-17 Sovereign rating action
Telkom SA SOC Ltd. Downgrade BB+/STABLE BBB-/NEGATIVE 4-Dec-17 Sovereign rating action
Last updated: April 23, 2018
21European Telco Ratings List
Company Rating/Outlook Business Risk Profile Financial Risk Profile
Telenor ASA A/Stable/A-1 Strong Modest
Swisscom AG A/Stable/- Strong Intermediate
Proximus S.A. A/Stable/A-1 Satisfactory Modest
Telia Company AB A-/Negative/A-2 Strong Intermediate
Bouygues S.A. BBB+/Positive/A-2 Satisfactory Modest
Vodafone Group PLC BBB+/Stable/A-2 Strong Intermediate
Deutsche Telekom AG BBB+/Stable/A-2 Strong Significant
Orange S.A. BBB+/Stable/A-2 Strong Intermediate
Elisa Corp. BBB+/Stable/A-2 Satisfactory Modest
BT Group PLC BBB+/Negative/A-2 Strong Intermediate
Telekom Austria AG BBB/Positive/A-2 Satisfactory Intermediate
Telefonica S.A. BBB/Stable/A-2 Strong Significant
DNA Oyj BBB/Stable/- Satisfactory Modest
Koninklijke KPN N.V. BBB-/Positive/A-3 Satisfactory Significant
TDC A/S BBB-/Watch Neg/A-3 Satisfactory Significant
Telecom Italia SpA BB+/Positive/B Satisfactory Significant
Sunrise Communications Holdings S.A. BB+/Positive/- Satisfactory Significant
Colt Group S.A. BB/Stable/- Weak Modest
TalkTalk Telecom Group PLC BB-/Stable/- Fair Aggressive
Wind Tre S.p.A. BB-/Negative/- Satisfactory Highly Leveraged
Hellenic Telecommunications Organization S.A. BB/Positive/B Vulnerable Modest
eircom Holdings (Ireland) Ltd. B+/Stable/- Fair Highly Leveraged
Ufinet Telecom Holding SLU B/Stable/- Fair Highly Leveraged
Matterhorn Telecom Holding S.A. B+/Stable/- Fair Aggressive
Largo Intermediary Holdings Ltd. (Wind Hellas) B/Stable/- Vulnerable Aggressive
*Updated as of April 23, 2018
22European and CIS Cable and Telco Ratings List
Company Rating/Outlook Business Risk Profile Financial Risk Profile
NOS, S.G.P.S., S.A. BBB-/Stable/- Satisfactory Intermediate
Com Hem Holding AB (publ) BB/Watch Pos/- Satisfactory Significant
Liberty Global PLC BB-/Stable/- Strong Highly Leveraged
UPC Holding B.V. BB-/Stable/- Satisfactory Aggressive
Virgin Media Inc. BB-/Stable/- Satisfactory Highly Leveraged
Unitymedia GmbH BB-/Stable/- Satisfactory Highly Leveraged
Telenet Group Holding N.V. BB-/Stable/- Satisfactory Aggressive
Euskaltel S.A. BB-/Stable/- Fair Aggressive
VodafoneZiggo Group B.V. BB-/Negative/- Satisfactory Highly Leveraged
SFR Group S.A. B/Stable/- Satisfactory Highly Leveraged
Altice International S.a.r.l. B/Stable/- Satisfactory Highly Leveraged
Altice N.V. B/Stable/- Satisfactory Highly Leveraged
Altice Luxembourg SA B/Stable/- Satisfactory Highly Leveraged
Tele Columbus AG B/Stable/- Fair Highly Leveraged
United Group B.V. B/Stable/- Fair Highly Leveraged
Company Rating/Outlook Business Risk Profile Financial Risk Profile
MegaFon PJSC BBB-/Stable/- Satisfactory Intermediate
Rostelecom OJSC BB+/Stable/- Fair Intermediate
Kazakhtelecom JSC BB+/Stable/- Fair Minimal
VEON Ltd. BB/Stable/- Satisfactory Significant
Mobile TeleSystems (OJSC) BB/Watch Neg/- Satisfactory Modest
Er-Telecom B/Stable/- Weak Aggressive
*Updated as of April 23, 2018
23Middle East and African Ratings
Company Rating/Outlook Business Risk Profile Financial Risk Profile
Turk Telekom BBB-/Negative/A-3 Satisfactory Intermediate
Turkcell Iletisim Hizmetleri A.S. BBB-/Negative/- Satisfactory Modest
Etisalat AA-/Stable/A-1+ Strong Minimal
Saudi Telecom Co A-/Stable/A-2 Strong Minimal
Ooredoo. A-/Negative/A-2 Satisfactory Significant
Telkom BB+/Stable/- Fair Modest
MTN Group BB+/Negative/- Satisfactory Intermediate
Telkom BB+/Stable/- Fair Modest
Batelco B+/Stable/B Fair Modest
Helios Towers Africa B/Stable/- Weak Highly Leveraged
Cell C B-/Negative/- Weak Highly Leveraged
*Updated as of April 23, 2018
24Selected Company
Snapshots
25Company Focus BT Group PLC BBB+/Negative/A-2
Key factors driving the rating Assumptions Key Metrics (based on October 2017 FA)
• Flat-to-slightly declining revenues in the financial years
• Operating performance 2018 and 2019 (ending March 31), driven by weaknesses in 2017A 2018E 2019E
• Regulatory developments wholesale and business, including public sector; and the Revenues (bil. GBP) 24.0 23-24 23-24
negative impact on Openreach from the expected
• Capex / Content investments Revenue growth (%) 26.4 (1)-(2) 0-1
reduction in fiber wholesale fees, somewhat offset by
• Pension deficit about 3%-5% growth in BT's fixed consumer revenues and EBITDA margin (%) 30.9 30-31 31.5-32.5
1%-3% growth in mobile revenues. Capex/Sales (%) 11.1 14-15 12-13
• EBITDA margins of 30%-32% (before specific items) in the
financial years 2018 and 2019. This is on the back of FFO/Debt (%) 25.7 26.27 27-29
continual cost-cutting and restructuring of Global Services FOCF/debt*(x) 12.8 3-4 10-12
as well as the benefits of cost synergies from the
Debt/EBITDA*(x) 3.0 2.9-3.1 2.8-3.0
integration of EE. We assume these will be offset by the
costs of rising sport content costs, and lower margins for *S&P Global Ratings-adjusted. a--Actual. e—Estimate
both consumer and Openreach segments after recent
investments in service and expectations of lower access
FOCF: free operating cash flow.
fees. Financial year end March 31
• Capital expenditure (capex) of about 12%-15% of sales
excluding the spectrum acquisition payments.
• Annual dividends of about £1.5 billion in financial 2018
excluding potential share buybacks, assumed to remain
steady in fiscal 2018 on the back of increasing capex and
pension outflows.
Outlook (based on August 2017 FA)
The negative outlook reflects the possibility of a one-notch downgrade over the next 12-18 months if performance or regulatory hurdles result in increased revenue and margin pressures.
Downside scenario
We could downgrade BT if we see continued weaker-than-expected operating performance, outsized investments significantly exceeding our current expectations, adverse
regulatory developments that weaken BT's margins toward 30%, or weakness in the consumer segment. We could also consider lowering the rating if BT's adjusted debt to EBITDA
rose to above 3x, or FOCF to debt dropped below 12% due to performance related issues.
Upside scenario
We could revise the outlook back to stable if BT's performance were significantly stronger than we currently envisage, with leverage declining to about 2.5x, creating meaningful
headroom for the existing uncertainties.
We may also revise the outlook if higher visibility on upcoming regulatory decisions strengthened our view regarding BT's maintenance of its strong business risk and deleveraging
prospects
Private & Confidential 26Company Focus Deutsche Telekom AG (DT) BBB+/Stable/A-2
Key factors driving the rating Assumptions Key Metrics (based on May 2017 FA)
• Revenue growth, excluding exchange-rate effects, of 2%-4% in
• Competitive landscape in US and 2017 and 2018, thanks to strong service revenue growth at TMUS,
2016A 2017E 2018E
Germany flat revenues in Germany, and improved trends in Europe mainly Revenues (bil. EUR) 72.8 74-75 76.5-77.5
from 2018, compared with 5.6% in 2016. EBITDA margin (%) 29.3 29-30.5 29-31
• M&A
• EBITDA margins for the group, as adjusted by DT, gradually
• Financial policy expanding within the 29%-31% range in the next two years, fueled Capex/Sales (%) 18.5 25-27 25-27
• Operating performance by margin expansion in the U.S. and supported by cost optimization Debt/EBITDA*(x) 3.3 3.2-3.4 3.0-3.3
efforts in Germany and Europe, after 29.3% in 2016.
FFO/dent (%) 24.4 24-26 26-28
• Capex, excluding spectrum costs, increasing to about 15%-16.5% of
revenues in 2017-2018 after 15% in 2016, linked in particular to FOCF/debt*(x) 4.8 (1)-2 8-10
fixed network upgrades in Germany and 4G network build-out in the
U.S., and capex to sales including spectrum costs of 25.5%–27.0% *S&P Global Ratings-adjusted. a--Actual. e—Estimate
in 2017. FOCF: free operating cash flow.
• Dividends moving in line with DT's measure of free cash flow, with
payouts in 2017 partly reduced by its scrip dividend offer.
Outlook (based on May 2017 FA)
The stable outlook on DT reflects S&P Global Ratings' expectations that: 1) DT will successfully defend its domestic market positions in mobile and fixed broadband, further stabilize its service revenue
trends, and trim its cost base, supporting stable or moderately growing EBITDA in Germany; 2) Strong operating trends at subsidiary T-Mobile U.S. will continue, with EBITDA growth in U.S. dollar terms
and, as adjusted by DT, of about 9%-11% in 2017 and surpassing 6% in 2018, but excluding further uplifts from handset leasing; 3) DT remains committed to maintaining leverage (debt to EBITDA) well
within its target band of 2.0x–2.5, and maintain adjusted debt to EBITDA and funds from operations (FFO) to debt of no higher than 3.5x and at least 23%, respectively, in the next two years; 4) DT will
strengthen free operating cash flow (FOCF) to debt, before spectrum payments, to more than 10% of adjusted debt in 2018, compared with about 8.4% in 2016.
Downside scenario
We could take a negative rating action if DT's adjusted debt to EBITDA exceeded or remained at 3.5x and if, at the same time, adjusted FFO to debt declined to less than 23% for more than a temporary
period, or if adjusted FOCF to debt, before spectrum payments, did not strengthen to about 10% on a sustainable basis by 2018. In particular, this could result from by stiffer-than-expected competition in
Germany or the U.S., material debt-funded acquisitions in the U. S. market, or a combination of higher-than-expected restructuring costs and large increases capital expenditures (capex).
Upside scenario
We currently do not foresee a positive rating action on DT within the next 18 months, given its high leverage for the current rating and our base-case assumption of subdued discretionary cash flow (DCF)
generation in 2017-2018. We could raise the rating if DT's credit metrics improved markedly, for example as a result of sizable asset disposals, accompanied by the implementation of a financial policy
that corresponds to the maintenance of adjusted debt to EBITDA of less than 3.0x and FFO to debt of about 30%, with FOCF to debt rising toward 15% of adjusted debt.
Private & Confidential 27Company Focus Orange S.A. BBB+/Stable/A-2
Key factors driving the rating Assumptions Key Metrics
• Operating performance in France • Revenue growth of 1%-2% in 2016, mainly contributed 2016A 2017E 2018E
and Spain by Spain. EBITDA margin (%)* 32.3 32-33 32-34
• Acquisitions • About 0.5% organic revenue growth in 2017, reflecting FFO/Debt (%)* 29.6 29-30 30-32
stable revenues in France thanks to continued Debt to EBITDA (x)* 2.7 2.7-2.8 2.6-2.7
• Financial policy
commercial success in fiber and growth in data
revenues; growth in subscribers in Spain, and low-to-
mid-single digit revenue growth in emerging markets — *S&P Global Ratings-adjusted. a--Actual. e—Estimate
somewhat offset by continued low single digit revenue FOCF: free operating cash flow.
decline in Poland and the enterprise segment.
• Reported EBITDA margins increasing to about 30% in
2017 from acquisition synergies and lower restructuring
and provisions.
Outlook
The stable outlook on Orange reflects S&P Global Ratings anticipation of improved performance for Orange in France and Spain over the next 12 months, with at least break-even
revenue and EBITDA growth for the group. We also expect the company to maintain credit metrics in line with our 'BBB+' rating, including S&P Global Ratings-adjusted debt to EBITDA
of 2.5x-3.0x, funds from operations (FFO) to debt approaching 30%, and free operating cash flows (FOCF) to debt of about 10% from 2017 onward.
Downside scenario
We could take a negative rating action if we witness a renewed price war in the domestic mobile market, which could have a meaningful negative impact on Orange's revenue and
profitability.
Additionally, although not our base case, a substantially debt-funded acquisition, with no immediate deleveraging prospects, to below 3x could lead to a downgrade.
Upside scenario
We see the potential for an upgrade as unlikely in the short term given our expectations of limited free cash flow generation as Orange continues to invest heavily in ultra-fast
broadband networks. Additionally, in our view, the rating is constrained by Orange's merger and acquisition appetite which is likely to stall potential deleveraging.
We could consider an upgrade if Orange deleverages to sustainably less than 2.5x adjusted debt to EBITDA, but at this stage we think this does not match the company's financial
policy.
Private & Confidential 28Company Focus Telecom Italia SpA BB+/Positive/--
Key factors driving the rating Assumptions Key Metrics (based on September 2017 SA)
• Execution of efficiency plans • Revenue growth of 2%-3% for the group in 2017, up from -3% in 2016A 2017E 2018E
2016, reflecting domestic revenue growth of about 2% helped by
• Regulatory developments higher mobile and fixed broadband revenues, and organic growth of
Revenues (bil EUR) 19.3 20-20.5 19.5-20
• Leverage trends 1%-3% in Brazil. Revenue growth (%) -3.3 2-3 (1)-(3)
• Group revenue decline of 2%-3% in 2018 mainly on domestic EBITDA margin (%)* 42.9 43.5-44.5 44-45
revenue declines following increased competition in fixed wholesale
as well as higher competition in wireless from the market entry of Capex/Sales (%)* 24.1 27-28 21-22
Iliad. FFO/Debt (%)* 20.3 21-22 24-25
• Adjusted EBITDA margins improving to about 45% by 2018 from
Debt to EBITDA (x)* 3.6 3.3-3.4 3.2-3.3
about 43% in 2016, thanks to the positive impact of the efficiency
plan. FOCF/Debt (%)* 4.1 1-3 5-6
• Heavy capex of 24%-25% of revenues in 2017 excluding spectrum
renewal costs, declining to about 22% in 2018 due to gradual *S&P Global Ratings-adjusted. a--Actual. e—Estimate
decline in both fixed and mobile network upgrades and more FOCF: free operating cash flow.
efficient spending.
• No dividends assumed, apart from dividends on the company's
savings shares and to TIM Participaçoes and Inwit's minorities
(totaling about €230 million in 2016).
Outlook (based on September 2017 Summary)
The positive outlook reflects the possibility of a one-notch upgrade following continued solid execution of the company's efficiencies plan, investments in upgrading its
fixed and mobile networks, and new initiatives contributing to continued improvement in margins, recurring cash flow generation, and deleveraging in 2017-2018..
Upside scenario
We could raise the rating if solid execution of the company's plan results in a reduction in adjusted leverage to comfortably less than 3.3x in 2018, and an increase in
FFO to debt to about 25% and free operating cash flow to debt to about 8%.
Downside scenario
We could revise the outlook to stable if Telecom Italia struggles to execute its plans and materially reduce its leverage by 2018. This could happen because of an
inability to extract additional meaningful cost and capital expenditure (capex) efficiencies or because the impact of competition on Telecom Italia's revenues is higher
than expected. If Telecom Italia had to pay regulatory fines significant enough to result in meaningful cash outflows or potential regulatory intervention in Telecom
Italia's investments, we could also revise the outlook to stable.
Private & Confidential 29Company Focus Telefonica S.A. BBB/Stable/A-2
Key factors driving the rating Assumptions Key Metrics (based on July 2017 RU)
• Operating performance • We forecast low-single-digit revenue growth of about 3%- 2016A 2017E 2018E
• Macroeconomic developments 4% in 2017, mainly from organic growth in Latin America Revenues (bil. EUR) 53.8 55.5-60 56-56.5
along with positive currency effects, particularly from EBITDA margin (%)* 31.9 32.0 32.0-33.0
• Competitive landscape
Brazil.
• Leverage trends • Flat growth in 2018, with Spain and the U.K. posting stable
Capex/Sales (%)* 17.1 16-17 15-16
performance, Brazil increasing on an organic basis, but FFO/Debt (%)* 22.5 24-25 26-27
somewhat offset by revenue decline in Germany and some Debt to EBITDA (x)* 3.7 3.2-3.4 3.0-3.3
negative currency impacts. FOCF/debt (%)* 8.6 10-11 12-14
• Adjusted EBITDA margins slightly improving to about 32%-
33% as cost optimization, notably in Spain and Germany, *S&P Global Ratings-adjusted. a--Actual. e—Estimate
is more than offset by high inflation in Latin America. FOCF: free operating cash flow.
• Cash outflows from short-term asset sales, including the
partial disposal of its new infrastructure subsidiary, Telxius
in 2017.
Outlook (based on July 2017 RU)
The stable outlook reflects our anticipation that all of Telefónica S.A.'s key assets will post stable operating performance in their local currency. We also expect that
some positive currency effects and Telefónica's commitment to debt reduction will support a decline in leverage toward 3x over the next couple of years.
Downside scenario
We could lower the rating by one notch if operating performance in key assets, including Spain, Germany, the U.K., and Brazil, is weaker than our base-case
expectations, for example as a result of a lower demand on the back of a macroeconomic drop or increased competition.
Additionally, we could lower the rating if Telefónica does not actively seek to reduce its debt levels so that, after our adjustments, it declines toward 3x over the next
few years.
Upside scenario
We currently see an upgrade in the short as remote due to the relatively significant debt burden and leverage. We could consider an upgrade if Telefónica reduced
adjusted leverage to comfortably within the 2.5x-3x range and we considered this sustainable over the long term, under its financial policies and given its earnings
prospects.
Private & Confidential 30Company Focus Vodafone Group PLC BBB+/Stable/A-2
Key factors driving the rating Assumptions Key Metrics (based on September 2017 FA)
• Operating performance • We expect the company's revenue to decline by about 2%-3% in
FY2018, mainly due to the deconsolidation of its business in The 2017A 2018E 2019E
• CAPEX and dividend policy Netherlands after the joint venture with Liberty Global. Revenues (bil. EUR)* 47.6 46.0-46.5 46.5-47.5
• M&A • We forecast adjusted EBITDA margins to rise to about 37% and
EBITDA margin (%)* 34.1 37-37.5 37.5-38.5
• Liquidity position 38% over the next two years on the back of cost cutting initiatives
the group has focused on, along with the zero-based budgeting FFO to Debt (%)* 30.6 33-34 35-37
initiatives undertaken as part of the "fit-for-growth" initiative. Capital Intensity (%) 15.7 19-20 17-18
• We expect capex will drop to around 15%-16% of revenues, Debt to EBITDA (x)* 2.8 2.5-2.6 2.4-2.5
excluding spectrum costs, with the majority going toward
FOCF/Debt (%) 12.1 11.5-12 17-18
maintaining its market position and the rest focused on improving
its fixed offerings and its product transformation (fit-for-growth)
*S&P Global Ratings-adjusted. a--Actual. e—Estimate
initiative.
• No significant acquisition capex in the near term following the FOCF: free operating cash flow.
divestment of the Indian operations via a joint venture with Idea Financial year end March 31
Cellular.
• A year-on-year 2% increase in the dividend paid as per the
company plans.
Outlook (based on September 2017 FA)
S&P Global Ratings' stable outlook on global telecommunications company Vodafone Group PLC reflects our expectation that average adjusted debt to EBITDA will remain below 3.0x and
funds from operations (FFO) to debt above 30% on a sustainable basis, supported by low-single-digit organic growth and EBITDA margins breaking 30%. We expect another year of negative
discretionary cash flow because of high capex in fiscal 2018 when including spectrum outlay and high dividends. In addition, we expect Vodafone to pursue any strategic initiative related to
acquisitions or disposals within the boundaries of our current financial risk profile assessment.
Downside scenario: We could lower our ratings on Vodafone if we anticipated that its adjusted debt to EBITDA would exceed 3.0x and FFO to debt would fall below 30% on a prolonged
basis. This could occur if Vodafone returned to organic European revenue declines, or a sharp slowdown in AMAP growth outpaced modest European growth combined with additional
leverage from acquisitions, or if increased capex or shareholder returns led to prolonged negative discretionary cash flow beyond fiscal 2018. A rapid push to convergence by other players in
the U.K. and Italy could increase competitive pressure and also lead us to reconsider our view of Vodafone's business risk profile. We could also lower the ratings if Vodafone's liquidity position
deteriorated due to a lack of proactive refinancing.
Upside scenario: We see limited potential for an upgrade over the next two years, but could consider raising the rating if we expected Vodafone to sustainably maintain S&P Global Ratings-
adjusted debt to EBITDA at significantly less than 2.5x and FFO to debt above 35%. This could occur if Vodafone were able to raise adjusted EBITDA margins toward 35% and achieve positive
organic revenue growth, while maintaining a conservative approach to leverage and shareholder returns. An upgrade would also likely require a strengthened business profile as a fixed-mobile
converged provider in Europe, for example, by demonstrating a track record of market-leading quadruple-play growth.
Private & Confidential 31Network coverage
statistics
32European Telcos Still Behind the US in Mobile and
Fixed, but Making Fiber Progress
Households With Access 2011 2012 2013 2014 2015 2016
LTE Population Coverage
EU27 8% 27% 59% 79% 86% 90%
US 67% 90% 98% 98% 99% 98%
High Speed Fixed BB Coverage
EU27 (>30Mbps) 48% 54% 62% 68% 71% 76%
US (>25Mbps) 72% 80% 83% 90% 90% >90%
Fiber To The Premises
EU27 10% 12% 14% 19% 21% 24%
Source: FCC, European Commission
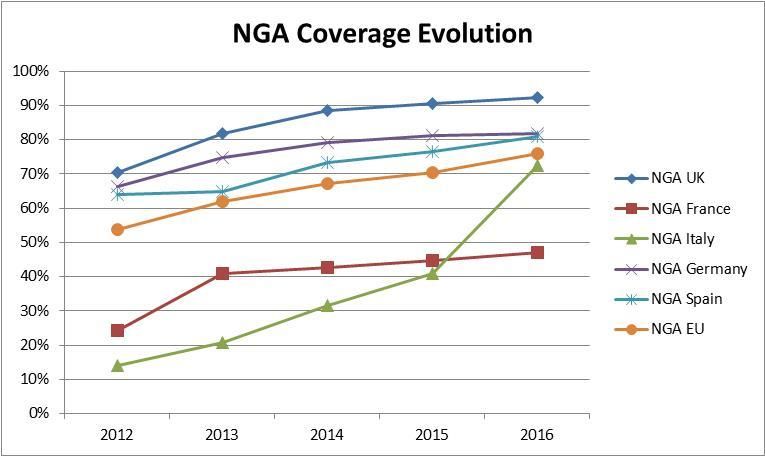
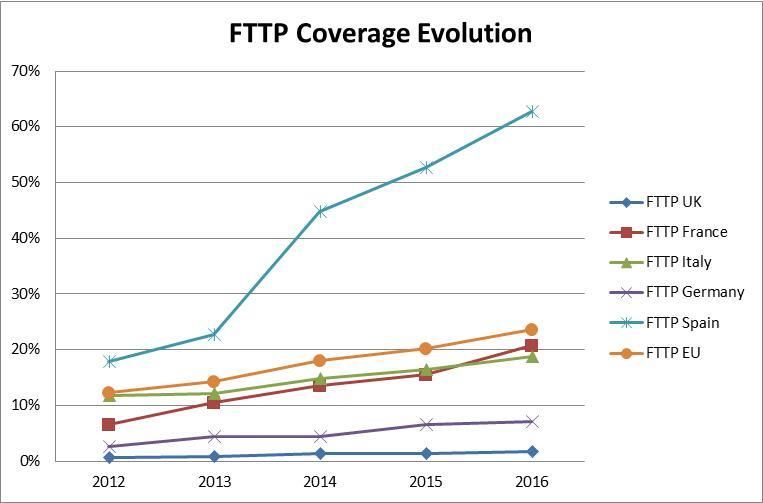
33Infrastructure Progress to Drive Capex Variation Across Europe
UK AND GERMANY’S NGA ADVANTAGE SOUTHERN EUROPE’S FIBER LEAP FROG
Source: S&P Global Ratings, European Commission Source: S&P Global Ratings, European Commission
• Mobile capex winding down, but shift to fixed upgrades keep our forecast levels at 17%-
18% of revenue
• Smaller markets and Southern Europe lead on fiber rollouts, improving competitive
positions and future cash flow prospects
• Technology upgrades to non-fiber NGA sufficient in Germany and UK, but for how long?
34Private & Confidential
Copyright © 2018 by Standard & Poor’s Financial Services LLC. All rights reserved.
No content (including ratings, credit-related analyses and data, valuations, model, software or other application or output therefrom) or any part thereof (Content) may be modified, reverse
engineered, reproduced or distributed in any form by any means, or stored in a database or retrieval system, without the prior written permission of Standard & Poor’s Financial Services LLC or
its affiliates (collectively, S&P). The Content shall not be used for any unlawful or unauthorized purposes. S&P and any third-party providers, as well as their directors, officers, shareholders,
employees or agents (collectively S&P Parties) do not guarantee the accuracy, completeness, timeliness or availability of the Content. S&P Parties are not responsible for any errors or
omissions (negligent or otherwise), regardless of the cause, for the results obtained from the use of the Content, or for the security or maintenance of any data input by the user. The Content is
provided on an “as is” basis. S&P PARTIES DISCLAIM ANY AND ALL EXPRESS OR IMPLIED WARRANTIES, INCLUDING, BUT NOT LIMITED TO, ANY WARRANTIES OF
MERCHANTABILITY OR FITNESS FOR A PARTICULAR PURPOSE OR USE, FREEDOM FROM BUGS, SOFTWARE ERRORS OR DEFECTS, THAT THE CONTENT’S FUNCTIONING WILL
BE UNINTERRUPTED OR THAT THE CONTENT WILL OPERATE WITH ANY SOFTWARE OR HARDWARE CONFIGURATION. In no event shall S&P Parties be liable to any party for any
direct, indirect, incidental, exemplary, compensatory, punitive, special or consequential damages, costs, expenses, legal fees, or losses (including, without limitation, lost income or lost profits
and opportunity costs or losses caused by negligence) in connection with any use of the Content even if advised of the possibility of such damages.
Credit-related and other analyses, including ratings, and statements in the Content are statements of opinion as of the date they are expressed and not statements of fact. S&P’s opinions,
analyses and rating acknowledgment decisions (described below) are not recommendations to purchase, hold, or sell any securities or to make any investment decisions, and do not address the
suitability of any security. S&P assumes no obligation to update the Content following publication in any form or format. The Content should not be relied on and is not a substitute for the skill,
judgment and experience of the user, its management, employees, advisors and/or clients when making investment and other business decisions. S&P does not act as a fiduciary or an
investment advisor except where registered as such. While S&P has obtained information from sources it believes to be reliable, S&P does not perform an audit and undertakes no duty of due
diligence or independent verification of any information it receives.
To the extent that regulatory authorities allow a rating agency to acknowledge in one jurisdiction a rating issued in another jurisdiction for certain regulatory purposes, S&P reserves the right to
assign, withdraw or suspend such acknowledgement at any time and in its sole discretion. S&P Parties disclaim any duty whatsoever arising out of the assignment, withdrawal or suspension of
an acknowledgment as well as any liability for any damage alleged to have been suffered on account thereof.
S&P keeps certain activities of its business units separate from each other in order to preserve the independence and objectivity of their respective activities. As a result, certain business units of
S&P may have information that is not available to other S&P business units. S&P has established policies and procedures to maintain the confidentiality of certain non-public information received
in connection with each analytical process.
S&P may receive compensation for its ratings and certain analyses, normally from issuers or underwriters of securities or from obligors. S&P reserves the right to disseminate its opinions and
analyses. S&P's public ratings and analyses are made available on its Web sites, www.standardandpoors.com (free of charge), and www.ratingsdirect.com and www.globalcreditportal.com
(subscription), and may be distributed through other means, including via S&P publications and third-party redistributors. Additional information about our ratings fees is available at
www.standardandpoors.com/usratingsfees.
Australia
Standard & Poor's (Australia) Pty. Ltd. holds Australian financial services license number 337565 under the Corporations Act 2001. Standard & Poor’s credit ratings and related research are not
intended for and must not be distributed to any person in Australia other than a wholesale client (as defined in Chapter 7 of the Corporations Act).
STANDARD & POOR’S, S&P and RATINGSDIRECT are registered trademarks of Standard & Poor’s Financial Services LLC.
35You can also read