South Africa economic review and outlook - Q1 2019 Annabel Bishop Tel: (2711) 286 7188 ...
←
→
Page content transcription
If your browser does not render page correctly, please read the page content below
South Africa economic review and outlook
Q1 2019
Annabel Bishop
Tel: (2711) 286 7188
annabel.bishop@investec.co.za
http://www.investec.co.za/research-and-insights/economy/economic-research-v1.html
Time line for SA to mid-year:
                                          •    7th February SONA

                                      •       20th February Budget

                              •           28th March MPC meeting

                        •   29th March Moody’s Country Rating

           •   March Nersa announces multi-year electricity tariff increases

                                  •           23rd May MPC meeting

           •   May 2019 General Election (date to be announced in SONA)

                    •   24th May Standard & Poor’s Country Rating

                    •   Fitch Country Rating (date is not published)

                            FOMC 2019 meeting dates:
    •   20th March, 1st May, 19th June, 31st July, 18th September, 30th October, 11th
2                                        December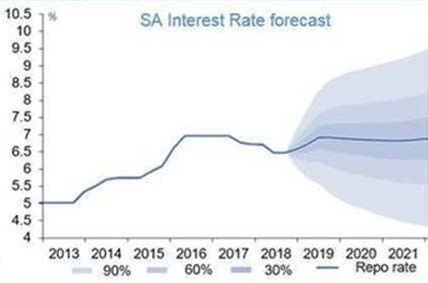
South Africa
     economy

3
Weak economic growth persists
         •   SA’s economic growth is weak, down from 3.0% y/y to around 0.5% y/y over this decade.

         •   Fixed investment growth has weakened.

         •   Fiscal stimulus has yielded little longer-term, government finances are now constrained.

         •   The formal unemployment rate is close to 30%, versus the 21.3% reached towards the
             end of the last decade.

         •   The economy remains income driven, with production centered in the services sector.

    South Africa sees downward growth trend in the 2010-20 decade to date
         %
    5

    3

    1

    -1

    -3

    -5
      1994     1996    1998   2000   2002    2004   2006      2008     2010   2012   2014   2016   2018
4                     GDP growth               Global financial crises                Employment
                                                                               Source: SARB, Bloomberg
Income produced by households is mostly spent
Downward growth trend in household incomes, consumption and expenditure
% %
9
7 20
5
3 10
1
-1 0
-3
-5 -10
2002 2004 2006 2008 2010 2012 2014 2016 2018
Household consumption growth Downwards phase in business cycle
Real disposable income growth Growth in household debt %
Source: SARB
• Household consumption runs close to 60% of GDP, with savings under 2% of GDP.
• Tight lending conditions, compared to the 2000s keeps growth in household debt
constrained around 0.6% y/y, while unemployment has risen to near 28% from 21%.
• Despite lower growth in debt, as a % of disposable income it is still relatively high at
71.3%, versus closer to 50% in early 2000s, and its peak of 87.8% in 2008.
• Household savings are at low levels, with pension savings used to deleverage.
5 • Government spending is high, even in real terms, requiring households to pay higher
taxes, causing firms to save more and invest less.Government finances have deteriorated
• Government current expenditure (which excludes infrastructure but includes civil servants’
salaries and wages) has risen to 30% of GDP, from closer to 20% in the 2000s.
• The public sector borrowing requirement has risen from close to 0% of GDP in the 2000s
to 3.5% of GDP, the fastest growth item in the budget.
• Public sector revenue climbed to 26% of GDP, from 22% of GDP in 2001, meaning that
revenue and the economy have indeed grown, but not at the pace of expenditure.
• Dissaving and overspending (as expenditure continues to exceed revenue) has been
funded to a substantial degree by the rapid ramp up in debt.
Government debt is rising – even after cash balances offset
60 300
%/GDP R’bn (deficit +, surplus -)
50 250
200
40
150
30
100
20
50
10 0
0 -50
1993/94 1998/99 2003/04 2008/09 2013/14 2018/19
Net Debt/GDP (LHS) Net Debt/GDP national treasury projections (LHS)
Revenue % GDP (LHS) Expenditure % GDP (LHS)
Expenditure % GDP projections (LHS) Main budget deficit (RHS)
6 Main budget deficit projections (RHS)
Source: National treasury main budget figuresSentiment is expected to improve materially post
General Election
Business confidence, political climate have a close relationship with jobs, investment and growth
9 % 100
Index
7 80
5
60
3
40
1
-1 20
-3 0
1980 1988 1996 2004 2012
Fixed capital stock growth (LHS) GDP growth (LHS)
Employment (LHS) BCI (RHS)
Political climate (RHS)
Source: SARB, Investec, BER
• With South Africa’s economic growth in decline since 2010, many voters voted for change in
the 2016 municipal election.
• The 2016 municipal elections indicated a possible sea change for the next national elections
(2019 general election - GE), where the current ruling alliance could lose its majority.
• SA has seen Ramaphosa replace Zuma as President of both the ANC and SA. Recent polls
now show the ANC gaining, with a majority more likely at the general election.
7 • Politics will likely become noisier and uncertainty rise in the lead up to the 2019 election,
risking heightened financial market volatility and stagnant economic growth.Corporates are not essentially saving more
• Government spending is high and it is a dissaver, requiring the private sector to pay higher
taxes, causing firms to save more and invest less.
• The Reserve Bank says “this is sometimes interpreted as an investment strike by
business, but it is … better understood as ‘crowding out’.”
• Corporate savings in the banking system are lent out, including to government, other
corporates and households as part of the banking sector’s normal lending operations.
• Domestically, mainly corporate savings have been borrowed by the government sector to
finance its debt (household savings are too low to account for the majority).
• Foreign investors fund only about 40% of SA government debt, household savings sit at
close to 0% of GDP.
Adjusting for inflation, and depreciation costs, corporates are not essentially saving much more
250,000 R’m % GDP
5
150,000 3
1
50,000
-1
-3
-50,000
-5
-150,000 -7
1995 2000 2005 2010 2015 1995 1999 2003 2007 2011 2015
Non-financial corporates net savings -real terms
Non financial corporates net savings -nominal terms
Government net savings -real terms Non-financial corporate sector
8 Government net savings -nominal terms Government
Source: SARB, National TreasuryTrade account shifts to surplus on weaker imports
Current account deficit consists mainly of coupon and dividend payments to foreigners
4 % GDP
2
0
-2
-4
-6
-8
2005 2007 2009 2011 2013 2015 2017
Current account Trade account Income and services account BLNS
Source: SARB
• SA’s trade account switched to surplus as import growth weakened materially on weak domestic
demand, and to a greater degree than the slowing in export growth.
• Domestic demand for imports recently weakened by more than global demand for SA’s exports.
• Foreign purchase of SA bonds, attracted by SA’s comparatively high yields, assist in financing
the current account deficit, as do foreign net purchase of equities in risk-on periods.
• Foreign net sales of SA bonds typically lift yields (borrowing costs), adding to the debt burden.
SA government borrowing of foreign funds adds to the rand’s vulnerability.
9 • Transfers to BLNS countries (Botswana, Lesotho, Namibia, Swaziland) are currently R30bn a
quarter.Rand is driven by global and domestic risk factors
Rand tracks US 10 year Treasury, foreign net purchases/sales of SA equities and bonds
16 R/USD % 0 R/USD 0
20 %
2
11 10
0
4
6 20
6 -20
1
8 -40 30
1994 2000 2007 2014 2010 2012 2014 2016 2018
-4 10 Equities net flows (LHS)
USDZAR (LHS) Gilts net flows (LHS)
USGB10 (RHS) Rand/USD (RHS)
Source: Iress
• The rand is an emerging market (EM) currency, and has strengthened materially on market
expectations that the US will no longer hike interest rates this year.
• Foreigners are active in SA’s bond and equity markets, with net sales/purchases driving the
rand, along with coupon and dividend payments, commodity prices and the carry trade.
• SA maintains a significant differential between its interest rates and those of global markets,
with expectations on economic growth and corporate earnings also influencing investment.
• A trade surplus supports the rand, but has a minimal impact in the face of financial flows. SA
10 sees significant foreign borrowings to supplement its domestic savings rate.
• In SA key political and governance developments also impact the domestic currency.SOEs finances represent key major risk to SA
• Eskom debt has increased from R59bn to R440bn over the past ten years. Eskom has
utilised over 95% of its government guarantees, limiting further funding.
• Eskom is currently graded as junk (below sub investment grade) by the three key rating
agencies, reflecting a 50% chance of Eskom defaulting on its debt in the medium term.
• The spread between Eskom and government bond yields reflect increased risk of lending
to Eskom. Lenders require a high risk return to advance credit to Eskom.
• Eskom has high debt repayments, while borrowing is a key funding source.
• To avoid default, Eskom could be restructured (divided into three companies), privatized,
the state could intervene financially, staff costs reduced drastically and/or significant
electricity tariff increases occur – all of which are unpalatable to at least one sector.
Eskom’s escalation in gross debt sees utilisation of government guarantees reaching its limit
Eskom’s gross debt R’bn Eskom’s utilisation of government debt Dec’18
700
R bn 400 337
600 350
350
500 300
255
400 250
200
300
150
200 82
100
100 50 13
0 0
FY 2000
FY 2001
FY 2002
FY 2003
FY 2004
FY 2005
FY 2006
FY 2007
FY 2008
FY 2009
FY 2010
FY 2011
FY 2012
FY 2013
FY 2014
FY 2015
FY 2016
FY 2017
FY 2018
FY 2019
FY 2020
FY 2021
FY 2022
Total Commited Commited not Available
Government drawn down drawndown
Guarantee
11
Source: National treasury, EskomInflation largely runs within the 3-6% target band
• SA’s CPI inflation has seen a recent sharp descent, but will rise over this year and next, to
return to its structural rate of 5.5% y/y 2018 recorded 4.6% y/y, 2019 around 4.5% y/y likely.
• SA is increasingly experiencing drought conditions this year, which will counteract some of
the impact of rand strength, particularly due to the high weight of food prices in CPI.
• SA’s inflation is driven mainly by state administered prices, with Eskom applying for around
17% increase in tariffs for this year and around 15% for the next two years.
• Retail inflation continues to run well below CPI inflation as retailers face margin squeeze in
a low growth economy, with sales driven mainly by volumes and discounts key.
CPI inflation expectations rise in the period the SARB is currently targeting for monetary policy
8 % % 12
6
7
4
2
2
0 -3
2010 2011 2012 2013 2014 2015 2016 2017 2018 2019 2020 2021 2022
Actual Investec CPI forecast
January MPC CPI forecast Midpoint of inflation target
Lower limit of inflation target Upper limit of inflation target
Retail inflation Retail inflation forecast (Investec)
12 Food and non-alcoholic beverages Food and non-alcoholic beverages forecast
Source: SARB, Statistics SA, InvestecMarkets expect flat 2019 SA and US interest rates
• South Africa has prudent monetary policy and SA’s Central (Reserve) Bank policies are to
remain independent, as per both government and the ruling party policies.
• South Africa’s Reserve Bank (SARB) does not intervene in currency markets in order to
influence the level of the rand. The rand floats freely.
• The SARB estimates that the neutral interest rate (neither promotes/accommodates nor
weakens/restricts economic growth) is about 2.0% y/y above the CPI inflation rate.
• However, the SARB mainly targets CPI inflation 12 to 18 months out, currently in 2020, where
it anticipates CPI inflation will average 5.3% y/y, too close to 6.0% y/y for a cut in the repo rate.
• Consequently the SARB believes monetary policy is currently accommodative.
SA maintains a significant differential above key advanced economies interest rates
15 %
10
5
0
2000 2004 2008 2012 2016
UK Japan SA EU US
13 Source: Iress, SARBMacro economic forecasts 14
Risks and
     opportunities

15
Eskom risk hangs over economy and credit rating
• SA government has previously said it will not extend further guarantees to Eskom but the yields
on stand alone Eskom borrowing are high.
• Eskom has recently applied for a 17.1% tariff hike this year and 15.4% and 15.5% respectively
over the next two years, over and above the 4.4% increase already awarded by Nersa.
• It is unlikely Nersa will approve this, and the mining sector has signalled resultant job losses
likely on such substantial tariff hikes.
• New board appointed in January 2018 to improve governance, December 2018 high level
sustainability task team appointed, recommendations due end January 2019.
• Previous suggestions: Eskom to be devolved into three companies (transmission, generation,
control of grid) where transmission and generation (sale of power stations) is privatized,
encourage private generation for sale on national grid (incl. homes), tech – renewables, storage
(incl. private off grid households). Need to reduce threat to security of supply for economy.
Eskom’s cash from operations, maturities of debt
R'bn Cash from operations, boosted in 2016 R'bn Nominal maturities of guaranteed
50 and 2017 from RCA’s 30 27
debt
25
20
20
0
15 12
10
6
-50 5
FY2013 FY2014 FY2015 FY2016 FY2017 FY2018
Cash from operations (CFO) 0
CFO after interest repayments
16 2019 2020 2021 2022
CFO after debt repayments
Source: National treasury, EskomSA has vast competitive potential in renewables
• SA is land, wind and solar resources rich, representing substantial investment opportunities for
renewable energy, and related renewable energy-intensive industries.
• Indeed, the world is increasingly moving in the direction of renewable energy generated
electricity, particularly wind and solar, which make up a very small % for SA currently.
• South Africa’s IRP (Integrated Resource Plan) details the increasing mix needed for
renewables, particularly given their relatively more labour-intensive nature.
• The move towards clean energy globally means funding for coal fired power stations is more
difficult to obtain.
• As technology advances at an increasingly rapid rate, the infrastructure costs of renewable
energy generation decline, making it increasingly affordable, particularly for new builds.
• Additionally, technological advances also increase/ensure security of supply from a mix.
Renewable Energy
Total electricity generated by source, New renewable energy vs new coal
Solar, 0.9% 7000 MW
powered energy
6,370
Wind, 0.9% Diesel, 1.7%
6000
Other, 2.4% Natural gas,
4,966
3.2% 5000
Nuclear,
5.2% 4000
3000 2,388 2,388
237 006 2000
1,830
1,594
gigawatt- 1,048 1,217
871
hours 1000
Coal, 85.7% 0
2017 2018 2019 2020 Total
17 New renewable energy
Medupi and Kusile power stations
Source: Stats SA, EskomMoody’s likely to drop outlook to negative this year
• The 2018 MTBPS was not an austerity budget, and this is likely to persist, particularly in an
election year.
• However, absent cutting expenditure, pressure on government finances will grow in a weak
economic growth environment, edging SA closer to a downgrade from Moody’s.
• Globally, evidence is generally difficult to detach from other events, and so causality
(whether the economic slowdown occurs because of the credit rating downgrade, or whether
the credit rating downgrade causes the economic slowdown) is mixed.
• Credit rating downgrades tend to promote economic weakness generally, as they negatively
affect confidence, particularly corporate and consumer expenditure decisions to take on
debt. Consolidation of government finances instead would boost business confidence.
Local currency long-term sovereign debt credit ratings vs. government debt as % GDP
B+
70 Ratings 0
BB-
%/GDP
60 BB
BB+
50
BBB-
40
BBB
30
BBB+
20 A
10 A+
AA-
0 10
1993/94 1998/99 2003/04 2008/09 2013/14 2018/19
Net Debt/GDP (LHS) Net Debt/GDP national treasury projections (LHS)
Moody's local Fitch Local
S&P local Moody's foreign
18 Fitch foreign S&P foreign
Source: Credit rating agencies, National treasury, BloombergWeak institutions lower competitiveness, growth
• The World Economic Forum’s (WEF) latest Global Competitiveness Survey shows South
Africa’s institutional ranking dropped to sixty seventh, from thirty ninth in 2007/08.
• The deterioration in the health of government and key SOE finances has depressed business
confidence. Credit ratings average sub-investment grade from the three key agencies.
• Real household income growth and the efficacy of corporate boards also deteriorated over the
past several years, and corruption has proliferated.
• President Ramaphosa is committed to fiscal consolidation, faster, inclusive growth, and the
repair of SOE finances (without further drain on government’s balance sheet).
• It is expected to take a number of years to repair competitiveness, including substantial repair
in the governance of key SOEs and state institutions, as well as of their finances, and those of
general government. Additionally, eliminating corruption is also necessary to restore investor
confidence. A quicker resolution would dramatically boost sentiment, and so growth.
SA’s ranking out of 140 countries: best 1, worst 140
Trade tariffs Future orientation of government
Banks' regulatory capital ratio Active Labour policies
Imports % of GDP Inflation
Pay and productivity Pupil-to-teacher ratio in primary…
Distortive effect of taxes and… Terrorism incidence
Coomplexity of tariffs Hiring and firing practices
Reliability of water service
Digital skills among population
Prevalence of non-tariff barriers
Reliability of police services
Exposure to unsafe drinking water
Healthy life expectancy
Property rights
Quality of vocational training Organised crime
Fixed broadband Internet… Time to start a business (days)
Ease of hiring foreign labour Flexibility of wage determination
Electrification rate Homicide rate
Co-operation in Labour-…
19 0 20 40 60 80 100 120 140
0 20 40 60 80 100 120 140
Source: The World Economic Forum (WEF) Global Competitiveness survey, October 2018SA key strengths will help drive growth
SA’s ranking out of 140 countries: best 1, worst 140
Market capitalization (% of GDP) State of cluster development
Insurance premium (% of GDP) Scientific publications
Cost of starting a business Willingness to delegate authority
Road connectivity index Efficiency of air transport services
Mobile-cellular telephone… Market size
Domestic credit to private… Social capital
Conflict of interest regulation Multi-stakeholder collaboration
Labour tax rate Attitdes toward entrepreneurial…
Financial system E-Participation Index
Internal Labour mobility Quality of research institutions
Insolvency regulatory framework Companies embracing…
Workers' right Airport connectivity
Credit gap Efficiency of legal framework in…
Freedom of the press Diversity of workforce
Budget transparency Liner Shipping Connectivity Index
0 5 10 15 20 25 30 0 10 20 30 40 50
Source: The World Economic Forum (WEF) Global Competitiveness survey, October 2018
• SA has a strong, capable world class private business sector, with well managed equity
exchanges and strong foreign interest in SA listed equities. It has incubated a large number of
companies to large scale, international level, and is part of global automotive supply chain.
• SA is a mineral rich, endowed country, with likely substantial gas and oil reserves. It has
world-class private sector education and healthcare. There is a significant tourism opportunity
for employment, particularly as SA is a youthful population.
• SA has prudent monetary (independent) policy, an independent judiciary, and a well regulated
20 financial services sector.SA achieved A grade ratings before, and can again
• The previous upwards credit rating trajectory occurred in the 2000s, driven by strong
economic growth, fiscal consolidation and good governance of SOEs and government.
• Through improved fiscal management in the second half of the 1990s, money was available
to spend on infrastructure, other growth enhancing reforms and social welfare in 2000s.
• Good governance typically yielding quality infrastructure delivered on time, within budget
and which supported private corporate sector expansion.
• Fixed investment growth accelerated to double digits over this period, propelling economic
growth to above 3.0% y/y, then onwards to above 5.0% y/y and unemployment to below
22%.
• Strong economic growth, strong institutional environment, fiscal consolidation (fiscal
surplus, low borrowings) engendered credit rating upgrades.
South Africa saw an upward growth trend in the 2000s (before the global financial crisis)
Index 100
%
5
80
3
60
1
40
-1 20
-3 0
1990 1998 2006 2014
21 Fixed investment GDP growth Employment BCI (RHS)
Source: SARB, BERLand reform is ongoing but lack of clarity on EWC
• EWC (Expropriation without Compensation) while adopted in principal by parliament, is still in
process of being defined, with an advisory land reform panel to inform policy making.
• Government has been leaning towards current occupiers’ formal ownership of land, and
allocation of land to the previously marginalised (with title deeds), versus nationalization.
• While the former has a significant administrative requirement, it also has the potential to
release capital, assisting individuals in small business growth, education and skills
development and capital investment.
• A strengthening of property rights has been shown to strengthen economic growth, with many
in tribal areas testifying to seek ownership of the land they occupy.
• Principally, the aim is to redress historical inequality, and so to provide land ownership for the
previously marginalized. Urban migration shows reduced desire to farm. SA has low arability.
Land and agriculture in SA
SA’s agricultural trade balance
Breakdown of SA’s land
12000000 US$ (‘000)
Owned by
10000000 Land the state,
owned by 14.0%
8000000 individuals,
31.2% Other ,
6000000 9.0%
4000000
2000000
0 Land
owned by Land
-2000000 companies owned by
or CBOs, trusts,
22 Exports Imports Trade Balance 21.9% 23.9%
Source: Department of rural development and land reform, Agbiz,Mining sector dependent on policies, costs, prices
• Over most of the decade, mining in SA has been increasingly beset by high and rising costs,
diminishing ore grades in many instances and perceived restrictive government legislation.
• Regulatory and policy uncertainty was perceived to have disincentivised much of the impetus for
new fixed investment, with construction of mines generally falling.
• SA currently seeks to restore investment and exploration levels through the revised mining
charter, scrapping the minerals and resources petroleum bill.
• Relatively high oil/gas production is now an increasing likelihood for SA, with exploration
yielding likely significant potential, which would be bolstered by supportive legislation.
• Government needs to offer mines significant regulatory and tax relief, particularly for new mines
and exploration, in order to provide support to the sector, and so to jobs in the sector.
• The most recent iteration of the mining charter is seen as a good departure point for further
negotiations. SA is a net commodity exporter, commodities are a substantial part of exports.
Mining in South Africa
Change in turnover 2016/17, by sub-group (Rbn) Income and spending in the SA mining and
700 R’bn quarrying industry
Mining of metal ores 38.8 600
500
Mining of coal and lignite 17.9
400
Mining of gold and uranium ore 14.9
300
Other mining 4.7
200
Total income Total expenditure
Activities incidental to mining 0.3 100
Extraction of crude petroleum 0
-5.9
23 and gas 2001 2005 2009 2013 2017**
Source: Stats SAMajor tourism opportunities, a youthful population
Tourism in South Africa
Concentration of tourism-related jobs 4.5% of South Africa’s workforce were employed
% breakdown in the tourism sector
722 013 individuals
16.2
million
workers
(2017)
Source: Stats SA
• The tourism industry is labour intensive, and South Africa has a high youth unemployment rate,
of around 50%, and a high formal unemployment rate of close to 30% (informal close to 40%).
• SA’s tourism policy includes changes to SA’s visa regime, including highly skilled individuals.
Job creation in tourism has been resilient to SA’s weak economy, a key generator of new jobs.
• South Africa sees a rising number of foreign visitor arrivals per annum, despite expensive long-
haul flights for overseas visitors, with rand depreciation over the years lowering costs for many.
• However, the majority of tourism in SA is from visitors from African countries, or South Africans.
• South Africa’s southern hemispheres summer and attractive destinations contrast well with
northern hemisphere winters, particularly SA’s international standard of many resorts/hotels.
24 • Job creation in tourism accelerated in SA, from 2014 to 2017 tourism created 64 000 jobs,
exceeding the performance of the industrial sector, and that of transport and communication.Looking ahead in H1 2019
• 7th February SONA – The President is likely to unpack some of the measures to support
Eskom and security of electricity supply. The SONA will also include government policy
objectives and reforms, directed at employment, growth and social support.
• 20th February Budget – is unlikely to see marked departure from the 2018 MTBPS, but a
further hike in the top marginal tax rate is a possibility, with fleshed out detail likely for
SOE financial support, and some switching in expenditure priority, but no drop in debt
forecasts.
• 28th March MPC – no change to repo rate as 2020 inflation expected around 5.5% y/y.
• 29th March Moody’s Country Rating – SA is likely to see its outlook on its Moody’s dual
long-term (local and foreign currency) credit rating drop from stable to negative this year.
• March Nersa announces multi-year electricity tariff increases – Eskom’s additional
request for a 17.1% tariff hike this year and 15.4% and 15.5% respectively over the next
two years, is unlikely to be approved, with an increase of below 10% likely instead.
• 23rd May MPC – no change to repo rate as 2020 inflation expected around 5.5% y/y.
• May 2019 General Election (date to be announced in SONA) – ANC Ramaphosa majority
win expected, with low voter support for extreme left wing political parties.
• 24th May Standard & Poor’s Country Rating – no downgrade expected.
• Fitch Country Rating (date is not published) – no downgrade expected.
25Disclaimer
The information and materials presented in this report (which includes presentations) are provided to you for
information purposes only and are not to be considered as an offer or solicitation of an offer to sell, buy or subscribe
to any financial instruments. This report may not be reproduced in whole or in part or otherwise, without the consent
of Investec.
The information and opinions expressed in this report have been compiled from sources believed to be reliable, but
neither Investec, nor any of its directors, officers, or employees accepts liability for any loss arising from the use
hereof or makes any representation as to its accuracy and completeness.
Investec, and any company or individual connected to it including its directors and employees may to the extent
permitted by law, have a position or interest in any investment or service recommended in this report. Investec may,
to the extent permitted by law, act upon or use the information or opinions presented herein, or research or analysis
on which they are based before the material is published.
Past performance should not be taken as an indication or guarantee of future performance, and no representation or
warranty, express or implied is made regarding future performance. Information, opinions and estimates contained in
this report reflect a judgement at its original date of publication by Investec and are subject to change.
Investec is not agreeing to nor required to update research commentary and data. Therefore, information may not
reflect events occurring after the date of publication. The value of any securities or financial instruments mentioned in
this report can fall as well as rise. Foreign currency denominated securities and financial instruments are subject to
fluctuations in exchange rates that may have a positive or adverse effect on the value, price or income of such
securities or financial instruments. Certain transactions, including those involving futures and options, can give rise to
substantial risk and are not suitable for all investors.
Investec may have issued other reports that are inconsistent with, and reach different conclusions from, the
information presented in this report. Those reports reflect the different assumptions, views and analytical methods of
the analysts who prepared them.
To our readers in Australia this does not constitute and is not intended to constitute financial product advice for the
purposes of the Corporations Act.
To our readers in the United Kingdom: This report has been issued and approved by Investec Bank (UK) Limited, a
firm regulated by the Financial Services Authority Limited and is not for distribution in the United Kingdom to private
customers as defined by the rules of the Financial Services Authority Limited.
To our readers in the Republic of Ireland, this report is issued in the Republic of Ireland by Investec Bank (UK)
Limited (Irish Branch), a firm regulated by the Financial Services Authority.
This report is disseminated in South Africa by Investec Bank Limited, a firm regulated by the South African Reserve
Bank and in Switzerland by Investec Bank (Switzerland) AG.
This report is not intended for use or distribution in the United States or for use by any citizen or resident of the
United States.
26You can also read