The data-driven R&D Autobahn to Cures - Evotec
←
→
Page content transcription
If your browser does not render page correctly, please read the page content below
The data-driven R&D
Autobahn to Cures

Evotec SE, Full-year 2020 results, 25 March 2021
Forward looking statement

Information set forth in this presentation contains forward-looking statements, which
involve a number of risks and uncertainties. The forward-looking statements contained
herein represent the judgement of Evotec as of the date of this presentation. Such
forward-looking statements are neither promises nor guarantees, but are subject to a
variety of risks and uncertainties, many of which are beyond our control, and which could
cause actual results to differ materially from those contemplated in these forward-looking
statements. We expressly disclaim any obligation or undertaking to release publicly any
updates or revisions to any such statements to reflect any change in our expectations or
any change in events, conditions or circumstances on which any such statement is based.

Note:
Just - Evotec Biologics (former Just.Bio) was acquired effective 02 July, 2019. Effective 01 April 2020, Evotec GT
started its operations. Furthermore, the acquisition of the assets (land and buildings) and people of BBS Biopark in
Toulouse was effective on 01 July 2020. All three Units were fully consolidated in the group numbers from the
respective dates onwards

                                                                                                                       p. 1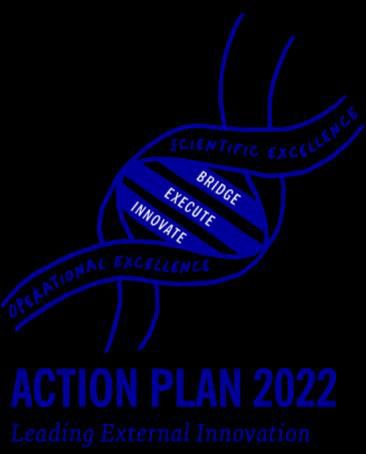
Welcome
             The Management Team

Werner Lanthaler           Enno Spillner   Craig Johnstone   Cord Dohrmann
     CEO                      CFO                COO              CSO

                                                                             p. 2
Agenda

1   Highlights & Strategy
2   Financial performance 2020
3   Scientific and operational progress
4   Guidance 2021

                                          p. 3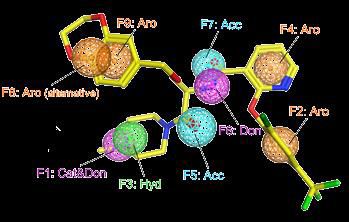
The data-driven R&D Autobahn to Cures
                   Highlights & lowlights 2020

Highlights                                                                                          Lowlights
• Very good progress within co-owned pipeline – on our way to build long-term royalty-pool          • Delay of
• New and extended EVT Innovate partnerships in e.g. kidney disease, protein degradation, rare        milestones and
  diseases,…                                                                                          start of clinical
                                                                                                      trials due to
• Just – Evotec Biologics gaining strong momentum (+ 35% like-for-like); Construction of
                                                                                                      Covid-19
  J.POD® 1 US on track to start operations in H2 2021; Initiation of J.POD® 2 EU still in H1 2021
                                                                                                    • Impairment of
• New and extended EVT Execute integrated drug discovery & development alliances
                                                                                                      rights to future
• Successful integration of Evotec GT (Gene Therapy)                                                  sales of Haplogen
• Acceleration of innovation platforms – EVOcells, EVOpanOmics, EVOpanHunter, etc…                    assets
• Good progress of equity-based co-ownership engagements and BRIDGEs
• Strategic vision endorsed with Mubadala and Novo Holdings investments (together € 250 m)

                                                                                                                     p. 4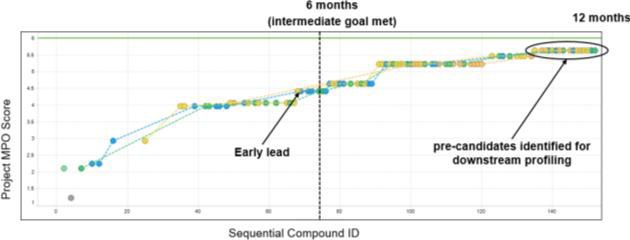
Guidance comfortably met – despite COVID-19 pandemic
                                                     Results and guidance 2020

                                                                                                               Final results                                              Latest guidance   Initial guidance
                                                                                                                       2020                                               November 2020          March 2020

  Group revenues1)                                                                                                     € 500.9 m                                            € 440 – 480 m    € 440 – 480 m

  Unpartnered R&D2)                                                                                                       € 46.4 m                                         Approx. € 45 m    Approx. € 40 m

  Adjusted Group EBITDA3)                                                                                              € 106.6 m                                            € 100 – 120 m    € 100 – 120 m

1) Group revenues including revenues from recharges (IFRS 15 material recharges)
2) Unpartnered R&D expenses is excluding expenses for ID-related expenses fully reimbursed by Sanofi under other operating income
                                                                                                                                                                                                               p. 5
3) Adjusted EBITDA before contingent considerations and excluding impairments on goodwill, other intangible & tangible assets as well as the total non-operating result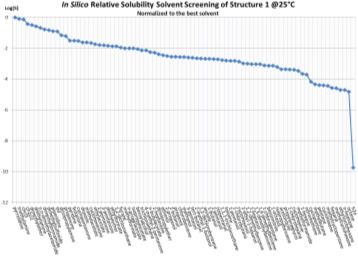
New technologies, more precision, higher speed and efficiency
              Evotec today – 14 Sites & close to 4,000 employees

USA              Austria         Italy         Germany             UK                    France
~ 400            ~30             ~700          ~ 900               ~ 850                 ~ 800
• Princeton      • Orth an       • Verona      • Hamburg (HQ)      • Abingdon            • Lyon
• Seattle          der Donau                     & Goettingen        (Dorothy Crowfoot   • Toulouse
• Branford                                       (Manfred Eigen      Hodgkin Campus)       (Campus Curie)
• Watertown                                      Campus)           • Alderley Park
   1st                                         • Cologne                                    2st
J.POD®:
Redmond
                                               • Munich                                  J.POD®:
                                                                                         Toulouse

                                                                                                            p. 6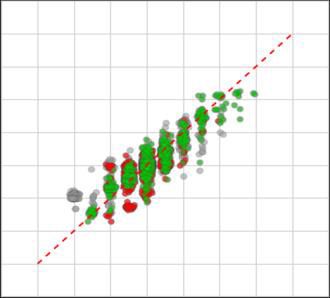
> 500 new top “drivers” joined the data-driven R&D Autobahn for Cures
         Growth of talent in 2020

                                                               • > 80% with at least one academic
                                                    > 4,000      qualification; > 30% PhDs
                                            3,572
                                                               • > 8 years drug discovery and
                                    3,030                        development experience
                     2,600
                                                               • 54% female; > 75 nationalities

        1,900                                                  • > 500 new talents planned 2021

1,000

2016    2017         2018           2019    2020    2021 (e)

                                                                                                  p. 7
Top talents in important leadership roles enable long-term vision and acceleration
                            Selected recent new hires

Claudia Karnbach                         Christine Guenther                          Christiane Honisch                        Adam Stoten
Global Head of Strategic Partnerships    Cell Therapy, Medical Director              Evognostics                               Academic Partnerships (BRIDGEs)
& Alliances
                                         Transform scientific innovation in cell &   Use my passion & knowledge to connect     Coming soon
Customer-centric high performance        gene therapy into effective therapies       & inspire
alliance & partnership

Florian Tegeler                          Uwe Buenting                                Francisco Cruzalegui                      Anna Upton
PanHunter                                PanHunter                                   SVP Biology                               Tuberculosis Research
                                                                                                                               and Development
Make PanHunter the leading multi-omics   Make PanHunter the leading multi-omics      Driven by my love for science & its
data analytics product                   data analytics product                      power to bring new and better medicines   Expanding and driving innovation in TB
                                                                                     to patients

                                                                                                                                                                        p. 8
Industry dynamics support our vision of more precise and accessible medicine
                                                   Growth drivers for the future

   RNA analysis/transcriptomics market1)                                                                                                                           Global AI market in drug discovery2)
   in US$ bn                                                                                                                                                       in US$ bn
                                                                       CAGR
                                                                       ~ 14%
                                                                                                  8.7                                                                                                   20.0
                                                                                                                                                                                            CAGR
                                                                                                                                                                                            ~ 96%
                                                4.5

                                                                                                                                                                                   0.7
                                              2020                                               2025                                                                              2020                 2025

   Global drug discovery external innovation market3)                                                                                                              Global precision medicine market4)
   in US$ bn                                                                                                                                                       in US$ bn
                                                                       CAGR
                                                                                                                                                                                            CAGR
                                                                       ~ 7%                       4.3                                                                                       ~ 11%       107
                                                3.1
                                                                                                                                                                                    63

                                              2020                                               2025                                                                              2020                 2025

1) Reporterlink: RNA Analysis/ Transcriptomics Market by Product, Technology, Application, End User, COVID-19 Impact - Global Forecast to 2025, Evotec estimates
2) Deep Knowledge Analytics (DKA) titled ‘Landscape of AI for Drug Discovery and Advanced R&D Q2 2019’,, Evotec estimates
                                                                                                                                                                                                               p. 9
3) https://www.grandviewresearch.com/press-release/global-drug-discovery-outsourcing-market, Evotec estimates
4) https://www.gminsights.com/ Feb 2020, Evotec estimates
Multi-modality increasingly opens new doors to cures
Small molecules, biologics, cell and gene therapy
Global biologics market1) Global gene therapy market2)
in US$ bn in US$ bn
CAGR
559 CAGR 5.2
~ 12%
~ 20%
317
2.1
2020 2025 2020 2025
Global antisense & RNAi therapeutic market3) Global stem-cell therapy market4)
in US$ bn in US$ bn
CAGR CAGR
~ 7% 1.8 ~ 9% 15.4
1.3 10.0
2020 2025 2020 2025
1) https://www.reportsanddata.com/report-detail/biologics-market, Evotec, estimates
2) https://www.grandviewresearch.com/industry-analysis/gene-therapy-market, Evotec estimates p. 10
3) https://www.grandviewresearch.com/press-release/antisense-rnai-therapeutics-market, Evotec estimates
4) https://www.grandviewresearch.com/industry-analysis/stem-cells-market, Evotec estimatesThe R&D Autobahn to Cures is data-driven
The acceleration of multi-omics data generation “Omics Tsunami”
Omics data entered exponential growth phase Sequencing costs dropped dramatically4)
Normalised database growth per Mb4) [in USD]
140 10000
Genomics1) 1000
100 Moore’s law
Transcriptomics2)
120 10
Proteomics3)
1
PanOmics trendline 0,1
100 0,01
0,001
2001 2003 2005 2007 2009 2011 2013 2015 2017 2019
80
60
AI/ML entering into exponential growth phase5)
Normalised number (2009 = 0; 2019 = 100)
50%
100
40 keywords: ML + drug
80
keywords: AI + drug
60
20 40
20
0 0
2009 2010 2011 2012 2013 2014 2015 2016 2017 2018 2019 2020 2009 2010 2011 2012 2013 2014 2015 2016 2017 2018 2019
1) NCBI – GenBank and WGS Statistics (https://www.ncbi.nlm.nih.gov/genbank/statistics/); 2) NCBI – Sequence Read Archive (SRA; https://www.ncbi.nlm.nih.gov/sra/docs/sragrowth/); 3) Perez-Riverol et al., The PRIDE
database and related tools and resources in 2019 (doi.org/10.1093/nar/gky1106); 4) Wetterstrand KA. DNA Sequencing Costs: Data from the NHGRI Genome Sequencing Program (genome.gov/sequencingcostsdata);
p. 11
5) Web of Science (http://www.webofknowledge.com)“…we are just at the beginning”
Action Plan 2025 – The data-driven R&D Autobahn to Cures
2025
2021
2018
2012 Action Plan 2025
2009
Data, multimodality & access
Action Plan 2022
Action Plan 2016 Aspire global leadership
Action Plan 2012 Build innovation seeds
Restructure for growth
p. 12Precision, AI/ML, and excellent execution accelerate our path to co-ownership
Unique business model - Co-ownership (EVOroyalty)
R&D and IP EVOroyalty
1 Multi-modality Innovation Platforms generation Co-owned
EVOiR&D: Integrated drug discovery & development pipeline
EVOpanOmics & EVOpanHunter: Data-driven precision
medicine
2 Indication-driven target pipelines
P2X3, B1, A2a,…
3 Just - Evotec Biologics (EVOaccess)
From J.HAL to J.Design and a network of J.POD®s
4 BRIDGEs, operational ventures (EVOequity)
Lab282, Lab150, Exscientia, Topas, Breakpoint, …
World-class
partnership
services
p. 13Agenda
1 Highlights & Strategy
2 Financial performance 2020
3 Scientific and operational progress
4 Guidance 2021
p. 14Reaching € 500 m landmark in a challenging year
Key financials 2020: Condensed income statement (IFRS)
2020 2019 %
in € m1) Actual Actual vs. 2019 • Strong revenue growth of 12%
despite COVID, delays in milestones,
Revenues from contracts with customers2) 500.9 446.4 +12% and unfavourable fx rates (at constant
fx rate vs. 2019, revenues would stand
Gross margin 25.1% 29.8% at € 507.7 m).
• Strong performance in base business
• R&D expenses (63.9) (58.4) +9%
(+16%)
• SG&A expenses (77.2) (66.5) +16% • Gross margin affected by lower
milestones and end of Sanofi subsidy
• Impairment result (net) (3.2) (11.9) -73% for Toulouse
• Other op. income (expenses), net 67.2 66.6 1% • Unpartnered R&D up by 24% to
€ 46.4 m (2019: € 37.5 m) due to
Operating result 48.5 62.6 -22% multiple platform projects & cell
therapy
Adjusted Group EBITDA3) 106.6 123.1 -13% • At constant fx rate vs. 2019, adjusted
EBITDA would stand at € 110.8 m
Net income 6.3 37.2 -83%
1) Differences may occur due to rounding
2) Including IFRS 15 material changes
p. 15
3) Adjusted EBITDA before contingent considerations and excluding impairments on goodwill, other intangible & tangible assets as well as the total non-operating resultVery convincing performance in both segments
Condensed income statement based on segments for FY 2020
Inter-
EVT EVT segment Not Evotec • EVT Execute revenues up 16%
in € m1) Execute Innovate elimination allocated2) Group due to strong base business, over-
compensating for moderate net
External revenues 373.4 105.7 – 21.8 500.9
negative effect of portfolio changes
Intersegment revenues 115.8 – (115.8) – – (Sanofi € -18.0 m; Just – Evotec
Biologics, first half year (€ 16.3 m)
Gross margin 26.0% 8.7% – – 25.1%
• EBITDA growth of 6% despite end of
• R&D expenses (4.4) (69.9) 10.4 – (63.9) Sanofi subsidy, preparations for
J.POD® 1 US and negative fx effects
• SG&A expenses (61.8) (15.5) – – (77.2) • EVT Innovate revenues up 12%
despite lower contribution from
• Impairment result (net) – (3.2) – – (3.2)
milestones. Growth driven by progress
• Other op. income (expenses), of BMS alliances and new partnerships
16.6 50.6 – – 67.2
net • EBITDA lower due to delayed
milestone payments and higher
Operating result 77.3 (28.8) – – 48.5
investments for unpartnered R&D
Adjusted EBITDA3) 129.3 (22.7) – – 106.6
1) Differences may occur due to rounding
2) Revenues in the segments consist of revenues from contracts with customers without revenues from recharges as those are not of importance for the management to assess the economic situation of the segments.
p. 16
3) Adjusted for changes in contingent considerations & income from bargain purchasePositive trend continues in Q4
Q4 2020 results
Q4 2020 Q4 2019 % vs.
in € m1) Actual Actual 2019 • Q4 revenues with 12% growth from
strong base revenues. Milestone and
Revenues2) 140.5 125.1 +12% upfront revenues were extraordinarily
high in Q4 2019
Gross margin 26.0% 27.2% – • R&D increased as expected in
anticipation of next growth steps
• R&D expenses (17.9) (17.1) +4%
• Lower contribution from other
operating income
• SG&A expenses (19.1) (20.3) -6%
• Good earnings quality: Adjusted
• Impairment result (net) (3.2) – – EBITDA stable vs last year, despite
end of Sanofi subsidy and reduced
milestone momentum
• Other op. income (expenses), net 16.9 19.6 -14%
• Strong adjusted EBITDA margin
Operating result 13.2 16.2 -18% of 21%
Adjusted Group EBITDA3) 29.7 29.9 -1%
1) Differences may occur due to rounding
2) Including IFRS 15 material changes
p. 17
3) Before contingent considerations, income from bargain purchase & excl. impairments on goodwill, other intangible assets & tangible assets as well as the total non-operating resultOrganic growth continues at double-digit rates
Revenue bridge 2019-2020
Composition of revenue growth • Reported growth of 12%
in € m
• Cumulated portfolio changes
500.9
(end of Sanofi subsidy,
(6.8)
446.4 63.0 consolidation of Just – Evotec
(1.7) Biologics)
• fx effect: -1.5%
• Organic growth: 14%, despite
lower income from milestones,
upfronts and licenses
Revenues 2019 Portfolio1) Organic growth fx effect Revenues 2020
1) Sanofi subsidy and Just – Evotec Biologics
p. 18Organic EBITDA growth despite material mix effects
Adjusted EBITDA at constant exchange rates € 111 m
Composition of EBITDA development • Decline by 13% affected from
in € m portfolio, fx effects and lower
123.1
contribution from milestones
(17.2) 4.9 • Cumulated portfolio changes (end of
106.6 subsidy from Sanofi agreement,
(4.2) consolidation of Just – Evotec
Biologics) with visible though
anticipated effect: -14%
• fx effect: -3.4%
• Organic growth: 4.0% despite
significantly lower contribution from
milestones, upfronts and licenses
• EBITDA margin at constant fx rates:
21.8% (reported: 21.3%)
EBITDA 2019 Portfolio1) Organic growth fx effect EBITDA 2020
1) Sanofi subsidy and Just – Evotec Biologics
p. 19Strong balance sheet and cash position leaving room for strategic growth
Balance sheet – 31 Dec. 2019 versus 31 December 2020
Balance sheet total Equity ratio Capital increase strengthening KPIs
in € m in %
Equity ratio step-up to 50%
Leverage ratio close to zero,
1,180.9 1,462.9 40.4 49.4 providing flexibility to make use of
strengthened balance sheet for
ambitious growth plans
Liquidity per Q4 2020 € 481.9 m
Net Debt /adjusted EBITDA1) Liquidity
in € m
1,2 0.1 320.0 481.9
19 including IFRS 16
p. 20Agenda
1 Highlights & Strategy
2 Financial performance 2020
3 Scientific and operational progress
4 Guidance 2021
p. 21Precision medicine is our focus
Patient databases and models combined with EVOpanHunter/EVOpanOmics and Multi-modality
Molecular patient Patient (iPSC) – Diagnostics and
databases derived disease models biomarkers
• Re-defining health and • Focus on disease relevance • Precision diagnostics
disease via molecular throughout the process • Precise tracking of
disease profiles • Comprehensive disease progression
compound profiling
Genomics – Transcriptomics – Proteomics – Metabolomics EVOpanOmics
Industrialised data generation Data generation
Data science – Machine learning / Artificial intelligence – Bioinformatics EVOpanHunter
AI/ML driven data analytics Data analytics
Small molecules – Antibodies – Bifunctionals – Cell therapy – Antisense – Gene therapy
Multi-modality
p. 22Fully invested pipeline, strongly gaining visibility in the next 18 months
Progress 2020 of drug candidates in advanced stages
Molecule Therapeutic Area/Indication Partner Discovery Pre-clinical Phase I Phase II Phase III
EVT201 Insomnia (GABA-A)
Selected pipeline events BAY-1817080
BAY-1817080
Chronic cough (P2X3)
Overactive bladder
BAY-1817080 Neuropathic pain
BAY-1817080 Endometriosis
1. Phase IIb with Bayer in RCC (Eliapixant) CT7001
CT7001
Oncology (CDK7)
Oncology (CDK7)
Clinical
EVT401 Immunology & Inflammation (P2X7)
2. Phase II with Bayer in Overactive bladder (Eliapixant) BAYxxx
BAY2328065
Women‘s health
Gynaecology
BI 894416 Asthma (not disclosed)
3. Phase II with Bayer in Endometriosis (Eliapixant) BI 860585
TPM203
Oncology (mTORC1/2)
Pemphigus Vulgaris (not disclosed)
DSP-1181 Obessive-compulsive disorder (5-HT1A)
CNTX 6016 Pain (CB2)
4. Phase II with Bayer in Neuropathic pain (Eliapixant) EVT894
BAYxxx
Chikungunya (Antibody)
Endometriosis (not disclosed)
EVT801 Oncology (VEGFR3)
5. Phase II with BI in Oncology / Pain APN411
EXS21546
Oncology – Immunotherapy
Oncology (various programmes)
Pre-clinical
GLPGxxxx Fibrosis (not disclosed)
6. Phase II with Bayer in Gynaecology (B1 antagonist) BAYxxxx
QRB001
Nephrology (not disclosed)
Metabolic – Diabetes (not disclosed)
BMSxxxx Neurodegeneration (not disclosed)
7. Phase I with NIH in Chikungunya virus
EVT895 HBV
EVTxxxx CNS, Metabolic, Pain … >10 further programmes
Various ND1) Nephrology
ND1) Nephrology
8. Phase I with BMS in CNS ND1)
INDY inhibitor
PCOS
Metabolic
Various Oncology
9. Phase I with Exscientia in Oncology (A2a) ND1)
ND1)
Oncology
Oncology – Colorectal cancer
ND1) Oncology – DNA damage response
ND1)
10. Phase I with Sanofi in Immuno-oncology ND1)
ND1)
Novel antibiotics
Novel antibiotics
Anti-bacterial
Discovery
TargetPicV Antiviral
11. Phase I with Sanofi in HBV Various
Various
Anti-infectives
All indications
>5 programmes
ND1) Dermatological diseases
12. Multiple co-owned equity companies will progress ND1)
Various
Facioscapulohumeral Dystrophy
Immunology & Inflammation – Tissue fibrosis
in clinic (e.g. Topas, Forge, Carrick, Fibrocor, …)
Various Fibrotic disease Fibrocor Therap./ Galapagos
Various ND1) Immunology & Inflammation
ND1) Inflammatory
ND1) Cancer
ND1) Novel broad-spectrum antibiotic
ND1) Heart failure
Various Internal: Oncology, CNS, Metabolic, Pain & Inflammation >40 further programmes
p. 23Continuously investing into precision medicine
Maintaining leadership with next generation discovery platforms
Molecular patient Various
Various cohorts
databases indications
Patient (iPSC) – Astrocytes Oligodendrocytes Natural killer cells Clinical trial in dish
derived disease models Microglia Myelin T-cells Organs on chip
High-throughput Single nuclei High-throughput
bulk sequencing sequencing proteomics Next generation
EVOpanOmics animal models
Single-cell sequencing Spatial transcriptomics Metabolomics
SM Artificial intelligence
EVOAI/ML Efficacy /
HAL - Humanoid Machine learning Software development
EVOpanHunter tox prediction
antibody library
Small molecules
Cell therapy Antisense (Secarna) Exosomes for RNA targeting
Modalities Gene therapy Protein degradation
Novel Parovirus platform
Bifunctionals New molecular glues AlloMod, ATAC
Small molecule Antibody Abkine Cell therapy Nucleoproteins/ASO rProtein Genetic screen
p. 24Molecular patient databases generate significant value
Kidney disease data base (NURTuRE) delivered multiple high value partnerships
2016 2019 2020 Q1 2021
• Upfront payment: € 6 m • Funded by Vifor: € 25 m • Upfront payment: ND • Pipeline building initiated
• Research funding • 50% ownership on all • Research funding • UF payment: ND
projects
• Milestones > € 300 m • Milestones > € 150 m per • Research funding
product
• Tiered royalties • MS as well as tiered
• Tiered royalties royalties
p. 25Evotec and Takeda unlocking the undruggable genome
RNA-binding small molecules: a complementary approach to antisense oligonucleotides
Evotec’s proprietary RNA targeting platform is specifically designed to
• Identify RNA tertiary structural elements where SM are able to bind with
sufficient selectivity and affinity
• Discover and develop suitable SM binders that potentially deliver orally • Discover and develop RNA targeting
available drugs small molecule therapeutics
• Identify and deliver proof-of-target engagement for RNA structures for
biologically active SM binders. • Research funding
RNA::RNA
• Milestones: US$ 160 m per programme
• Tiered royalties
p. 26Excellent position for continued growth
Major developments in 2020 (selection)
• EVOiR&D:
Multiple new and extended drug discovery and development agreements e.g.
Austrianni, BI, Ildong Pharma, Rappta, STORM, Takeda
High quality and high performance acknowledged through feedback, 90% repeat
business, extensions and growth of existing, long-term partnerships
> 800 partners across the industry (~ 8% up compared to 2019)
Invested in expansion of sites to support for further growth in all territories
• EVOaccess: Just – Evotec Biologics
Several new collaborations, DoD expansion
Antibody Discovery capabilities boosted with Humanoid Antibody Library (J.HAL) –
and Alloy, complementing Evotec biology and disease area expertise
J.POD® 1 US on track for opening in H2 2021
J.POD® 2 EU initiated in Toulouse (France)
• EVOgenes: Successful start in gene therapy with R&D centre Evotec GT
p. 27The time is now for J.POD® 2 EU …
Rationale for J.POD® 2 in Toulouse, France1)
• Global demand for flexible biologics capacity and for more affordable access to medicines
is accelerating
• J.POD®1 US in Redmond is on track and demand is strong, including co-owned pipeline
• Europe is the second largest biologics market, strong desire for local capacity
and security of supply
• Toulouse footprint creates operational efficiency and design
for multi-modality biological treatments such as cell therapy
adds further synergy with EVT strategic needs
1) Subject to local planning, environmental and building regulations and other support and approvals
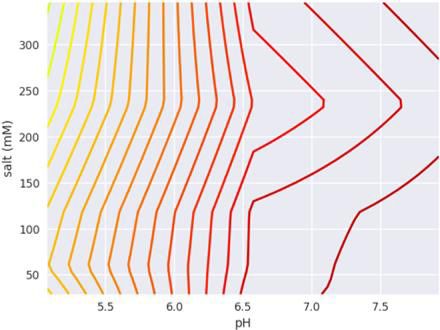
p. 28Leading in AI / ML driven biologics from discovery to manufacturing
Biologics Platform overview – AI / ML tools accelerate learning
PD to manufacturing model
GMP
Characterisation to PD model
(100,000s)
(10s)
(10,000s)
Structure to
(100s)
data available
Sequence to characterisation model
Amount of
structure model
Common data set (J.DESIGN)
Intense learning is focused on the most abundant, least expensive data – DNA sequence
p. 29(100,000s)
Modality
HT Omics
Biomarker(s)
DISCOVER
Drug intervention point
(10,000s)
DMTA cycles
OPTIMISE
Biomarker validation
create biomarkers, drive projects… (e.g. tox prediction)
1 vs 1 vs 1 vs 1 vs
rest rest rest rest
no with no with
Compound Name Chen or papers Avg Cmax Cma Cma Cma Cma
acetaminophen +VE 147.41278 -VE +VE +VE -VE
amitriptyline +VE 0.4293128 -VE +VE -VE +VE
amlodipine +VE 0.044023 +VE +VE +VE +VE
azathioprine +VE 4.4837533 -VE +VE +VE -VE
bicalutamide +VE 1.9564431 +VE +VE +VE +VE
(100s)
bosentan +VE 6.0448637 +VE +VE +VE +VE
bromfenac +VE 19.772138 +VE +VE +VE +VE
carbamazepine +VE 43.238857 +VE +VE +VE +VE
celecoxib +VE 2.682863 +VE +VE +VE +VE
chloroquine +VE 0.48 +VE +VE +VE +VE
chlorpromazine +VE 0.8954717 +VE +VE +VE +VE
citalopram +VE 0.2554699 +VE -VE +VE -VE
clomipramine +VE 0.4890246 +VE +VE +VE +VE
dasatinib +VE 0.6081843 +VE -VE +VE -VE
diclofenac +VE 9.2788275 +VE +VE +VE +VE
erythromycin +VE 7.2417495 +VE +VE +VE +VE
fenofibrate +VE 18.573658 +VE +VE +VE +VE
fluoxetine +VE 0.2764961 +VE +VE +VE +VE
gefitinib +VE 0.213 +VE +VE +VE +VE
gemfibrozil +VE 185.35533 +VE +VE +VE +VE
imipramine +VE 0.504685 +VE +VE +VE +VE
ketoconazole +VE 12.106458 +VE +VE +VE +VE
lovastatin +VE 0.0174299 +VE +VE +VE +VE
metoclopramide +VE 0.4 -VE +VE -VE +VE
nefazodone +VE 3.6241379 +VE +VE +VE +VE
nifedipine +VE 0.2828494 -VE +VE -VE +VE
nimesulide +VE 20.068505 +VE +VE +VE +VE
nitrofurantoin +VE 15.14702 -VE +VE +VE +VE
nortriptyline +VE 0.8107487 +VE +VE -VE +VE
paroxetine +VE 0.149287 +VE +VE +VE +VE
perhexiline +VE 2.1117921 +VE +VE +VE +VE
phenformin +ve 0.63 +VE +VE +VE +VE
pioglitazone +VE 3.0083337 +VE +VE +VE +VE
piroxicam +VE 9.8151317 +VE +VE +VE +VE
promethazine +VE 0.2759525 +VE +VE +VE +VE
rifabutin +VE 0.685 +VE +VE +VE +VE
risperidone +VE 0.0698484 -VE +VE -VE +VE
ritonavir +VE 15 +VE +VE +VE +VE
rosiglitazone +VE 1.0621822 -VE +VE -VE +VE
sertraline +VE 0.0800052 +VE +VE +VE +VE
simvastatin +VE 0.0224454 +VE +VE +VE +VE
sulindac +VE 24.659484 +VE +VE +VE +VE
tamoxifen +VE 0.7283865 +VE +VE +VE +VE
tetracycline +VE 17.347977 +VE +VE +VE +VE
thioridazine +VE 0.55 +VE +VE +VE +VE
ticlopidine +VE 7.9515335 +VE +VE +VE +VE
tolcapone +VE 37.646934 -VE +VE -VE +VE
troglitazone +VE 6.2160624 +VE +VE +VE +VE
verapamil +VE 0.6049658 +VE +VE +VE +VE
warfarin +VE 11.075831 +VE +VE +VE +VE
zafirlukast +VE 1.1405807 +VE +VE +VE +VE
zimelidine +VE 0.327844 -VE -VE -VE -VE
zomepirac +ve 10.526785 +VE +VE +VE +VE
Data Surface linking Independent Data Chambers
amikacin -VE 49.6 -VE -VE -VE -VE
TPP
atropine -VE 0.025 -VE -VE -VE -VE
betaine -VE 724.54815 -VE -VE -VE -VE
bisacodyl -VE 333.575 -VE -VE -VE -VE
brompheniramine -VE 0.0332688 -VE -VE +VE -VE
caffeine -VE 56.097575 -VE -VE -VE -VE
chlorpheniramine -VE 0.6938949 -VE -VE -VE -VE
dexamethasone -VE 0.2264288 -VE -VE -VE -VE
dextromethorphan -VE 0.0207928 -VE -VE -VE -VE
dobutamine -VE 1.2664362 +VE -VE -VE -VE
dopamine -VE 0.1356192 -VE -VE -VE -VE
SELECT
droperidol -VE 0.011 -VE -VE -VE -VE
dutasteride -VE 0.0757 +VE -VE +VE -VE
epinephrine -VE 0.0017763 -VE -VE -VE -VE
ergocalciferol -VE 0.0500391 -VE -VE -VE -VE
fenoldopam -VE 0.000196 -VE -VE -VE -VE
fexofenadine -VE 0.5666667 -VE -VE -VE -VE
flumazenil -VE 0.8291674 -VE -VE -VE -VE
Drug Candidate(s)
isoproterenol -VE 1.128584 -VE -VE -VE -VE
isosorbide dinitrate -VE 0.0008 -VE -VE -VE -VE
kanamycin -VE 59.5 -VE -VE -VE -VE
liothyronine -VE 0.0066055 +VE -VE +VE -VE
meclizine -VE 0.025578 -VE -VE -VE -VE
naloxone -VE 0.00047 -VE -VE -VE -VE
neomycin -VE 0.4401 -VE -VE -VE -VE
oxybutynin -VE 0.0217837 +VE -VE +VE -VE
phenoxybenzamine -VE 0.1931091 -VE -VE -VE -VE
phentolamine -VE 0.0749239 -VE -VE -VE -VE
physostigmine -VE 0.0181059 -VE -VE -VE -VE
pimozide -VE 0.11 -VE -VE -VE +VE
pindolol -VE 0.267893 -VE -VE -VE -VE
plerixafor -VE 1.841 -VE -VE -VE -VE
primidone -VE 10.78118 -VE -VE -VE -VE
procyclidine -VE 2.1917618 -VE -VE +VE -VE
propantheline -VE 0.439632 -VE -VE -VE -VE
protriptyline -VE 1.1 -VE -VE +VE -VE
pyridoxine -VE 0.448205 -VE -VE -VE -VE
riboflavin -VE 0.685 -VE -VE -VE -VE
terazosin -VE 0.13 -VE -VE -VE -VE
theophylline -VE 93.27 -VE -VE -VE -VE
thiamine -VE 6.8 -VE -VE -VE -VE
vinblastine -VE 0.008 +VE -VE +VE -VE
vitamin c -VE 0.0852 -VE -VE -VE -VE
(10s)
SM – From Concept to Proof of Concept – AI / ML tools accelerate learning
Leading in Small molecule strong AI / ML data-driven integrated R&D
API
Safety
DEVELOP
Formulation/Drug Product
Unique in the industry: high quality data at every stage in the value chain to de-risk projects, design modalities,
GMP
p. 30Offering resonates with partners
Attraction, Extension, Retention
Attraction Extension Structural Retention ≥ 90%
CAGR CAGR
+9% 100 +18% 1,000
315 315 80 800
283 275
263 263
60 600
40 400
20 200
0 0
2018 2019 2020 2018 2019 2020 2018 2019 2020
New customers during the year No. of customers > € 1 m revenues No of Customers
Net new customers
• Very robust demand for shared drug • Integrated drug discover & development • Core KPI to measure partners’
discovery & development offering yields increasing “share of wallet” satisfaction
• Integrated offering translates in market • Faster and better results versus in-house • Some follow-on projects delayed in 2020
share gains infrastructures in the industry justify larger • Strong basis for double-digit growth
• Referencing of satisfied customers as key contracts
marketing tool
p. 31Agenda
1 Highlights & Strategy
2 Financial performance 2020
3 Scientific and operational progress
4 Guidance 2021
p. 32ESG & Sustainability – Committed to take action
Unique business model aligned with sustainable development goals
• #researchneverstops
…to develop more precise, accessible and affordable therapies for uncured
diseases, underserved patients and a vast amount of people who have no access
to modern and affordable medicine. – Our greatest contribution to the world.
• First action taken in 2020 to live up to our ESG values
Commitment to set science-based climate targets (E)
Signed the Diversity Charter (S)
Launch of systematic supplier surveillance and
whistleblowing platform EVOwhistle (G)
p. 33Strong growth continues while expanding investment into long-term upside
“The data-driven R&D Autobahn to Cures” – In numbers
Strong revenue growth Adjusted Group EBITDA2)
in € m in € m
550-5701) 123.1 105-1201)
500.9 106.6
446.4 95.5
375.4
263.8 57.2
2017 2018 2019 2020 2021 (e) 2017 2018 2019 2020 2021 (e)
High-value unpartnered R&D3) Strong stable gross margins4)
in € m in %
50-60 31.0 29.8 29.8
46.4 25.1
37.5
22.8
17.6
2017 2018 2019 2020 2021 (e) 2017 2018 2019 2020 2021 (e)
1) At constant fx rates (2020: $/€ 1.15; €/GBP 1.13) Revenues: € 565-585 m; EBITDA: € 115-130 m; Please note that bar heights are only illustrative and not representing actual values
2) Before contingent considerations, income from bargain purchase & excl. impairments on goodwill, other intangible assets & tangible assets as well as the total non-operating result
p. 34
3) Excluding expenses for ID-related expenses fully reimbursed by Sanofi under other operating income; total of R&D expenses in 2020 of € 63.9 m
4) Gross margin in the future represents different business mix, considering amortisation of acquisitions, and may be volatile due to potential milestone or out-licensing payments; gross margin in 2017 restated for IFRS 15Strong year ahead
Guidance 2021
Very good top-line growth expected
• Assumption based on current orders, prospective milestone payments
• Total Group revenues € 550 - 570 m
(€ 565 - 585 m at constant exchange rates1)
Strong EBITDA – despite massive investments
• Regardless of COVID-19, increasing expenses of promising R&D projects, ramp-up of Just –
Evotec Biologics business, expansion of J.POD® 1 capacities in US & J.POD® 2 in EU
• Adjusted Group EBITDA2) € 105 - 120 m
(€ 115 -130 m at constant exchange rates1)
Accelerated R&D investments for growth
• Further expand long-term & sustainable pipeline of first-in-class projects & platforms
• Unpartnered Group R&D expenses of € 50 - 60 m3)
1) $/€ 2020: 1.15; €/GBP 2020: 1.13
1) Before contingent considerations, income from bargain purchase & excl. impairments on goodwill, other intangible & tangible assets as well as the total non-operating result
p. 35
3) Evotec focuses its guidance and upcoming reporting on the “unpartnered R&D” part. ID-related R&D expenses will be fully reimbursed by its partner Sanofi (“partnered R&D”).Strong news flow to be continued …
Selected latest news in Q1 and goals 2021
Important initial achievements in 2021 Next steps
• Contract expansion with DOD on COVID-19 • JPOD® 2 EU to be initiated in Toulouse
• Start clinical development of chikungunya (EVT894) • Acceleration of AI/ML partnering across all modalities
• Integrated multi-target alliance with Related Sciences • J.POD® 1 US to open in H2 2021
• Partnership with UKE for iPSC therapies for heart failure • Partnerships based on own R&D projects and platforms
• Partnership in Chronic Kidney Diseases with Chinook • New clinical trials and progress in the co-owned pipeline
• G-CON Manufacturing & Just – Evotec Biologics • Equity investments and initiation of new BRIDGEs
complete installation of cleanroom PODs®
for J.POD® 1 US
• Takeda RNA strategic alliance
p. 36Important next dates
Financial calendar 2021
Annual Report 2020
25 March 2021
Virtual CMD 2021
20 April 2021
Quarterly Statement Q1 2021
11 May 2021
Virtual Annual General Meeting 2021
15 June 2021
Half-year 2021 Interim Report
11 August 2021
Quarterly Statement 9M 2021 Please click here for the annual report 2020
11 November 2021
p. 37p. 38
Your contact:
Back-up //
Additional Financial information

                                   p. 40
Continuously strong revenues, slight GM decline due to different business mix
Revenues & Gross margin
Improved base business and first full Just – Decreasing gross margin (GM) due to lower
Evotec Biologics milestone-level
in € m in %
500.9 29.8 29.8
30.1
446.4
25.1
39.0 23.9 23.2 23.7
375.4 +12%
29.5
470.8
407.4
345.9
2018 2019 2020 2018 2019 2020
Milestones, upfronts and licences Base reveneues Total GM Gross Margin excl. milestones, upfronts and licences
1) 2017 restated for IFRS 15
p. 41Overall growth and acquisitions reflected
R&D and SG&A expenses overview, in € m
R&D: Focus on metabolic diseases, oncology, and SG&A increase due to overall growth and acquisitions
platforms projects
63.9 77.2
58.4
9.3 66.5
6.4
2.0 3.6
57.0
35.6
4.2
0.6
50.0 51.0
30.8
2018 2019 2020 2018 2019 2020
Overhead expenses Platform R&D Proprietary Innovate projects1)
1) Proprietary Innovate projects, incl. ID covered by Sanofi in 2020 include selected partnered (€ 17.5 m) and unpartnered (€ 46.4 m) R&D expenses
p. 42Expansion of equity portfolio affects net result, but holds great value potential
Investments in growth strategy set to pay off in future
Composition of Net result development • Decline of net result affected from
Changes 2020 vs 2019 in € m investments in growth of all
37.2 building blocks and support
functions
(7.1)
• Impairment development
(5.5)
influenced by extra-ordinary
0.6
effect in 2019
(10.7) (8.2)
8.7
• Higher losses from affiliates is a
function of a growing and
(8.5)
maturing equity portfolio in order
6.3
to create value in the long run
(0.2)
• Other non-operating result driven
Net income Gross R&D SG&A Impairments Other Share of Other non- Taxes Net result
2019 profit expenses expenses operating profit of operating 2020 by fx losses
result associates result
p. 43Strong balance sheet with nearly 50% equity ratio
Balance sheet overview, in € m
Asset base increased due to higher liquidity Strong equity ratio at 49% due to capital increase in
from capital increase and growing PPE capex October
1,462.9 1,462.9
1,180.9 481.9 1,180.9 492.0
Cash, cash
equivalents and
investments 320.0 Loans and 463.1
lease obligations 178.5
Other current and 298.3
248.8 69.6
non-current assets Current liabilities
158.2
Property, plant 337.3 Non-current liabilities 82.6
239.2
and equipment and deferred taxes
722.8
Intangible assets Total stockholders 477.0
and goodwill 372.9 345.4 equity
2019 2020 2019 2020
p. 44Healthy DSO growth better than peers’ standards
DSO1) development
Development of DSO • End of Sanofi subsidy and
Covid-19 related (temporary)
DSO and LTM DSO, in € DSO in days quarterly LTM-average
eased payment terms for
90 partners affected year-over-year
80 comparison only temporarily
70
• Trend reversal started in Q3
60 already and saw continuation
50
in Q4
40 • Accounts receivables as % of
30
revenues well below industry
average
20
10
0
03/18 06/18 09/18 12/18 03/19 06/19 09/19 12/19 03/20 06/20 09/20 12/20
1) Days sales outstanding
p. 45Strong balance sheet is the basis for future growth
Net debt / EBITDA ratio close to zero
Total Net Debts with IFRS 16 Net Debt Leverage Ratio with IFRS 16
Development of Net debt (+) / Net Cash (-) and Net Debt / EBITDA
Total Net Debts excl. IFRS 16 Net Debt Leverage exc. IFRS 16
Including IFRS 16 from Q1 2019
1,8 1,7 1,9 1,9
250 1,6 2
1,3 1,2 1,1
200 0,8 0,8 0,8
0,6 1,0 1
150 0,1
-0,2 -0,4 0
0,4 214
100 0,1 0,1 199
0,0 156
-0,1 143 139 -1,5
50 99 103 96 93 -1
83 86 14 13 73 10
43 39
0 -2
-35 -5
-22 -14
-50
-134 -3
-100 -177 -3,9 -179
-4,2
-4
-150
-200 -5
Q1 ’17 Q2 ’17 Q3 ’17 Q4 ’17 Q1 ’18 Q2 ’18 Q3 ’18 Q4 ’18 Q1 ’19 Q2 ’19 Q3 ’19 Q4 ’19 Q1 ’20 Q2 ’20 Q3 ’20 Q4 ’20
• On a comparable bases (w/o IFRS 16), Evotec shows a stable and strong Net Debt / Net Cash ratio since Q3’18. Q3’17 influenced by Aptuit acquisition
• Increase of net debt in 2020 largely attributable to the financing of J.POD® 1 US, plus further draw down of R&D related loans
• IFRS 16 introduction has lead to arithmetically higher ratios due to the inclusion of lease obligations in debt position
• Capital increase from October 2020 led to massive improvement in ratio for Q4’20 adding further headroom within balance sheet in case financing for
further growth required
p. 46Liquidity growth from capital increase lays the foundation for further growth
Liquidity bridge FY 2020 vs YE 2019, in € m
15.0
481.9
(20.2) (5.8)
250.0
320.0 44.7
(99.1)
(22.7)
31 Dec, 2019 Operating Capex excl. Equity Capital increase Bank loans & Repayment of fx difference Dec 31, 2020
cash flow Finance leases investments Promissory note lease obligation & Others
p. 47You can also read