Value protection and acceleration roadmap to win in the new reality - 16 June 2020 - Boston Consulting Group

Page created by Pedro Owens
 
CONTINUE READING
Value protection and acceleration roadmap to win in the new reality - 16 June 2020 - Boston Consulting Group
COVID-19 BCG Perspectives Series

                                            Copyright © 2020 by Boston Consulting Group. All rights reserved. Updated 16 June 2020 Version 10.1.
Facts, scenarios, and actions for leaders

Value protection and
acceleration roadmap to
win in the new reality
16 June 2020
Value protection and acceleration roadmap to win in the new reality - 16 June 2020 - Boston Consulting Group
COVID-19
       BCG Perspectives
       Objectives of this document

                                                                                                                                Copyright © 2020 by Boston Consulting Group. All rights reserved. Updated 16 June 2020 Version 10.1.
       COVID-19 is a global                                   Leaders need to drive an integrated
       societal crisis                                        response to navigate the crisis

       We at BCG believe that the COVID-19 outbreak is        It is the duty of health, political, societal, and business
       first and foremost a societal crisis, threatening      leaders to navigate through this crisis. A complex
       lives and the wellbeing of our global community.       interplay of epidemic progression, medical response,
       Society now, more than ever, needs to collaborate      government action, sector impact, and company
       to protect people's lives and health, manage mid-      action is playing out. This document intends to help
       term implications, and search for lasting solutions.   leaders find answers and shape opinions to navigate
                                                              the crisis in their own environments. It encourages
                                                              thinking across the multiple time horizons over which
                                                              we see the crisis manifesting itself.

Source: BCG                                                                                                                 1
Value protection and acceleration roadmap to win in the new reality - 16 June 2020 - Boston Consulting Group
COVID-19 will be a journey with three distinct phases, requiring
an integrated perspective

                       Flatten                                            Fight                                                Future

Typically the initial phase after a pandemic        Finding paths to collectively fight the virus,          Disease controlled through vaccine/cure/
outbreak–goal is to urgently limit number           restart the economy, and support society in             herd immunity, and treatment within

                                                                                                                                                              Copyright © 2020 by Boston Consulting Group. All rights reserved. Updated 16 June 2020 Version 10.1.
of new cases, especially critical care              balancing lives and livelihood                          sustainable medical capacities possible

Social distancing (lockdown) and partial business   Increasing economic activity with recovering            Reactivated economy with strong business
closures lead to economic recession with large      GDP, some business reopenings, and social               rebound and job growth, social restrictions
employment impact                                   distancing on a sustainable level                       limited or completely suspended

                                                      1. Disease progression, health care system capacity, and response

                                                      2. Government policies and economic stimulus

                                                      3. Economic scenarios

                                                      4. Business engagement and response

                                                      5. Public engagement and response

                 All of the above five factors result in specific economic and social outcomes in each phase

Source: BCG                                                                                                                                               2
Value protection and acceleration roadmap to win in the new reality - 16 June 2020 - Boston Consulting Group
Executive Summary | COVID-19 BCG Perspectives

As we navigate the 'Fight' phase, Leadership Teams should develop a winning value protection and acceleration roadmap with integrated
business, financial, and investor strategies that strengthen the share price, and drive strong and sustainable Total Shareholder Return (TSR)
 • Equity markets have been highly volatile through the crisis and a wide variation in TSR1 performance is visible across and within sectors
 • In this uncertain environment, investors are giving leadership teams flexibility and expect companies to 'use the crisis' to build long-term advantage
 • It is more important than ever to build a value protection and acceleration roadmap to become both 'a great company' and 'a great stock'
 • To do this right, leadership teams will need to focus intensely on six imperatives: 'de-average' shareholder value, understand your investor, challenge

                                                                                                                                                             Copyright © 2020 by Boston Consulting Group. All rights reserved. Updated 16 June 2020 Version 10.1.
    your plan, sharpen capital allocation, explore bold portfolio moves, and create an ownership culture
 • Driving shareholder value requires addressing the needs of all key stakeholders: customers, employees, suppliers, communities, and shareholders

Across countries, efforts to flatten the curve continue; severe global economic downturn expected for 2020
 • Globally, 3.6 million patients have recovered from COVID-19; growth rate of daily new cases at ~1%2
 • Increase in daily new cases is propelled by South America, Asia, and Africa, while Europe and North America continue to improve
 • Vaccine and therapeutics development continues to move at unprecedented pace; nine vaccine candidates currently in phases I, II, and III
 • Recent economic forecasts point toward severe downturn in 2020; rebound of global GDP is not expected before 2021
 • Despite rebound in the recent past, no sector at pre-crisis TSR1 levels

      We believe during                                               Taking an integrated perspective on         Thinking multi-
                                                                      health/medical progression,                 timescale in a Flatten-
      this crisis leaders                                             governmental responses, societal            Fight-Future logic
      need to think along                                             reactions, and economic implications
      two dimensions:                                                 to understand business/sector impacts

1. Total Shareholder Return; 2. Daily new case growth rate is calculated based on 7 day rolling average
Source: BCG                                                                                                                                            3
Value protection and acceleration roadmap to win in the new reality - 16 June 2020 - Boston Consulting Group
Guide for leaders

                                                       Copyright © 2020 by Boston Consulting Group. All rights reserved. Updated 16 June 2020 Version 10.1.
Shareholder value 'call to action'
Building a value protection and acceleration roadmap

Updated analyses and impact
Epidemic progression and virus monitoring
Economic and business impact
Value protection and acceleration roadmap to win in the new reality - 16 June 2020 - Boston Consulting Group
COVID-19 Impact dashboard
 As of 12 June 2020
                          Epidemic Progression                                                                                                      Economic Impact                                                                                                      Business Impact
                                                                                                                                                                                    World Bank (8 June)           Banks8
                                                                                                                          GDP forecasts (%)                                                                                                 Stock market performance11
           7.6M                              3.6M                                 425K
           # of cases                    # of recoveries                        # of fatalities                                                                                                                                              20 Mar
                                                                                                                          2020                   -10 -8 -6 -4 -2 0 2 4 6                                 8 10                                                      -31%            -28%            -30%            -34%             -10%
                                                                                                                                                                                                                                             vs 21 Feb
                                                                                                                                                  -9.1%       Baseline 1.0%9
                                                             5 June                  12 June                              Europe                                                                                                             12 June                -9%             0%             -18%            -12%              -4%

                                                                                                                                                                                                                                                                                                                                                        Copyright © 2020 by Boston Consulting Group. All rights reserved. Updated 16 June 2020 Version 10.1.
                                                                                                                                                           -6.1%                   1.8%                                                      vs 21 Feb
     Growth rate1 of daily                                                                                                                                                                                                                                       S&P500 NASDAQ FTSE100                              DAX          CHN SSE
                                                              2.2%                     0.9%                               US
     new cases                                                                                                                                             -6.1%                0.7%
     # of days of case
                                                                 36                       39
                                                                                                                          Japan                                                                                                             Total Shareholder Returns (S&P1200)11
     doubling2                                                                                                                                                                    1.0%          5.9%
                                                                                                                          China                                                                                                             First column: 21 Feb to 20 Mar; Second column: 21 Feb to 12 June
     # of reported recoveries                                                                                                                                       -3.2%                       5.8%
     as % of total cases
                                                               45%                      47%                                                                                                                                                                                Americas                   Europe                       Asia
                                                                                                                          India                                                                                                               Pharma                      -19% -1%                  -20% -6%                  -22% 7%
     # of tests / case3                                          18                       19
                                                                                                                          Estimated employment impact                                                                                         F&B12                       -26% -10%                 -24% -13%                 -12% -3%
     # of tests / million3                                     48K                      54K                                               Total employment   Employees    % of employees
                                                                                                                                                                                                                                              Telecom                     -17% -8%                  -20% -18%                 -14% -10%
                                                                                                                                              2019 (M)     impacted10 (M)    impacted                                                         Software                    -30% -6%                  -32% -13%                 -28% -4%
                                                           Vaccine                 Treatment                              US                         159                           44                        28%                              Retail                      -42% -11%                 -36% -16%                 -24% 12%
     Trials in pre-clinical                                                                                               UK                          33                           10                        29%                              Capital goods               -38% -16%                 -35% -18%                 -29% -5%
     stage and beyond4                                         160                       128
                                                                                                                          Germany                     45                           12                        26%                              Auto                        -47% -18%                 -45% -19%                 -32% -10%
     Trials in Phase 1 and
     beyond5
                                                                  9                       55                              France                      28                           13                        48%                              Real Estate                 -42% -26%                 -26% -26%                 -22% -10%

     Current est. timeline                                    9-33                      6-21                              Italy                       23                             8                       35%                              Energy                      -56% -29%                 -45% -27%                 -41% -23%
     for approval & scale-up                               months6                  months7
                                                                                                                          Spain                       20                             4                       22%                              Banks                       -41% -26%                 -44% -35%                 -26% -13%

1. Growth rate calculated basis rolling 7 day rolling average of new cases; 2. No. of doubling days based on 7 day average growth rate of total cases; 3. Median of values for top 15 countries by nominal GDP (except China); 4. Ongoing trials including pre-clinical, Phase 1 (first trial in humans), Phase 2, Phase 3, Phase 4 ; 5.
Ongoing trials including Phase 1 (first trial in humans), Phase 2, Phase 3, Phase 4; 6. 9 month development current "best case" for first supply (12 months since Apr 2020), then likely to require time for scale-up and continuing to prepare for populations; 7. Remdesivir is approved now, could be more widely available by
Jul-Sep 2020. For the next wave, estimated timeline is Oct '20 – April '22 (6-21 months). If first round of drugs being tested succeeds – then 6-9 months; if not – substantially longer; 8. For India, forecast is for financial year; for others, it is for calendar year; YoY forecasts; Range from forecasts (where available) of World Bank,
International Monetary Fund, JP Morgan Chase; Goldman Sachs, Morgan Stanley; Bank of America; Fitch Solutions; Credit Suisse; Danske Bank; ING Group; HSBC; As of reports dated 12 April 2020 to 5 June 2020; 9. World Bank January 2020 forecast; 10. Available cumulative data as of 05 June 2020 from mid of March
2020; Includes increase in unemployment & employees covered by gov. wage support programs; US: unemployment insurance claims (data as of 11 June); UK (data as of March) and Italy (data as of April) active & inactive unemployment; Germany: short-time work requests, may not actually utilized (data as of May); France:                        5
(data as of June); Spain: (data as of May); figures are changing rapidly and often being reported with a lag from the current date; 11. Sectors are based on Global Industry Classification Standard (GICS) definitions; Performance is tracked for two periods, first from 21 February 2020 (before international acceleration of
outbreak) to 20 March 2020 (trough of the market) and from 21 February 2020 through 12 June 2020; 12. Food & Beverage. Source: WHO, World Bank, JHU CSSE, Our World in Data, IMF, Bloomberg, BCG, Eurostat (Europe), Gov't Wage Support & Unemployment figures & comments: UK Govt 5/12 (UK), ISTAT 4/30 &
FitchRatings 5/18 (Italy), U.S. Department of Labor 5/21 (US), Ministerio de Trabajo 6/2 (Spain), Ministere du Travail 6/5 (France), Arbeitsagentur 6/3 (Germany)
Global equity markets have been highly volatile through the crisis
and in the resulting rebound from March lows
As of 12 June 2020

        Markets largely looked past                 Inflection with virus's spread to Europe, US, beyond;
            virus’s spread in China                 and subsequent rebound of stock markets                                                             Faster rebound
   Cumulative                                   21 Feb
   returns (%)                                                                                                                                          Most stock markets have rebounded

                                                                                                                                                                                                                       Copyright © 2020 by Boston Consulting Group. All rights reserved. Updated 16 June 2020 Version 10.1.
    10%
                                                                                                                                                        rapidly within four months1
                                                                                                                                                        compared with 13+ months2 during
      5%                                                                                                                                                the Global Financial Crisis; NASDAQ
      0%                                                                                                                                                hit all-time high3 on 5 June
     -5%
   -10%
   -15%
   -20%                                                                                                                                                 Continued high volatility
   -25%
                                                                                                                                                        In spite of rapid rebound,
   -30%                                                                                                                                                 volatility continues to be higher
   -35%                                                                                                                                                 (25-414) compared with pre-
           1 Jan              1 Feb                 1 Mar                 1 Apr                 1 May                 1 Jun                             COVID levels (14-195)
                             S&P500           NASDAQ              DAX          FTSE          China SSE

1. Starting 21st February 2020; 2. Time taken by S&P500 to come within +/-5% of price on 26/09/2008; 3. NASDAQ subsequently closed on all-time highs on 8 June 2020, 9 June 2020 and 10 June 2020; 4. 15-day VIX   6
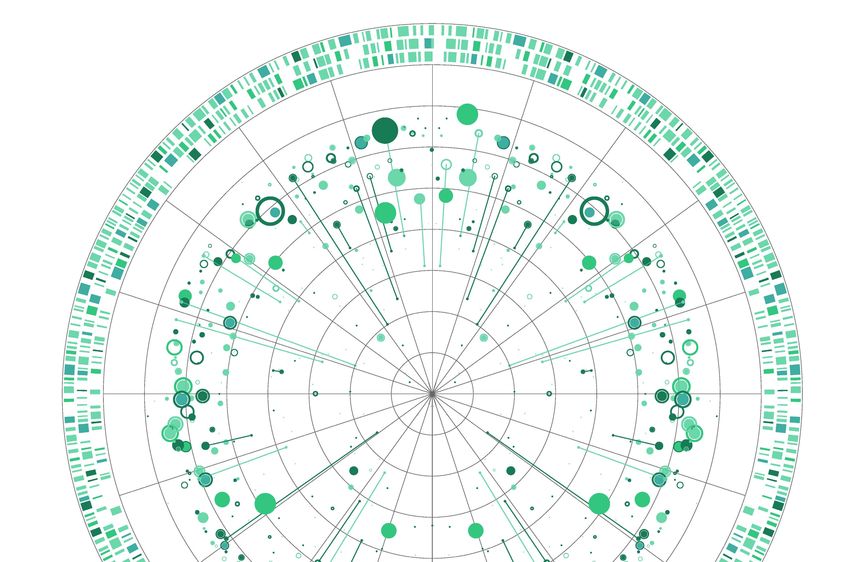
range from 22 May 2020 to 12 June 2020; 5. 15-day VIX range from 30 Jan 2020 to 20 Feb 2020. Source: BCG
A wide range of TSR performance visible across and within sectors
      As of 12 June 2020                                                                                                                                                                                                                                                                                           Based on top S&P
                                                                                                                                                                                                                                                                                                                 Global 1200 companies

                                                                                Total Shareholder Return (TSR) = Change in share price + dividend yield

      Total Shareholder Return from 21 Feb 2020 to 12 June 2020 in % per sector1
40

                                                                                                                                                                                                                                                                                                                                                                    Copyright © 2020 by Boston Consulting Group. All rights reserved. Updated 16 June 2020 Version 10.1.
20

 0

-20

-40
                                                                                                                                         Retailing
             Pharma

                                                                                                                                                                                                                                                                                                                                                           Energy
                                                                                                                                                                                                                                       Media
                                                                                  Food/staples Retail

                                                                                                                                                                           Food & Beverage

                                                                                                                                                                                                              Transport

                                                                                                                                                                                                                                                                                     Durable Goods
                                          Household Products

                                                                                                                      Health Equipment

                                                                                                                                                               Materials

                                                                                                                                                                                             Prof. Services
                                                               Tech Hardware

                                                                                                                                                     Telecom

                                                                                                                                                                                                                                                                                                                                         Hospitality
                                                                                                        Software

                                                                                                                                                                                                                          Financials

                                                                                                                                                                                                                                                                                                                   Real Estate
                                                                                                                                                                                                                                                           Auto

                                                                                                                                                                                                                                                                                                                                 Banks
                      Semiconductors

                                                                                                                                                                                                                                                                                                     Insurance
                                                                                                                                                                                                                                               Utilities

                                                                                                                                                                                                                                                                  Capital Goods
               Healthier2 sectors                                                                                                                    Pressured2 sectors                                                                                                           Vulnerable2 sectors
          Top 10%                      Bottom 10%                              Median                              Performance spread between bottom & top 10%

      1. Sectors are based on Global Industry Classification Standard (GICS) definitions ; data as of 12 June 2020 2. Categories are defined based on comparison with S&P Global 1200 median YTD
      TSR and median net debt/enterprise value (EV) based on latest balance sheet: healthy = TSR & debt/EV > median, pressured = TSR or debt/EV < median, vulnerable = TSR & debt/EV < median;                                                                                                                                                         7
      Source: S&P Capital IQ; BCG ValueScience® Center
In this uncertain environment, investors want leadership teams to 'use the crisis'
to build sources of long-term advantage for their companies
As of 07 June 2020

      91%                                                                          66%                                                                        51%

                                                                                                                                                                                                             Copyright © 2020 by Boston Consulting Group. All rights reserved. Updated 16 June 2020 Version 10.1.
     of investors believe it is important                                         of investors believe companies                                             of investors believe it is
     for companies to prioritize                                                  should actively pursue                                                     important for companies to
     building business capabilities                                               acquisitions2 and consider                                                 continue to fully pursue their
     for advantage and growth, even at                                            divesting2 businesses to                                                   ESG3 agenda and priorities,
     the expense of EPS1                                                          strengthen the overall company                                             even at the expense of EPS1

What we have heard from investors:

          I have written 2020 off. I want                                             Don't waste the crisis. If you have                                        We remain heavily committed to
          companies to invest now to                                                  the liquidity, make bold                                                   ESG3 with an emphasis on social
          strengthen advantage and build                                              acquisitions. And exit businesses                                          responsibility, especially in today's
          platforms for growth                                                        that are not long-term winners                                             environment

1. Earnings per share; 2. 68% of investors believe companies should actively pursue acquisitions; 64% believe they should consider divestitures; 3. Environmental, Social and Governance;
Note: All questions were posed with respect to financially healthy companies (i.e., companies with relatively strong & resilient free cash flow and strong balance sheets).
Source: BCG's COVID-19 Investor Pulse Check, June 7, 2020; n = 150; BCG COVID-19 investor interviews with select institutional investors (May-June 2020).
                                                                                                                                                                                                         8
It is more important than ever for leadership teams to build a value protection
and acceleration roadmap to become 'a great company' and 'a great stock'

                      Business strategy
                        • Growth, margins,
                          portfolio, targets, risk

                                                                                                                                  Copyright © 2020 by Boston Consulting Group. All rights reserved. Updated 16 June 2020 Version 10.1.
                                                                         Great Company             Great Stock
                                                                         • Financially resilient   • Stabilized share
                                                                         • Competitively             price during crisis
                           Strong and                                      advantaged              • Optimal valuation
                           sustainable                                   • Growing profitably        multiple

      Investor                 TSR                       Financial       • Premium ROIC1           • Strong and sustainable
                                                                                                     TSR in medium- to
      strategy                                           strategy        • Committed to ESG2         long-term
           • Valuation                                                   • Employer of choice      • Stable and loyal long-
                                           • Capital structure
             multiple                                                                                term investor base
                                           • Dividends/
           • Messaging                       buybacks
           • Investor type

1. Return on invested capital; 2. Environmental, Social and Governance
Source: BCG
                                                                                                                              9
Key value protection and acceleration questions on the minds of business leaders

     1                                                                      2                                       3
   'De-average' shareholder value                                         Understand your investor                  Challenge your plan
   How have and will my businesses                                        Have my investment thesis and             Will my crisis-adjusted plan deliver on

                                                                                                                                                                     Copyright © 2020 by Boston Consulting Group. All rights reserved. Updated 16 June 2020 Version 10.1.
   contribute to share price and TSR?                                     'natural' investor type changed           my strategic and TSR ambitions?
                                                                          due to the crisis?
   What actions should we take to                                                                                   What are alternative strategic paths that
   strengthen the plan and increase                                       What moves will attract the right         can deliver stronger and more
   our confidence?                                                        investor type?                            sustainable TSR, considering risks and
                                                                                                                    trade-offs?

     4                                                                     5                                        6
   Sharpen capital allocation                                             Explore bold portfolio moves              Create an ownership culture
   How should we distort financial and                                    Are there acquisitions we should pursue   How should we embed TSI3 to ensure
   human capital to deliver stronger TSR?                                 today to strengthen our business?         long-term shareholder value creation?
   What combination of organic (including                                 Are there businesses we should consider   How can we align target setting,
   ESG1), inorganic, and financial strategy2                              divesting to strengthen the company?      planning and incentives to create an
   levers can enhance shareholder value?                                                                            ownership culture?

1. Environmental, Social and Governance; 2. E.g. Dividends & buybacks; 3. Total societal impact                                                                 10
Source: BCG
1                         Example: Global luxury player used portfolio 'x-ray' to gain deep understanding of
                          shareholder value across markets and divisions
                                                             Today's                 Historical 3-year                     Planned 3-year
                                                           share price                value creation                       value creation
'De-average'                                                $ / share           $ / share          TSR (%)           $ / share         TSR (%)
shareholder value                       Region 1               34.2                9.9              11%                20.7               17%
                           Markets      Region 2               14.9                5.4              13%                6.1                12%
                                        Region 3                8.1               (0.1)             (0%)                9.6               30%
Understand what is                      …                       …                  …                 …                  …                  …

                                                                                                                                                        Copyright © 2020 by Boston Consulting Group. All rights reserved. Updated 16 June 2020 Version 10.1.
driving your valuation                  Division A             24.2                7.0              17%                15.3               18%
and how your              Divisions     Division B             17.6                3.8              11%                2.4                 4%
businesses contribute                   Division C             14.2               (1.6)             (5%)               8.5                17%
to share price and TSR                  …                       …                  …                 …                 …                   …
                                        Overall                 81                 19                9%                59                 20%

                                                      Drives greater value than expected            Drives less value than expected

                            Understand how your different businesses can drive shareholder value

                             Challenge line of                 Ensure plans are             Determine portfolio           Allocate financial
                             business plans where              grounded in reality and      roles (e.g., growth           and human
                             historical and planned            adjust accordingly           engine, growth funder,        resources to each line
                             TSR are significantly                                          harvest, exit,                of business based on
                             different                                                      turnaround)                   its portfolio role

                                                                                                                                                   11
                         Source: BCG
2                          Example: B2B technology services company used investor segmentation to develop TSR
                           strategy roadmap during GFC1 and migrate to a more attractive investor type

                                                                                   Original investor type                             Optimal new target type
Understand
                          Investors' criteria                         “Deep Value” investors                                  “Quality / Alpha Value” investors
your investor
                           Revenue growth
                                                                       0% - GDP level growth                                   3-5% organic + some tuck-in M&A
                           expectations
Engage with your

                                                                                                                                                                       Copyright © 2020 by Boston Consulting Group. All rights reserved. Updated 16 June 2020 Version 10.1.
                           Time horizon                                In & out with P/E2                                      5+ years
investors to
understand their
sentiment and how          Expected P/E multiple                       Relatively weak P/E, typically
3&4                          Example: U.S. services company used TSR lens to assess alternative strategic paths and
                             optimize capital allocation
                                                                                                 Alternative strategic paths

Challenge your                                                                   Major                  Organic growth +    Organic growth +
                                                        Initial              transformative             cost reduction +     cost reduction +
plan & sharpen                                      management plan
                                                                               acquisition                tuck-in M&A       financial strategy
capital allocation                                                                                                                 15.6
                                                                                                              13.9
                                                          10.4
Pressure-test share price    Estimated                                                7.4

                                                                                                                                                      Copyright © 2020 by Boston Consulting Group. All rights reserved. Updated 16 June 2020 Version 10.1.
and TSR potential of your    3-yr TSR (%)
crisis-adjusted plan and
evaluate alternative         Indexed share price          100                         89                      108                   114
strategic paths              TSR sustainability        Medium                        Low                      High             Low-medium
                             Risk                      Moderate                    Very high            Moderate-high        Low-moderate
Ensure your uses of
capital enable you to
emerge stronger from the
crisis                         Use shareholder value lens to chart optimal corporate strategy path

                               Align as a              Determine share price                Develop financial depiction    Choose optimal
                               leadership team on      and TSR potential of your            of alternative strategic       strategic path and
                               your strategic and      plan and pressure-test               paths and evaluate TSR         allocate capital
                               TSR ambitions           underlying assumptions               characteristics                accordingly

                                                                                                                                                 13
                            Source: BCG
5                         Weak-economy deals (if reflected in lower company valuations) outperform
                          strong-economy deals by an average of ~10 TSR points
                                                                                              Weak-economy
                                                                                                      deals
Explore bold
                                                                                                                                 106.4
portfolio moves                              Cumulative relative
                                                                                                                                                         106.1
                                             TSR index

                                                                                          100.4
                                                                                    100
Consider game-                                                                            100.2                                                               +9.6

                                                                                                                                                                                                Copyright © 2020 by Boston Consulting Group. All rights reserved. Updated 16 June 2020 Version 10.1.
changing acquisitions
and divestitures given                                                        T-3          T+3
                                                                                                    Strong-                       99.4
dynamic market                                                                                economy deals
conditions and                                                                                                                                            96.5
competitive landscape                                                                                                     Year 1

                                                                                                                                                               Year 2

                            Be prepared to pursue portfolio reshaping moves in today's environment

                             Evaluate portfolio for                Scan market for                    Evaluate optimal                    Prepare the Board for action in
                             potential divestiture                 potential targets or               deal structures                     advance if an attractive deal
                             opportunities                         consolidators                                                          unexpectedly comes available

                         Note: Strong-economy (weak-economy) years are those in which the respective global real GDP growth rate is in the top (bottom) third of all growth rates in the
                         observation period. Total of 9,987 M&A transactions with a public buyer comprises pending, partly completed, completed, unconditional and withdrawn majority      14
                         deals announced between 1980 and 2018 with a deal value greater than $250 million. Share price three days before the announcement date (T-3) equals 100. Share
                         performance from T-3 to three days after the announcement (T+3) equals the announcement effect.; Source: Revinitiv, Datastream, BCG
6                                       Embrace shareholder value
                                        philosophy and metrics

Create an
ownership culture
                                                                                                               Use TSR and TSI1
                                                                                Strategic &                    in strategic planning
                                                                               TSR ambition                    to measure & track
Align planning, KPIs, and                                                                                      shareholder value

                                                                                                                                                   Copyright © 2020 by Boston Consulting Group. All rights reserved. Updated 16 June 2020 Version 10.1.
incentives with delivering                                                                                     creation
sustained TSR and TSI1
success and winning in
                                        Compensate for
the new reality
                                        shareholder value
                                        creation

                                Adopt a strong shareholder value mindset and discipline

                                Put TSR front and        Train senior           Cascade        Set targets, pressure-   Incorporate TSR and
                                center, use TSR for      leaders on             capabilities   test plans and           TSI into reporting;
                                high-stakes decisions,   shareholder value      through the    initiatives, allocate    align & communicate
                                and embed TSI as a       principles and how     organization   resources, and track     incentives; reward
                                TSR accelerant           to lead like owners                   performance              TSR and TSI
                                                                                                                        performance

                                                                                                                                              15
                             1. Total societal impact
                             Source: BCG
Deliver value to your customers

Driving shareholder
value requires                                      Invest in your employees

                                                                                                          Copyright © 2020 by Boston Consulting Group. All rights reserved. Updated 16 June 2020 Version 10.1.
leadership teams to
address the needs of                                Work fairly and ethically with your suppliers
all key stakeholders—
now more than ever
                                                    Support the communities in which you work

                                                    Generate long-term value for your shareholders

Source: August 2019 Business Roundtable statement                                                    16
Guide for leaders

                                                       Copyright © 2020 by Boston Consulting Group. All rights reserved. Updated 16 June 2020 Version 10.1.
Shareholder value 'call to action'
Building a value protection and acceleration roadmap

Updated analyses and impact
Epidemic progression and virus monitoring
Economic and business impact
~3.6M reported recoveries so far;                                                                                                                                                                   EPIDEMIC PROGRESSION

  growth rate of daily new cases at ~1%1                                                                                                                                                              & VIRUS MONITORING

  As of 12 June 2020

                                                                                              Russia
                                                           UK                                                                                        29th May'20             05th June'20             12th June'20
                                                        France Italy
                        USA                             Spain                                 China                Japan

                                                                                         India                                                           101K                     118K                     125K

                                                                                                                                                                                                                             Copyright © 2020 by Boston Consulting Group. All rights reserved. Updated 16 June 2020 Version 10.1.
                                                                                                                                                        (∆0.9%)                  (∆2.2%)                  (∆0.9%)

                                                                                                                                                               # of daily new cases (growth rate%)1
                                         Brazil

                                                                         South
                                                                         Africa                                                                           37
                                                                                                                                                           8                       36
                                                                                                                                                                                   12                       39
                                                                                                                                                                                                            12
                                                                                                                                                         days                     days                     days

                                         Daily cases' growth (≥100 daily cases)1                                                                               # of days of case doubling2 globally
           Less than 100
                                                        5%
           daily cases1
                                                                                                                                                         2.5M                    3.0M5                     3.6M

       185                                 7.6M                    [∆1.8%]4               425k                    [∆1.1%]4
                                                                                                                                                          (42%)                   (45%)

                                                                                                                                                        Total # of recoveries (as % of confirmed cases)
                                                                                                                                                                                                           (47%)

Countries with cases3                     Confirmed cases globally                               Fatalities globally

  Note: Continued cases and fatalities are subject to different testing, propensity, reporting standards and hence are imperfect measures
  1. # of daily new cases calculated as 7-day rolling average; growth rate calculated basis 7-day average; 2. No. of doubling days calculated basis 7-day average growth rate of total cases; 3 Basis Johns Hopkins
  CSSE; 4. Daily growth rate basis 7-day average; 5. Updated numbers for 5th June as reported in updated data by Johns Hopkins CSSE                                                                                   18
  Sources: Johns Hopkins CSSE; Our world in data; BCG
Daily new cases are increasing globally;                                                                                                                                 EPIDEMIC PROGRESSION

propelled by South America, Asia, and Africa                                                                                                                             & VIRUS MONITORING

As of 12 June 2020
Several European and North American countries                                                                  ... but countries in South America, Asia, and Africa
continue to improve doubling rate…                                                                             witness an increase in daily new cases
 Flatten
                                          Daily growth rate of total cases (seven-day average)                         Daily cases (seven-day rolling average)

                                        6%                                                                       140,000
  Rates improving from top to bottom

                                                                                                                                                                                                      Copyright © 2020 by Boston Consulting Group. All rights reserved. Updated 16 June 2020 Version 10.1.
                                              Cases doubling:
                                                                  Argentina     S Africa
                                              14 days
                                        5%                                                                       120,000
                                                       Kenya
                                                                              Egypt Chile                        100,000
                                        4%    Cases doubling: Nigeria                         India   Brazil                                                                 South
                                              21 days                                    Mexico                                                                             America
                                                                                                                  80,000
                                                                              Colombia
                                        3%
                                                                                                                                                                                 Asia
                                                                                                                  60,000
                                                                  Ghana
                                        2%                                     Sweden                                                               North                    Africa
                                                                                                  Russia
                                                                                                                  40,000                           America
                                                                                     Iran
                                                                    Singapore                        US
                                        1%             Algeria               Canada         Germany
                                                                                 France
                                                                                        UK                        20,000
                                                        S Korea    Austria                                                                         Europe
                                                                                           Italy
                                                   Australia         Japan China                 Spain
                                        0%                                                                            0
      Fight                              1,000             10,000               100,000          1,000,000                       Mar                Apr                  May            12 June
                                               Cumulative number of confirmed cases (log scale)
                                       South America     Asia1      Africa       North America        Europe               South America   Asia1      Africa     North America          Europe

1. Includes Middle East & Oceania
Source: Johns Hopkins CSSE; Our World in data; BCG                                                                                                                                               19
EPIDEMIC PROGRESSION
Epidemic progression snapshot                                                                                                                                                                                                  & VIRUS MONITORING

As of 12 June 2020                                                                                                                                    Data shown only for G20 countries with 100+ daily new cases

                                                     Daily cases                                                         Cumulative cases                                                                       Testing
                          Growth of daily new cases1                          Daily Cases/M                      Total cases                    Recovery                                                        Test/ case
                                                                               New cases per                     In thousands                 % of total cases                         current value3                               \
                                                                                                                                                                                                                                         2 weeks ago
                                                                              million population2                                                                         0                     10                                      20           30
   Argentina                                                   8.5%                              26                    27                                   30%                             8           \

                                                                                                                                                                                                                                                                             Copyright © 2020 by Boston Consulting Group. All rights reserved. Updated 16 June 2020 Version 10.1.
           KSA                                                 8.4%                              94                   116                                   68%                             9           \

   Indonesia                                              6.1%                                     3                   35                                   36%                                 \
                                                                                                                                                                                                        9

      S Africa                                       4.1%                                        43                    59                                   57%                                                            18                         \

       Mexico                                    2.2%                                            31                   134                                   72%                3        \

          India                                 2.2%                                               7                  298                                   49%                                                            18                     \

         Brazil                              0.9%                                               126                   803                                   54%            2       \

       Turkey                               0.4%                                                 11                   174                                   85%                                                  \
                                                                                                                                                                                                                          14

           USA                     0.0%                                                          65                  2,023                                  27%                                         \
                                                                                                                                                                                                                     11

       Russia                     -0.2%                                                          60                   502                                   53%                                                                                           \
                                                                                                                                                                                                                                                                   28

           Italy                -1.0%                                                              5                  236                                   73%                                                            \
                                                                                                                                                                                                                                         19

       France                   -1.1%                                                              7                  156                                   38%                                     \
                                                                                                                                                                                                        9

    Germany                  -2.2%                                                                 4                  186                                   92%                                                                               \
                                                                                                                                                                                                                                                              25

           UK4            -3.5%                                                                  21                   291                                                                                   \
                                                                                                                                                                                                                      13

      Canada            -4.4%                                                                    14                    98                                   59%                                                                 \
                                                                                                                                                                                                                                           21

1. Growth rate calculated basis 7-day rolling average of new cases; 2. 7-day rolling average; represented scale rounds up daily case/m to next 10th place; 3. Test/case data is not updated daily for few countries,                                                    20
data represented is within last 1 week; 4 UK recovery data not available; Source: Our World in Data, John Hopkins, Worldometers, BCG
Vaccine fast movers | 9 vaccine candidates already into clinical trials                                                                                                     EPIDEMIC PROGRESSION
                                                                                                                                                                            & VIRUS MONITORING

As of 12 June 2020

   1                                                          4      Phase I/II
                                                                                                                                                         151
           Phase II/III
   Oxford Univ. & AstraZeneca                                 BioNTech & Pfizer                               China National Biotec1                                   Pre-clinical

    Phase III recruitment underway;                           Phase I/II started April 2020; data             Phase II trial in June 2020;

                                                                                                                                                                                                   Copyright © 2020 by Boston Consulting Group. All rights reserved. Updated 16 June 2020 Version 10.1.
    planned supply build-up of 400M+                          exp. in July 2020; if approved,                 expected completion of
    doses by end of year (if approved)                        distribution possible by Dec 2020               final trials by Nov 2021

                                                              Novavax                                         Sinovac                                    160            Total
   2       Phase II                                           Phase I/II started in May 2020;
                                                              data expected in July 2020 and
                                                                                                              Phase II trial in June 2020;
                                                                                                              expected completion by
   CanSino Biologics                                          final completion by Nov 2021                    Aug 2020

    Phase II advancement since                                                                                                                          "By the beginning of 2021, we hope
                                                                                                                                                        to have a couple of hundred million
                                                              2
    Apr 2020; follow-up expected
    by Oct 2020                                                                                                                                         doses. I'm cautiously optimistic with
                                                                     Phase I
                                                                                                                                                        the multiple candidates we have
   Moderna                                                    Chinese AMS2                                   Inovio                                     with different platforms."

    FDA fast track designation in May                         Trial started in Mar 2020;                     Phase I initial data expected              Dr. Anthony Fauci, Member, White House
    2020; Phase III on 30,000 patients                        follow-up expected by Dec 2020                 June 2020; Phase II/III trials             Coronavirus Task Force
    planned in July 2020                                      and completion by Apr 2021                     start July/August 2020

1. Listed as two candidates by WHO: Beijing institute of Biological Products / Sinopharm & Wuhan Institute of Biological
Products / Sinopharm; 2. Chinese Academy of Medical Sciences and Institute of Medical Biology. Source: WHO (June 9th),         Update in last 2 weeks                                      21
Citeline Pharma Project (June 5th), Milken Institute (June 2nd), ClinicalTrials.gov (May 19th), Telegraph, Bloomberg, BCG
Economic forecasts point toward severe downturn in 2020;                                                                                                                                                ECONOMIC &
rebound of global GDP not expected before 2021                                                                                                                                                          BUSINESS IMPACT

As of 12 June 2020

 GDP growth forecast vs. baseline                                                                                                                                                 GDP level forecast1
                                                                                                                                                                                  EOY 2021 vs. EOY 2019
                      2020                                                                       2021
                      -10% -8% -6% -4% -2% 0%               2%    4%     6%    8% 10%           -10% -8% -6% -4% -2% 0%                2%    4%     6%    8% 10%
                           Forecast -6.1%            Baseline 1.8%                                                                   1.7% 4.0%
US                                                                                                                                                                                             97-100%

                                                                                                                                                                                                                              Copyright © 2020 by Boston Consulting Group. All rights reserved. Updated 16 June 2020 Version 10.1.
                                 Forecast range

                         -9.1%                          1.0%                                                                       1.3%      4.5%
Europe                                                                                                                                                                                          96-99%

                                                        1.0%           5.9%                                                                       5.8% 6.9%
China                                                                                                                                                                                         107-112%

                                  -6.1%                0.7%                                                                     0.6% 2.5%
Japan                                                                                                                                                                                           96-99%

                                           -3.2%                       5.8%                                                               3.1%     6.1%
India2                                                                                                                                                                                        101-108%
                                                                                                                                                                            Last week's forecast range (only
                            Forecast World Bank (Jun 2020)           Baseline World Bank (Jan 2020)                      Forecast range Banks3 + IMF
                                                                                                                                                                            shown if change is significant)
Note: As of reports dated 31 March 2020 to 12 June 2020, YoY forecasts 1. Range calculated with 25th & 75th percentile values of forecast range 2. For India, forecast is for financial year; for other countries, the
forecast is for calendar year; 3. Range from forecasts (where available) of World Bank, International Monetary Fund (April 2020), Goldman Sachs, JP Morgan Chase; Morgan Stanley; Bank of America; Fitch
Solutions; Credit Suisse; Danske Bank; ING Group; HSBC; Source: Bloomberg; World Bank; IMF; BCG                                                                                                                          22
Despite rebound in the recent past, no sector at pre-crisis TSR levels                                                                                                                             ECONOMIC &
                                                                                                                                                                                                   BUSINESS IMPACT

As of 12 June 2020                                                                                                                                                                        Based on top S&P
                                                                                                                                                                                        Global 1200 companies
Categories based on TSR & net debt/enterprise value2
                                                                                         TSR performance3                                              Companies with probability of default >15%4
                                                                          21 Feb 2020            21 Feb 2020        29 May 2020                                                                         29 May 2020
                                                                                                                                                              21 Feb 2020           12 June 2020
                                                                         - 20 Mar 2020         - 12 June 2020      - 12 June 2020                                                                      - 12 June 2020
                                         Pharma                               -20%                    -2%                                                          0%                     11%
                                         Semiconductors                       -30%                    -3%                                                          0%                      0%
 Healthier sectors                       Household Products                   -16%                    -4%                                                          0%                      0%

                                                                                                                                                                                                                         Copyright © 2020 by Boston Consulting Group. All rights reserved. Updated 16 June 2020 Version 10.1.
                                         Tech Hardware                        -26%                    -5%                                                          0%                      0%
                                         Food/staples Retail                  -10%                    -7%                                                          0%                      0%
                                         Software                             -30%                    -8%                                                          9%                      8%
                                         Health Equipment                     -31%                    -9%                                                          0%                      0%
                                         Retailing                            -40%                   -10%                                                          0%                     41%
                                         Telecom                              -17%                   -10%                                                          0%                      8%
                                         Materials                            -32%                   -10%                                                          4%                     11%
 Pressured sectors                       Food & Beverage                      -23%                   -10%                                                          0%                      0%
                                         Prof. Services                       -30%                   -12%                                                          0%                      0%
                                         Transport                            -34%                   -13%                                                          0%                     36%
                                         Financials                           -35%                   -14%                                                          0%                      0%
                                         Media                                -36%                   -14%                                                          0%                      8%
                                         Utilities                            -30%                   -15%                                                          0%                      0%
                                         Auto                                 -41%                   -15%                                                          0%                     29%
                                         Capital Goods                        -35%                   -15%                                                          2%                      7%
                                         Durable Goods                        -39%                   -18%                                                          0%                      0%

 Vulnerable sectors                      Insurance                            -39%                   -22%                                                          0%                      0%
                                         Real Estate                          -39%                   -24%                                                          0%                     17%
                                         Banks                                -39%                   -26%                                                          0%                      4%
                                         Hospitality                          -44%                   -27%                                                          7%                     36%
                                         Energy                               -52%                   -29%                                                          0%                     21%

                                                                                                                                                                                          Pos. trend >= 2%
Note: Based on top S&P Global 1200 companies; Sectors are based on GICS definitions; 1. TSR performance on 12 June 2020 compared to 29 May 2020; 2. Net debt & enterprise
value from latest available balance sheet; Categories defined based on comparison with S&P Global 1200 median: healthy = TSR & debt/EV > median, pressured = TSR or debt/EV               No sig. change
< median, vulnerable = TSR & debt/EV < median; 3. Performance is tracked for two periods, first from 21 February 2020 (before international acceleration of outbreak) to 20 March         Neg. trend >= 2%          23
2020 (trough of the market) and from 21 February 2020 through 12 June 2020 based on median; 4. Implied by 5-year Credit Default Swap based on median Source: S&P Capital IQ;
BCG ValueScience® Center; BCG
US investors' current perspectives on economic and                                                                                              ECONOMIC &
stock market impact of COVID-19 crisis                                                                                                          BUSINESS IMPACT

As of 07 June 2020

US example: Investor Pulse Check on US economy and stock market

Economic impact and recovery                                               Impact on stock markets

                                                                                                                                                                  Copyright © 2020 by Boston Consulting Group. All rights reserved. Updated 16 June 2020 Version 10.1.
       End of            Investor's expected timeline                                                Investors that are bearish or neutral, respectively,
         Q4              for the severe impact of crisis                       52% | 25%             for the remainder of 2020
        2020             to extend until

                                                                                                     Investors that are bullish for 2021 and 2022,
                                                                               41% | 55%             respectively
                         Investors anticipate a rapid
         Only            V-shaped recovery to the pre-
       18%               crisis economic level and
                                                                                                     Investors that are more bullish on the economy &
                         growth rate                                           64% | 53%             the stock market, respectively vs. one month ago

                         Investors' expectation2 for                          S&P500                                  S&P500      Expected future high, to
                         the amount of total fiscal                           down by    Expected future low, to       up by
     ~3.9T               stimulus needed to support                                      be reached by Q3 2020
                                                                                                                                  be reached by Q2 2023
                         the economy                                          16%1                                    16%1        (exp. annual TSR of 8%)

1. Compared to 7 June 2020 prices; 2. Average expectations of investors;                                                                                     24
Source: BCG's COVID-19 Investor Pulse Check, June 7, 2020; n = 150.
European investors' current perspectives on European Growth Tech                                                                                                                           ECONOMIC &
                                                                                                                                                                                           BUSINESS IMPACT

As of 27 May 2020

Europe example: Investor Pulse Check for European 'Growth Tech' (large, tech-oriented startups)

Investment volume                                                        Investment criteria                                                      Growth Tech industries

  Growth Tech investors are bearish on                                     Growth Tech investors expect shift in                                     Potential to outperform larger rivals; but

                                                                                                                                                                                                              Copyright © 2020 by Boston Consulting Group. All rights reserved. Updated 16 June 2020 Version 10.1.
  2020…                                                                    investment criteria to resilience factors…                                different recovery shapes across industries

                                                                                             of investors attach greater                                                   expect Software/services to
                   will delay deals originally
    87%            planned for 2020
                                                                              55%            importance to time to                                      V        61%       rebound quickly
                                                                                             profitability

                                                                                                                                                                           expect Travel to recover,
                   will invest less in 2020 than
                                                                                             of investors re-prioritize the                             U 100%             but slowly
    66%            in record year 2019
                                                                              50%            importance of management
                                                                                             team's quality
                                                                                                                                                       V                   expect Digital Health to
                                                                                                                                                           or
  …but very bullish on 2022                                                …as significant uncertainty prevails                                       U         85%        return to pre-COVID
                                                                                                                                                                           trajectory1.2
                   expect to invest as much or                                 For           Growth Tech investors,                                     V
    98%            more in 2022 than in record                                 3/5           market uncertainty affects                                U    or
                                                                                                                                                                 67%
                                                                                                                                                                           expect EduTech to return
                                                                                                                                                                           to pre-COVID trajectory1,3
                   year 2019                                                                 investment behavior

1. Potential contingency: If structural barriers could be alleviated, accelerated growth could be sustained 2. 55% inverted V, 30% inverted U 3. 50% inverted V, 17% inverted U                          25
Source: BCG Growth Tech Investor Pulse Check (n = 70), run in 28 April 2020 to 27 May 2020
Investors want discretionary dollars focused on 'financial health' to                                                                                                                                 ECONOMIC &
                                                                                                                                                                                                      BUSINESS IMPACT
survive the crisis; 'growth & competitive position' to win the new reality
As of 07 June 2020

US example: Priority areas, management should focus on their investments1
(% of investors who listed the below areas as a top 3 priority)

                                Flatten                                                                                                  Fight & Future

                                                                                                                                                                                                                         Copyright © 2020 by Boston Consulting Group. All rights reserved. Updated 16 June 2020 Version 10.1.
           Financial health                                   43%                        Growth & competitive position                                                                                        44%
         Health and safety                                19%                                                              Tech                                                                         22%
    Business continuity /                      10%                                                                   Efficiency                                                                        22%
              flexibility /
       risk management                                                                                  Portfolio reshaping                                                                      20%
                                                                                                                   Employees                                                     14%
                                                                                         Return of cash to shareholders                                                    12%
                                                                                      R&D / new product development                                                 10%
                                                                                                                          ESG2                                8%
                                                                                        Transparency / communication                                    7%
                                                                                                                  Re-opening                           6%

Notes: 1.Original question "For financially healthy companies (that you invest in or follow), what are the top 3 priority areas (please list in order of importance) that you would like to see management teams
focus their discretionary investment dollars on during the next 6-12 months?"; Raw responses to the survey were classified into categories. "Other" not included (n=1); 2. Environment Social Governance;           26
Source: BCG's COVID-19 Investor Pulse Check, June 7, 2020; n = 150 overall survey, n=138 for this optional question, though number of priority areas outlined by respondents slightly differed.
Additional perspectives on COVID-19

       COVID-19 BCG Perspectives                                                     Selected publications

                                                                                                                                                                    Copyright © 2020 by Boston Consulting Group. All rights reserved. Updated 16 June 2020 Version 10.1.
  Edition #9                 Edition #8                  Edition #7               Corporate finance        Corporate finance          Corporate finance
  Future of Global Trade     Galvanizing nations for     Sensing Consumer         Managing Corporate       The COVID-19 Investor      The COVID-19 CFO
  and Supply Chains          the new reality             Behavior & seizing       Venturing Through the    Pulse Check Series         Pulse Check
                                                         Demand Shifts            Pandemic

  Edition #6                 Edition #5                  Edition #4               M&A and Divestitures     M&A and Divestitures       M&A and Divestitures
  Restructuring Costs, and   Revamping                   Accelerating Digital &   The Asia-Pacific M&A     Navigating Merger          COVID-19’s Impact on
  managing Cash and          Organizations for the       Technology               Report: Dealmaking in    Clearance During           Global M&A
  Liquidity                  New Reality                 Transformation           Turbulent Times          the Crisis

  Edition #3                 Edition #2                  Edition #1               Transformation           Banking                    Energy
  Emerging stronger from     Preparing for the restart   Facts, scenarios, and    How CEOs Can Win the     What’s Next for US         How Uncertainty Is Hitting
  the Crisis                                             actions for leaders      Fight and Transform to   Banking Consolidation in   M&A in Oil and Gas
                                                                                  Win the Future           the Post-COVID-19 World?

Source: BCG                                                                                                                                                    27
The services and materials provided by Boston Consulting Group (BCG) are subject to BCG's Standard Terms
             (a copy of which is available upon request) or such other agreement as may have been previously executed by BCG.
             BCG does not provide legal, accounting, or tax advice. The Client is responsible for obtaining independent advice concerning
             these matters. This advice may affect the guidance given by BCG. Further, BCG has made no undertaking
             to update these materials after the date hereof, notwithstanding that such information may become outdated
             or inaccurate.

             The materials contained in this presentation are designed for the sole use by the board of directors or senior management of
             the Client and solely for the limited purposes described in the presentation. The materials shall not be copied or given to any
             person or entity other than the Client (“Third Party”) without the prior written consent of BCG. These materials serve only as

                                                                                                                                                    Copyright © 2020 by Boston Consulting Group. All rights reserved. Updated 16 June 2020 Version 10.1.
             the focus for discussion; they are incomplete without the accompanying oral commentary and may not be relied on as a
             stand-alone document. Further, Third Parties may not, and it is unreasonable for any Third Party to, rely on these materials
             for any purpose whatsoever. To the fullest extent permitted by law (and except to the extent otherwise agreed in a signed

Disclaimer
             writing by BCG), BCG shall have no liability whatsoever to any Third Party, and any Third Party hereby waives any rights and
             claims it may have at any time against BCG with regard to the services, this presentation, or other materials, including the
             accuracy or completeness thereof. Receipt and review of this document shall be deemed agreement with and consideration
             for the foregoing.

             BCG does not provide fairness opinions or valuations of market transactions, and these materials should not be relied on or
             construed as such. Further, the financial evaluations, projected market and financial information, and conclusions contained
             in these materials are based upon standard valuation methodologies, are not definitive forecasts, and are not guaranteed by
             BCG. BCG has used public and/or confidential data and assumptions provided to BCG by the Client. BCG has not
             independently verified the data and assumptions used in these analyses. Changes in the underlying data or operating
             assumptions will clearly impact the analyses and conclusions.

             The situation surrounding COVID-19 is dynamic and rapidly evolving, on a daily basis. Although we have taken great care
             prior to producing this presentation, it represents BCG’s view at a particular point in time. This presentation is not intended
             to: (i) constitute medical or safety advice, nor be a substitute for the same; nor (ii) be seen as a formal endorsement or
             recommendation of a particular response. As such you are advised to make your own assessment as to the appropriate
             course of action to take, using this presentation as guidance. Please carefully consider local laws and guidance in your area,
             particularly the most recent advice issued by your local (and national) health authorities, before making any decision.

                                                                                                                                               28
29
         BCGRapidResponseNetwork@bcg.com
                                           Contact

Copyright © 2020 by Boston Consulting Group. All rights reserved. Updated 16 June 2020 Version 10.1.
You can also read