Return on Capital Employed - Review of 2019 Returns - Armillary Private Capital

Page created by Johnnie Ortega
 
CONTINUE READING
Return on Capital Employed - Review of 2019 Returns - Armillary Private Capital
Return on Capital
Employed
Review of 2019 Returns
Armillary Private Capital   Return on Capital Employed – Review of 2019 Returns                                                                                                                        2

                                                                                  Contents
                                                                                  Foreword .......................................................................................................... 3
                                                                                  Executive Summary ........................................................................................ 4
                                                                                  Top Performers ................................................................................................. 5
                                                                                  Market .............................................................................................................. 6
                                                                                  Listed Companies – Performance by Sector ............................................... 7
                                                                                  International Comparisons ............................................................................. 8
                                                                                  Crown Entities .................................................................................................. 9
                                                                                  Distribution of Results ..................................................................................... 10
                                                                                  Spotlight: Transport & Logistics ..................................................................... 11
                                                                                  Individual Entities ............................................................................................15
                                                                                  About Armillary Private Capital ....................................................................19
                                                                                  Sources of Data ............................................................................................. 20
                                                                                  Appendix 1 – Detailed Results ..................................................................... 21
                                                                                  Appendix 2 – ROCE explained .................................................................... 29

                                                                                  Disclaimer

                                                                                  The information contained in this report has been prepared by Armillary Private Capital
                                                                                  (‘Armillary’). While the intention is to provide accurate information based on historical performance
                                                                                  and market information, Armillary accepts no liability for any errors or inaccuracies in this report.
                                                                                  The reader is advised to perform their own research to confirm the accuracy of the information
                                                                                  contained in this report before relying on it for any investment decision making. This report has been
                                                                                  prepared as a ‘class service’ as defined by the Financial Advisers Act and is general in nature.
Armillary Private Capital   Return on Capital Employed – Review of 2019 Returns                                                                             3

Foreword
We are delighted to present the tenth Armillary Private Capital Return on         (but not limited to) gains/losses on asset sales, revaluations, and
Capital Employed (‘ROCE’) report. This year the total number of entities          unrealised gains. Previous years’ reports were compiled using the CapIQ
in our data set of NZX, USX, and selected Crown entities is 142.                  data base, and so prior year results may differ slightly to previously
                                                                                  published results.
The ROCE methodology we use in this report was developed by Du
Pont Corporation and is therefore not proprietary to us, although we              We continue to advocate the ROCE methodology in our work with
are proponents. As it is simple to apply, anyone who understands the              businesses as a simple to use and easily understood tool for measuring
methodology can use it. We regularly use this methodology as a tool in            business performance, identifying improvement strategies, creating
our client engagements and in our financial training curriculum.                  incentive remuneration programs, and for testing budgets and
                                                                                  forecasts, especially those applied in valuations. We also see the data
A benefit of the ROCE methodology is that the performance of an
                                                                                  and results in this report as providing useful benchmarks for business
entity can be broken down into its components of Profitability and
                                                                                  performance in the New Zealand market.
Activity, for deeper analysis. Profitability, as measured by EBIT margin,
provides an indication of operational efficiency; Activity, as measured           We trust that the insights contained in this report provide value to
by asset turnover, provides an indication of balance-sheet efficiency.            investors, business owners and managers alike.
Combined the two ratios give overall ROCE. A full explanation is
provided in Appendix 2.

Again, this year’s report includes an overview of the major sectors in the
economy to demonstrate the effect that differences in business models
have on profitability, activity and overall ROCE performance.

Analysis has primarily been conducted using the Pitchbook financial
platform and where data was not available, information was entered
from annual reports. EBIT has been calculated on a normalised basis,
adjusting for non-recurring items and non-trading items, including
Armillary Private Capital      Return on Capital Employed – Review of 2019 Returns                                                                                            4

Executive Summary
                                                                                                                  Median ROCE (NZX, USX & Crown)

                                                                                                         10%
                                                                                                         9%       8.62 %

                                                                                                         8%
                                                                                                                                                               6.92%
                                                                                                         7%                             6.58%

This year’s ROCE review of the 2019 financial results included 114                                       6%

                                                                                                  ROCE
companies with primary listings on the NZX, 14 companies from                                            5%
                                                                                                         4%
USX, and 14 Crown Entities. This has resulted in a total sample size
                                                                                                         3%
of 142 Crown and Listed (“NZX and USX”) firms which is 2 less than
                                                                                                         2%
last years’ report.
                                                                                                         1%
Companies have been categorised by eight sectors: Business Products                                      0%
                                                                                                                   2017                  2018                  2019
and Services (B2B), Consumer Products and Services (B2C), Energy (incl.
Utilities), Financial Services (incl. Investments), Property, Healthcare,
Information Technology and Materials and Resources.
                                                                                                • The top 10 performers in 2019 were primarily from the Consumer
The median 2019 ROCE performance across all Listed and Crown                                      Products and Services and Business Products and Services sectors,
entities has increased to 6.92% from 6.58% in 2018 1. This result remains                         comprising 7 of the 10 top performers. Consumer Products and
shy of common estimates for the market average weighted cost of                                   Services was the best performing sector (median ROCE of 11.9%)
capital (WACC) of around 8%.                                                                      whilst the Healthcare sector recorded the lowest median ROCE of
                                                                                                  0.9%. In large part this reflects the sector including several retirement
• Zespri Group, listed on the USX, was the top performer with a ROCE
                                                                                                  village operators and the way normalised EBIT is calculated, which
  of 234%. This result was due to an improvement in profit margins while
                                                                                                  excludes fair value gain on properties.
  also maintaining high Activity. Of all listed firms analysed, Zespri Group
  strikes the best combination of high Activity and high margins and is                         • The median ROCE of NZX50 constituent companies was 7.5%,
  consistently a top performer in our analysis.                                                   remaining well behind the median for companies in the S&P500
                                                                                                  (15.4%), the ASX200 (13.6%), and the S&P EURO 350 (12.6%).

                                                                                                • For the Crown Entities the 2019 median ROCE was 5.0% (down from
                                                                                                  8.8% in 2018), with AsureQuality recording the best performance in
1   Please note that we have changed data providers and historic results may well differ from
    previously published results.                                                                 that group with a ROCE of 33.4%.
Armillary Private Capital                                    Return on Capital Employed – Review of 2019 Returns                                                                                                                                                  5

       Top Performers                                                                                                                                                                         The top 10 entities by 2019 ROCE performance are dominated by
                                                                                                                                                                                              businesses that optimise high levels of Activity (Revenue/ Average Net
                                                                                                                                                                                              Operating Assets) and high profitability (EBIT (norm.)/Revenue).

                                                                                                                                                                                              The top performer was Zespri Group, which had a ROCE of 234%
                                                                       Top 10 ROCE 2019                                                                                                       made up of an 8.1% Profitability Ratio (up from 5.8% in 2018 and 4.5%
                                                                                                                                                                                              in 2017) and a 28.9 × Activity Ratio (up from 24.0 × in 2018). This was
                                                                              2017                          2018                     2019
                                                                                                                                                                                              also the highest Activity Ratio of our sample. The a2 Milk Company
                                                                                                                                                                                              and Hallenstein Glasson both recorded strong ROCE results in 2019 with
       240%
                                                                                                                                                                                              156.4% and 71.6%, respectively – albeit that both of these were slightly
                                                                                                                                                                                              below their respective 2018 ROCE results.
       200%

                                                                                                                                                                                              Both Briscoe Group and Fisher & Paykel Healthcare feature again in
       160%                                                                                                                                                                                   the top ten with ROCE of 44.6% and 40.7% respectively. QEX Logistics
                                                                                                                                                                                              returns for the third year in a row while AsureQuality, Syft Technology,
ROCE

       120%                                                                                                                                                                                   NZX and Plexure are all newcomers to the top 10 with Plexure improving
                                                                                                                                                                                              performance from negative ROCE in each of the last 2 years to a
        80%                                                                                                                                                                                   positive 30.9% in 2019.

        40%                                                                                                                                                                                   The top three ROCE performers in 2019 for each of the three markets
                                                                                                                                                                                              analysed were as follows:
         0%
                                                                                                                                                                                              • NZX market: The a2 Milk Company (156.4%), Hallenstein Glasson
               Zespri

                        The a2 Milk Company

                                              Hallenstein Glasson

                                                                                                                      AsureQuality
                                                                         Briscoe Group

                                                                                         Fisher & Paykel Healthcare

                                                                                                                                            Syft Technology

                                                                                                                                                              NZX

                                                                                                                                                                    QEX Logistics

                                                                                                                                                                                    Plexure

                                                                                                                                                                                                (71.6%) and Briscoe Group (44.6%).

                                                                                                                                                                                              • USX market: Zespri Group (234.0%), Syft Technologies (33.0%) and
                                                                                                                                                                                                Pharmazen (18.8%).

                                                                                                                                                                                              • Crown Entities: AssureQuality (33.4%), Airways Corporation (17.0%)
                                                                                                                                                                                                and Meteorological Service (16.2%).
Armillary Private Capital     Return on Capital Employed – Review of 2019 Returns                                                                     6

Market                                                                                                         Median Annual ROCE by Market
                                                                                                                       2017     2018   2019

                                                                                                   12%

The median result for USX companies improved markedly compared to
                                                                                                   10%
the previous two years with a 10.6% median ROCE for 2019 up from 3.9%
in 2018. With a small sample size of 14, even medians of this segment
                                                                                                   8%
are prone to be skewed by outliers and Windflow Technology 2, Martin
Aircraft 3 and Sports & Education4 were not included in the 2019 sample.

                                                                                            ROCE
                                                                                                   6%
Three newcomers to the market include Palliser Estate, TMP and Future
Mobility Solutions which all posted negative ROCE in 2019.
                                                                                                   4%

The NZX companies posted a median ROCE of 7.2%, being a 0.7%
           5

increase from 2018. 93 companies (81.6% of the NZX listed companies)                               2%

recorded positive ROCE (21 companies recorded negative ROCE),
which is in line with 2018 results.                                                                0%
                                                                                                         USX                   NZX            Crown

The Crown entities fell from an 8.8% ROCE in 2018 to 5.0% in 2019. This                                                       Market
decline firmly places the median ROCE for Crown entities as the lowest
of all New Zealand cohorts, contrasting its performance in 2018 as the
best performing cohort. Five companies posted improved ROCE in
2019, whilst the remaining 9 all declined, and three companies posted
negative ROCE in 2019 compared to only one in 2018.

2   Liquidated in December 2019.
3   Not able to calculate. Adjusted net tangible assets are nil.
4   Annual report 2019 not filed.
5   The NZAX market was closed in 2019. Companies previously listed on the NZAX have been
    included in the NZX market.
Armillary Private Capital                          Return on Capital Employed – Review of 2019 Returns                                                                                                                                                      7

   Listed Companies – Performance by Sector

                                 Sector Performance, 2019 Median ROCE                                                                                                                The outcome of different business models and market conditions can
                                                                                                                                                                                     be examined by comparing the median performance of companies
                                                           ROCE                 Profitability         Activity
                                                                                                                                                                                     in different sectors. For this analysis, we have used the 2019 median
                                                                                                                                                                                     profitability, activity, and ROCE performance of each sector for all Listed
       14%                                                                                                                                        180%
                                                                                                                                                                                     and Crown companies.
                                                                                                                                                  160%
       12%
                                                                                                                                                                                     The top three performing sectors based on 2019 ROCE are Consumer
                                                                                                                                                  140%
                                                                                                                                                                                     Products and Services, Materials and Resources and Business Products
       10%

                                                                                                                                                         Profitability & Activitiy
                                                                                                                                                  120%                               and Services (11.9%, 9.0% and 8.9%, respectively).
       8%                                                                                                                                         100%                               The Property sector exhibits a high Profitability Ratio (49.9%) but has
ROCE

                                                                                                                                                  80%
                                                                                                                                                                                     its ROCE dragged down by a low Activity Ratio due to the capital-
       6%
                                                                                                                                                                                     intensive nature of the sectors.
                                                                                                                                                  60%
       4%
                                                                                                                                                                                     Conversely, the Information Technology sector shows high levels of
                                                                                                                                                  40%
                                                                                                                                                                                     Activity (1.18 ×) yet has similar median ROCEs as a result of lower median
       2%
                                                                                                                                                  20%                                Profitability Ratios (2.5%).

       0%                                                                                                                                         0%
                                                                                                                                                                                     Although it has one of the best performing stocks (Fisher & Paykel
             Consumer Products
                  and Services

                                 Materials and
                                    Resources

                                                 Business Products
                                                      and Services

                                                                     Energy (incl.
                                                                         Utilities)

                                                                                      Property

                                                                                                 Information
                                                                                                 Technology

                                                                                                               Financial Services
                                                                                                               (incl. Investments)

                                                                                                                                     Healthcare

                                                                                                                                                                                     Healthcare), the worst performing sector was the Health Care sector at
                                                                                                                                                                                     ROCE of 0.9%. This sector has median profitability of 2.3% and a median
                                                                                                                                                                                     Activity Ratio of 0.54 ×. As noted previously, this is impacted by the way
                                                                                                                                                                                     our data provider normalises reported profit numbers for the Retirement
                                                                                                                                                                                     sector (to exclude fair value gains on properties) but also because there
                                                                                                                                                                                     are several smaller, early stage companies in this sector.
Armillary Private Capital   Return on Capital Employed – Review of 2019 Returns                                                                            8

International
                                                                                                         Median International ROCE
                                                                                                               2017   2018   2019

Comparisons                                                                              18%

                                                                                         16%

                                                                                         14%

To benchmark New Zealand’s performance, we have also reviewed                            12%

the performance of companies in the European, Australian and US                          10%

                                                                                  ROCE
markets, as represented by the S&P/EURO 350, S&P/ASX 200 and the
                                                                                         8%
S&P500 index, respectively. For comparability, we have isolated the
performance of the NZX50 index constituents from that of the entire                      6%

group of NZX main board listed entities. Note that the average cost of                   4%
capital in the comparison markets will vary from that of New Zealand.
                                                                                         2%
There are a number of factors as to why this would be the case, for
example, sector composition (less exposure to regulated utilities in                     0%
                                                                                               S&P 500    S&P/ASX     S&P/EURO       NZX50         NZX
overseas markets compared to New Zealand), market risk premium and                                          200          350
government bond rates varying between markets analysed.

The NZX50 index group of companies once again had a higher median                 The ASX S&P200 index is recognised as the institutional investable
performance than the overall NZX main board in 2019. The NZX50                    benchmark in Australia. The index covers approximately 80% of the
companies represent more than 90% of the NZ listed equity market                  equity market capitalisation in Australia. Median ROCE performance
capitalisation. The NZX50 recorded an increase of 0.5% on 2018 to finish          declined in 2019 to 13.6% (14.1% in 2018). Nevertheless, this is still
the year with a 7.5% median ROCE (7.0% in 2018). The NZX main board               noticably higher than that of NZX companies and marginally higher
experienced a 0.7% increase on 2018, recording a median ROCE of                   than returns in Europe.
7.2% (6.5% in 2018). This is the only market from our sample that showed
                                                                                  The USA S&P500 index captures approximately 80% of the total US
improved ROCE in 2019 compared to 2018 results.
                                                                                  listed equity market capitalisation. The companies in this index have
The S&P/EURO 350 index covers 350 blue-chip stocks from 16 developed              consistently produced a significantly higher ROCE than the other
European countries. This index outperformed both the NZX and NZX50 in             markets examined. In line with previous years the S&P500 returned a
2019 with a median ROCE of 12.6% (13.7% in 2018).                                 median ROCE of 15.4% in 2019 (17.0% in 2018).
Armillary Private Capital   Return on Capital Employed – Review of 2019 Returns                                                                                                                                                                                                                                                                                                                                                         9

Crown Entities
                                                                                                                                                                                                           Crown Entities
                                                                                                                                                                                                           2017                             2018                                                               2019

                                                                                         35%

                                                                                         30%
The overall performance of the 14 Crown Entities analysed declined
again in 2019 with the median ROCE down 3.3% to finish at 5.0%, posting                  25%

the lowest return from all markets analysed.
                                                                                         20%

Compared to the listed companies, the notable feature of the Crown

                                                                                  ROCE
                                                                                         15%
Entities is a tighter range of returns with the highest at just over 33% and
the lowest at (2.5%). Three of the fourteen firms analysed reported a
                                                                                         10%
negative ROCE compared to only one in 2018 and only five companies
recorded improved ROCE from 2018 (AsureQuality, Meteorological                            5%
Service, KiwiRail, Geological and Nuclear Sciences and AgResearch).
                                                                                          0%
The Institute of Environmental Sciences recorded the largest ROCE
                                                                                         (5%)
decline in 2019 following strong performance in 2017 and 2018.

                                                                                                AsureQuality

                                                                                                               Airways Corporation

                                                                                                                                     Meteorological Service

                                                                                                                                                              Transpower New Zealand

                                                                                                                                                                                       Water and Atmospheric Research

                                                                                                                                                                                                                        KiwiRail Holdings

                                                                                                                                                                                                                                            New Zealand Forest Research

                                                                                                                                                                                                                                                                          Institute of Environmental Science

                                                                                                                                                                                                                                                                                                                  Geological and Nuclear Sciences

                                                                                                                                                                                                                                                                                                                                                    AgResearch

                                                                                                                                                                                                                                                                                                                                                                 Kordia Group

                                                                                                                                                                                                                                                                                                                                                                                Landcorp Farming

                                                                                                                                                                                                                                                                                                                                                                                                   Plant & Food Research

                                                                                                                                                                                                                                                                                                                                                                                                                           New Zealand Post
Despite revenues growing by $2.4m (3% increase), EBIT fell by $3.5m
(66% decrease), resulting in a 4.7% drop in its Profitability Ratio.
Combined with a lower Activity Ratio (2.21 × in 2018 compared to
2.06 × in 2019) this resulted in a 10.8% decline in ROCE (15.5% in 2018
compared to 4.7% in 2019).

AsureQuality showed the greatest improvement of all Crown entities
analysed. Revenue increased by $42m (20% increase) and EBIT
increased by $16.2m (120% increase). The Profitability Ratio increased
from 6.4% in 2018 to 11.7% in 2019 and the Activity Ratio improved
slightly to 2.86 × increasing ROCE from 16.7% in 2018 to 33.4% in 2019.
Armillary Private Capital   Return on Capital Employed – Review of 2019 Returns                                                                                                                                                                                                                                                                                                                              10

Distribution of Results
                                                                                                                                                                                                               ROCE Distribution
                                                                                                                                                                                                               2017                                              2018                                2019

                                                                                          35

                                                                                          30

The ROCE returns for the last three years follow a normal distribution,
                                                                                          25
with outliers at either side of a bell-shaped curve. The 2019 distribution
tracks the 2018 distribution, however the number of firms posting
                                                                                          20

                                                                                  Count
negative ROCE are more concentrated just below breakeven (between
– 5%-0%) but there is also a small increase to firms posting negative                     15
ROCE below – 50%.
                                                                                          10
Overall the bell curve has again slightly shifted to the left with a greater
weighting on ROCE between – 5%-0% relative to 2018 returns.                                5

44% of Listed & Crown entities in New Zealand achieved a ROCE greater                      0
than 8% being a common estimate of the market WACC, just below the

                                                                                               < (50%)
                                                                                                         (50%) to (45%)
                                                                                                                          (45%) to (40%)
                                                                                                                                           (40%) to (35%)
                                                                                                                                                            (35%) to (30%)
                                                                                                                                                                             (30%) to (25%)
                                                                                                                                                                                              (25%) to (20%)
                                                                                                                                                                                                               (20%) to (15%)
                                                                                                                                                                                                                                (15%) to (10%)
                                                                                                                                                                                                                                                 (10%) to (5%)
                                                                                                                                                                                                                                                                 (5%) to 0%
                                                                                                                                                                                                                                                                              0% to 5%
                                                                                                                                                                                                                                                                                         5% to 10%
                                                                                                                                                                                                                                                                                                     10% to 15%
                                                                                                                                                                                                                                                                                                                  15% to 20%
                                                                                                                                                                                                                                                                                                                               20% to 25%
                                                                                                                                                                                                                                                                                                                                            25% to 30%
                                                                                                                                                                                                                                                                                                                                                         30% to 35%
                                                                                                                                                                                                                                                                                                                                                                      35% to 40%
                                                                                                                                                                                                                                                                                                                                                                                   40% to 45%
                                                                                                                                                                                                                                                                                                                                                                                                45% to 50%
                                                                                                                                                                                                                                                                                                                                                                                                             > 50%
previous year’s result of 47%.

28 companies recorded a ROCE less than zero in 2019. A negative
ROCE implies negative profitability. 7% of the total sample (10 firms)
had a ROCE of less than negative 50%. Three of these companies were
from the technology sector and three were from the Healthcare sector,
including the newly listed Cannasouth.
Armillary Private Capital    Return on Capital Employed – Review of 2019 Returns                                                                                     11

Spotlight: Transport & Logistics
It has been a strange start to the year to say the least. The Coronavirus                 The question is complex and solutions/outcomes exponentially more so
pandemic has wreaked havoc around the world, drastically altering                         as the pandemic continues to develop; border shutdowns, quantitative
the economic outlook. Seven months after the virus first appeared,                        easing and government stimulus, supply chain disruptions, a potential
there remains substantial questions over what the impact will be, both                    second wave, a strong recovery in the stock market with widely varying
economically and socially, and what the recovery will look like.                          outcomes between countries. We do not attempt here to define or
                                                                                          answer this, and instead have taken an observatory approach.

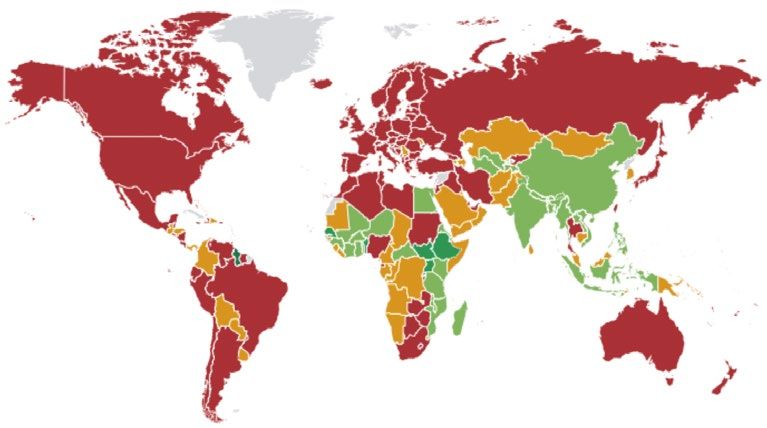
                            Forecast Real GDP Growth                                      Against this backdrop, Armillary has undertaken some research and
                       Annual Percentage change 2020                                      analysis of New Zealand companies in the Transport & Logistics sector.
                                                                                          We found that the sector is broken down to two sub-categories
                                                                                          with different fundamental market metrics – port companies and
                                                                                          transportation companies. Port companies are more closely aligned to
                                                                                          infrastructure assets. Interestingly the ROCE components of companies
                                                                                          in both sub – categories differed significantly, but most notably within
                                                                                          the port sector.

                                                                                          By establishing a benchmark to review in a year’s time, we wanted to
                                                                                          test the thesis that balance sheet flexibility will lessen reductions in ROCE
                                                                                          relative to highly operating leveraged companies.

  6% or more                                                                              We will provide follow up analysis in next year’s annual ROCE report
  3% – 6%                                                                                 with the objective to draw comparisons to the pre/post-Covid results
  0 – 3%
                                                                                          from a sector expected to face significant headwinds in widely forecast
  -30% – 0
  Less than -3%                                                                           declines in domestic and global GDP.
  no data                                                      Source: IMF (March 2020)
Armillary Private Capital        Return on Capital Employed – Review of 2019 Returns                                                                                                              12

From our understanding of some companies we work with in the sector,                                                      Figure 2: ANZ Heavy Traffic Index and GDP
Transport and Logistics will be naturally affected by changes in GDP and
                                                                                                                                      Heavy Traffic Index (LHS)        GDP (RHS)
the resulting impact and response by sector companies will show up
in ROCE analysis. Transport companies are often seen as ‘bellwethers’                                        1,700
                                                                                                                                                                                             65
of the strength of the economy and we anticipate results to vary with                                        1,600
operating leverage and that companies with a higher fixed asset base                                                                                                                         62
                                                                                                             1,500
to be more at risk of increased, adverse impact to ROCE. We also will                                                                                                                        59
look at operating efficiency metrics, as we expect those companies                                           1,400
                                                                                                                                                                                             56

                                                                                       Index Jan 04 = 1000

                                                                                                                                                                                                  Real 2009/10 $bn
with greater productivity and systems efficiencies will out-perform others.                                  1,300
                                                                                                                                                                                             53
To further assess the impact, we have referenced analysis by ANZ                                             1,200
                                                                                                                                                                                             50
Research’s ‘Truckometer’, which is a set of two economic indicators                                          1,100
                                                                                                                                                                                             47
derived from traffic volume around New Zealand.
                                                                                                             1,000                                                                           44
Traffic flows are a real time proxy for economic activity, particularly in                                    900                                                                            41
New Zealand where road transport accounts for over 90% of freight
                                                                                                              800                                                                            38
by weight 6. The ANZ Truckometer represents a timely barometer of
economic momentum given its strong relationship with GDP.                                                     700                                                                            35
                                                                                                                     04      06       08       10      12         14      16       18   20

Figure 2. is an excerpt from ANZ Research Truckometer July 2020
                                                                                                                     Source: ANZ Research July 2020
report 7 which illustrates the impact of New Zealand’s nationwide lock
down. The Heavy Traffic Index 8 tracks heavy truck and bus movement
around New Zealand and has been a reliable indicator of real time
GDP in the past. The data reveals weekly heavy traffic has recovered
to prior year levels from Alert Level 2, however is more likely a result
of an accumulation of demand from the prior period of essential
deliveries only, and businesses replenishing inventory rather than a
return to normality.

6   National Freight Demand Study 2017/2018.
7   Data is to May 2020.
8   The Heavy Traffic Index is adjusted for seasonality.
Armillary Private Capital   Return on Capital Employed – Review of 2019 Returns                                                                               13

                                                                                                           Real GDP Growth New Zealand
                                                                                                                 Annual Percentage Change
The IMF is forecasting a 7.2% decline in real GDP growth for
New Zealand and the value of imports and exports over the February                 8%
– June period both show a notable year on year decline. The full
impact on the Transport and Logistics sector remains uncertain,                    6%

however it seems reasonable to presume there will be a pronounced
                                                                                   4%
adverse impact on the sectors balance sheet from lower volumes of
imports and exports.                                                               2%

We have selected eight companies from New Zealand in the Transport
& Logistics subsector (including ports) below:                                    (2%)

• Freightways                                                                     (4%)

• Mainfreight                                                                     (6%)
• Marsden Maritime
                                                                                  (8%)
• Napier Port Holdings                                                               2000                  2005            2010         2015           2020
• New Zealand Post
                                                                                         Source: IMF June 2020
• Port of Tauranga
• QEX Logistics
• TIL Logistics

There is a significant difference in ROCE inputs for ports, characterised         Activity Ratios for ports are all less than 0.5 × compared to a
by higher Profitability Ratios and lower Activity Ratios. Median and              range of c. 1.0 × – 5.5 ×, reflecting much higher capital intensity.
average ROCE for ports is less than half of the other companies                   Interestingly, Freightways and Mainfreight have similar ROCE but quite
in the sample.                                                                    different composition.

Profitability Ratios for ports have consistently ranged from 30% to 200%          Mainfreight has a higher Activity Ratio, despite land and buildings
over the last 3 years, whilst other transport and logistics companies             accounting for over 50% of its net operating assets compared to
are around half of this (or less) with Freightways leading the way                Freightways, where land and buildings account for less than 10% of net
in profitability.                                                                 operating assets. The difference in Activity is instead driven by different
Armillary Private Capital                    Return on Capital Employed – Review of 2019 Returns                                                                                                                                                   14

                               Transport & Logistics ROCE 2019                                                                                                         business mix, with Mainfreight having c.$1.1bn (approx. one third of its
                                                                                                                                                                       revenue) in lower margin international freight forwarding.
                                                          2017          2018           2019

                                                                                                                                                                       New Zealand Post profitability was affected by $40m of impairment
        60%
                                                                                                                                                                       losses relating to systematic uncertainty over future mail volumes as
        55%
                                                                                                                                                                       well as $38m of additional employee expenses from remediating non-
        50%
                                                                                                                                                                       compliance to the Holidays Act.
        45%
        40%                                                                                                                                                            Marsden Maritime has a different operating structure to the other two
        35%                                                                                                                                                            ports, with the operating port held in a joint venture, resulting in different
        30%                                                                                                                                                            ROCE composition.
ROCE

        25%
        20%
        15%
        10%
         5%
                                                                                                                                                                        Company                               Profitability    Activity        ROCE
         0%
        (5%)
                                                                                                                                                                        QEX Logistics                               5.8%        5.41 ×        31.3%
       (10%)                                                                                                                                                            Freightways                               15.8%         1.46 ×        23.1%
               QEX Logistics

                               Freightways

                                                 Mainfreight

                                                                 TIL Logistics Group

                                                                                       Napier Port Holdings

                                                                                                              Port of Tauranga

                                                                                                                                 Marsden Maritime

                                                                                                                                                    New Zealand Post
                                                                                                                                                                        Mainfreight                                 6.8%        3.15 ×        21.3%

                                                                                                                                                                        TIL Logistics Group                         4.1%        3.35 ×        13.6%

                                                                                                                                                                        New Zealand Post                          (3.4%)        0.72 ×       (2.5%)

                                                                                                                                                                        Median                                     5.8%         3.15 ×        21.3%

                                                                                                                                                                        Napier Port Holdings                      30.1%         0.33 ×        10.0%

                                                                                                                                                                        Port of Tauranga                          43.6%         0.20 ×         8.6%

                                                                                                                                                                        Marsden Maritime                        163.1%          0.04 ×         6.3%

                                                                                                                                                                        Median                                    43.6%         0.20 ×         8.6%
Armillary Private Capital                                                      Return on Capital Employed – Review of 2019 Returns                                                                                                                                                                                                                                                                                                                                                                                                                                                                                                                                            15

Individual Entities
                                                                                                                                                                                                                                                                                                                          The following four charts show the individual ROCE performance for
                                                                                                                                                                                                                                                                                                                          each of the 142 listed and Crown Entities reviewed in 2019. Note that
                                                                                                                                                                                                                                                                                                                          for the purposes of presenting this chart, entities with ROCE greater than
                                                                                                                                                                                                                                                                                                                          100% have been capped at that level.

                                                                                                                                                                                                                                                                                                                          The 36 entities in the top quartile are dominated by the Consumer
                                                                                                                                                                                                                                                                                                                          Products and Services and Business Products and Services sectors,
                                                                                                                                                                                                                                                                                                                          which combined make up 69% of this top quartile. Top quartile ROCE
                                                                                                                                                                                                                                                                                                                          performance ranges from 234.0% to 14.6%.

                                                                                                                                                                                                                                                                    2019 ROCE – Top Quartile

100%
 90%
 80%
 70%
 60%
 50%
 40%
 30%
 20%
 10%
  0%
       Zespri

                The a2 Milk Company

                                      Hallenstein Glasson

                                                            Briscoe Group

                                                                            Fisher & Paykel Healthcare

                                                                                                         AsureQuality

                                                                                                                        Syft Technology

                                                                                                                                          NZX

                                                                                                                                                QEX Logistics

                                                                                                                                                                Plexure

                                                                                                                                                                          South Port New Zealand

                                                                                                                                                                                                   Burger Fuel Worldwide

                                                                                                                                                                                                                           Solution Dynamics

                                                                                                                                                                                                                                               CDL Investments NZ

                                                                                                                                                                                                                                                                     Serko

                                                                                                                                                                                                                                                                             Freightways

                                                                                                                                                                                                                                                                                           Mainfreight

                                                                                                                                                                                                                                                                                                         Allied Farmers

                                                                                                                                                                                                                                                                                                                          AFT Pharmaceuticals

                                                                                                                                                                                                                                                                                                                                                Skellerup

                                                                                                                                                                                                                                                                                                                                                            Spark New Zealand

                                                                                                                                                                                                                                                                                                                                                                                Kathmandu Holdings

                                                                                                                                                                                                                                                                                                                                                                                                     The Warehouse Group

                                                                                                                                                                                                                                                                                                                                                                                                                           Pharmazen

                                                                                                                                                                                                                                                                                                                                                                                                                                       Synlait Milk

                                                                                                                                                                                                                                                                                                                                                                                                                                                      Z Energy

                                                                                                                                                                                                                                                                                                                                                                                                                                                                 Skyline

                                                                                                                                                                                                                                                                                                                                                                                                                                                                           Airways Corporation

                                                                                                                                                                                                                                                                                                                                                                                                                                                                                                 Michael Hill International

                                                                                                                                                                                                                                                                                                                                                                                                                                                                                                                              Green Cross Health

                                                                                                                                                                                                                                                                                                                                                                                                                                                                                                                                                   Meteorological Service

                                                                                                                                                                                                                                                                                                                                                                                                                                                                                                                                                                            Restaurant Brands NZ

                                                                                                                                                                                                                                                                                                                                                                                                                                                                                                                                                                                                   SKY Network Television

                                                                                                                                                                                                                                                                                                                                                                                                                                                                                                                                                                                                                            BLIS Technologies

                                                                                                                                                                                                                                                                                                                                                                                                                                                                                                                                                                                                                                                Blue Sky Meats (NZ)

                                                                                                                                                                                                                                                                                                                                                                                                                                                                                                                                                                                                                                                                      SKYCITY Entertainment Group
0%
                                       2%
                                            4%
                                                 6%
                                                      8%
                                                           10%
                                                                 12%
                                                                       14%
                                                                             16%
                  Silver Fern Farms

                TIL Logistics Group

                       Ebos Group

         Vista Group International
                                                                                                                                                                                           Armillary Private Capital

         Colonial Motor Company

               Scales Corporation
                                                                                                                 above their individual WACC.

                  Fletcher Building

                              Vital

           Veritas Investments (NZ)

                    Just Life Group

                          Delegat

                        Terra Vitae

                           Downer

                  Tourism Holdings

                    Transpower NZ
                                                                                                                                                                                           Return on Capital Employed – Review of 2019 Returns

Livestock Improvement Corporation
                                                                                                                 The 35 entities in the second quartile had 2019 ROCE ranging between
                                                                                                                 14.2% and 7.1%. At these levels we estimate that most are trading at or

         Metro Performance Glass

              Napier Port Holdings

                   NZ King Salmon

                            Telstra

                      Connexionz
                                                                                   2019 ROCE – Second Quartile

                  Meridian Energy

                             NZME

                           Sanford

       Augusta Capital (Auckland)

                 Scott Technology

                  Port of Tauranga

                             Air NZ

                  Gentrack Group

              AWF Madison Group

                   Contact Energy

                        TrustPower

 Water and Atmospheric Research

         Abano Healthcare Group

                       Mercury NZ
                                                                                                                                                                                           16
0%
                                           1%
                                                2%
                                                     3%
                                                          4%
                                                               5%
                                                                    6%
                                                                         7%
                                                                              8%
                 Tower Insurance

    Fonterra Co-operative Group

                        Seeka Ltd
                                                                                                                individual WACC.

                 KiwiRail Holdings
                                                                                                                                                                                          Armillary Private Capital

               Marsden Maritime

            Steel & Tube Holdings

                           Rakon

         Evolve Education Group

             Property for Industry

               Investore Property

                           Infratil

               NZ Forest Research

                    Asset Plus Ltd

                Turners & Growers

                           Vector
                                                                                                                returns would suggest that the companies are earning below their
                                                                                                                The third quartile ranges from 6.8 to 1.6%. At face value this level of
                                                                                                                                                                                          Return on Capital Employed – Review of 2019 Returns

Institute of Environmental Science

                Auckland Airport

                      Foley Wines

                     Speirs Group

                  Tilt Renewables
                                                                                   2019 ROCE – Third Quartile

             Stride Stapled Group

                   Cavalier Corp

                 Argosy Property

                         Pushpay

         Goodman Property Trust

                  PGG Wrightson

                    NZ Windfarms

             Kiwi Property Group

                   Mercer Group

           Precinct Properties NZ

              Genesis Energy (NZ)

                    Rural Equities

                        Rangatira

                      Chorus (NZ)

                    Arvida Group
                                                                                                                                                                                          17
Armillary Private Capital                                                                        Return on Capital Employed – Review of 2019 Returns                                                                                                                                                                                                                                                                                                                                                                                                                                                                                                                                                  18

The bottom quartile mostly consists of entities with a negative ROCE,                                                                                                                                                                                                                                                                                           focused on a significant growth strategy at the expense of short-term
ranging from 1.1% to negative 2,416.3%. Note that for the purposes of                                                                                                                                                                                                                                                                                           profitability. In contrast, those mature businesses with negative ROCE
this chart, those entities with a ROCE of less than negative 100% have                                                                                                                                                                                                                                                                                          may need to reconsider the viability of their business models if their
been constrained at that level.                                                                                                                                                                                                                                                                                                                                 negative results are a recurring theme.

25% of firms in the Consumer Products and Services sector fall into this                                                                                                                                                                                                                                                                                        Several of the retirement village operators are in this sample. If
quartile. Whilst typically seen as a profitable industry, and for many                                                                                                                                                                                                                                                                                          the analysis were repeated on underlying non-GAAP measure of
companies it is, the ones in this quartile tend to be small and/or focused                                                                                                                                                                                                                                                                                      profitability, this is would not be the case.
on more volatile based earnings. Others within this bottom quartile are

                                                                                                                                                                                                                                                                                            2019 ROCE – Lower Quartile

   0%

 (20%)

(40%)

 (60%)

(80%)

(100%)
         Smiths City Group

                             AgResearch

                                          NZ Refining Company

                                                                Ryman Healthcare

                                                                                   Vital Healthcare Property Trust

                                                                                                                     Kordia Group

                                                                                                                                    Rubicon (NZ)

                                                                                                                                                   Metlifecare

                                                                                                                                                                 Summerset Group Holdings

                                                                                                                                                                                            Turners Automotive Group

                                                                                                                                                                                                                       Landcorp Farming

                                                                                                                                                                                                                                          Oceania Healthcare

                                                                                                                                                                                                                                                               SmartPay Holdings

                                                                                                                                                                                                                                                                                   Palliser Estate

                                                                                                                                                                                                                                                                                                     Comvita

                                                                                                                                                                                                                                                                                                               Plant & Food Research

                                                                                                                                                                                                                                                                                                                                       NZ Oil & Gas

                                                                                                                                                                                                                                                                                                                                                      NZ Post

                                                                                                                                                                                                                                                                                                                                                                TMP

                                                                                                                                                                                                                                                                                                                                                                      EROAD

                                                                                                                                                                                                                                                                                                                                                                              Enprise Group

                                                                                                                                                                                                                                                                                                                                                                                              Future Mobility Solutions

                                                                                                                                                                                                                                                                                                                                                                                                                          Chatham Rock Phosphate

                                                                                                                                                                                                                                                                                                                                                                                                                                                   Wellington Drive Technologies

                                                                                                                                                                                                                                                                                                                                                                                                                                                                                   AFC Group Holdings

                                                                                                                                                                                                                                                                                                                                                                                                                                                                                                        TruScreen

                                                                                                                                                                                                                                                                                                                                                                                                                                                                                                                    SeaDragon

                                                                                                                                                                                                                                                                                                                                                                                                                                                                                                                                Moa Group

                                                                                                                                                                                                                                                                                                                                                                                                                                                                                                                                            Cooks Global Foods

                                                                                                                                                                                                                                                                                                                                                                                                                                                                                                                                                                 Geo (Business/Productivity Software)

                                                                                                                                                                                                                                                                                                                                                                                                                                                                                                                                                                                                        Cannasouth

                                                                                                                                                                                                                                                                                                                                                                                                                                                                                                                                                                                                                     ikeGPS

                                                                                                                                                                                                                                                                                                                                                                                                                                                                                                                                                                                                                              Promisia Integrative

                                                                                                                                                                                                                                                                                                                                                                                                                                                                                                                                                                                                                                                     Geological and Nuclear Sciences

                                                                                                                                                                                                                                                                                                                                                                                                                                                                                                                                                                                                                                                                                       Pacific Edge

                                                                                                                                                                                                                                                                                                                                                                                                                                                                                                                                                                                                                                                                                                      Paysauce
Armillary Private Capital   Return on Capital Employed – Review of 2019 Returns                                                                           19

                                                                                  About Armillary
                                                                                  Private Capital
                                                                                  Armillary Private Capital is an investment bank providing investment
                                                                                  banking, advisory and asset management services focused on the
                                                                                  New Zealand capital markets. Our purpose is enabling success for
                                                                                  businesses, business owners and investors.

                                                                                  Our approach is based on a combination of influences grounded in our
                                                                                  culture, methodology and experiences. We have worked with a range
                                                                                  of New Zealand businesses through all stages of the business lifecycle
                                                                                  from start-up to maturity. Be they private, listed or government-related,
                                                                                  we have seen and experienced the roller-coaster rides business owners
                                                                                  and managers endure. These experiences allow us to quickly identify
                                                                                  clients’ needs and find the right solution(s).

                                                                                  An important part of our approach is the use of proven financial tools
                                                                                  and methodologies to provide a concise but comprehensive view of
                                                                                  business performance. A key methodology that underpins our work
                                                                                  is the DuPont method. This powerful but highly practical method of
                                                                                  analysis allows us to develop a rapid understanding of the underlying
                                                                                  performance of a business and to identify key business drivers. This
                                                                                  disciplined approach helps us with quality decision making in our work.

                                                                                  Armillary Private Capital is the manager of Efficient Market Services
                                                                                  Limited, operator of the Unlisted Securities Exchange (USX).
Armillary Private Capital   Return on Capital Employed – Review of 2019 Returns   20

Sources of Data
The data for this analysis and report has been compiled by Armillary
Private Capital from annual reports and data obtained through
Pitchbook. We note that we are reliant on the categorisation used by
Pitchbook for this analysis and such categorisation may vary from the
categorisation we have applied to those companies for which we have
sourced the data directly from their annual reports.

Profitability has been calculated on a normalised EBIT basis,
predominantly excluding revaluations, gains/losses on fixed assets and
unrealised gains. Calculations have been extracted from Pitchbook and
entered manually when required. These results from Pitchbook have not
been extensively audited by Armillary, and results may vary.
Armillary Private Capital   Return on Capital Employed – Review of 2019 Returns                                                                               21

Appendix 1 – Detailed Results
Appendix 1 contains a table of individual entity results of 2018 and 2019 Profitability and Activity Ratios along with ROCE for the last three years.

                                                                                                2018       2019                                           3 Year
                                                                2018 EBIT         2019 EBIT   Activity   Activity                                       Average
 Company                                       Market             Margin            Margin      Ratio      Ratio    ROCE 2017   ROCE 2018   ROCE 2019      ROCE

 Abano Healthcare Group                        NZX                 9.4%              7.5%       1.0 ×      1.0 ×        9.1%        9.2%        7.3%      8.5%

 AFC Group Holdings                            NZX               (5.7%)           (37.8%)       1.6 ×      0.7 ×     (37.1%)      (8.9%)     (26.1%)    (24.0%)

 AFT Pharmaceuticals                           NZX              (12.5%)              8.8%       2.7 ×      2.4 ×     (51.9%)     (34.4%)       21.1%    (21.7%)

 AgResearch                                    Crown             (3.1%)              0.8%       0.8 ×      0.8 ×        2.0%      (2.3%)        0.7%      0.1%

 Air New Zealand                               NZX                10.4%              7.0%       1.1 ×      1.1 ×       12.8%       11.9%        8.0%     10.9%

 Airways Corporation                           Crown              14.8%             14.5%       1.2 ×      1.2 ×       21.9%       18.5%       17.0%     19.1%

 Allied Farmers                                NZX                51.5%             23.4%       0.6 ×      0.9 ×       46.6%       33.4%       21.1%     33.7%

 Argosy Property                               NZX                49.8%             49.1%       0.1 ×      0.1 ×        5.5%        4.1%        4.0%      4.5%

 Arvida Group                                  NZX                22.0%             14.6%       0.1 ×      0.1 ×        2.9%        2.7%        1.6%      2.4%

 Asset Plus Ltd                                NZX                58.3%             54.6%       0.1 ×      0.1 ×        4.1%        5.8%        5.2%      5.0%

 AsureQuality                                  Crown               6.4%             11.7%       2.6 ×      2.9 ×       14.1%       16.7%       33.4%     21.4%

 Auckland Airport                              NZX                53.6%             52.4%       0.1 ×      0.1 ×        5.7%        5.0%        4.7%      5.1%

 Augusta Capital (Auckland)                    NZX                43.8%             42.7%       0.2 ×      0.2 ×        7.8%        7.4%        8.9%      8.1%

 AWF Madison Group                             NZX                 3.1%              1.8%       4.1 ×      4.2 ×       16.1%       12.6%        7.6%     12.1%

 BLIS Technologies                             NZX              (19.6%)              4.9%       2.1 ×      3.0 ×        0.9%     (41.2%)       14.7%     (8.5%)
Armillary Private Capital   Return on Capital Employed – Review of 2019 Returns                                                                               22

                                                                                                2018       2019                                           3 Year
                                                                2018 EBIT         2019 EBIT   Activity   Activity                                       Average
 Company                                       Market             Margin            Margin      Ratio      Ratio    ROCE 2017   ROCE 2018   ROCE 2019      ROCE

 Blue Sky Meats (NZ)                           USX                 4.3%              3.9%       3.1 ×      3.7 ×      (5.6%)       13.2%       14.6%      7.4%

 Briscoe Group                                 NZX                13.9%             13.7%       3.1 ×      3.3 ×       45.2%       43.1%       44.6%     44.3%

 Burger Fuel Worldwide                         NZX                 4.6%              8.7%       2.9 ×      3.4 ×       14.9%       13.5%       29.1%     19.2%

 Cannasouth                                    NZX                      -    (4,167.4%)         0.0 ×      0.0 ×            -           -    (67.5%)    (22.5%)

 Cavalier Corp                                 NZX                 4.3%              2.7%       1.4 ×      1.5 ×        4.5%        6.1%        4.1%      4.9%

 CDL Investments New Zealand                   NZX                53.0%             50.7%       0.6 ×      0.5 ×       36.2%       31.6%       26.8%     31.5%

 Chatham Rock Phosphate                        NZX          (25,849.9%)     (13,541.6%)         0.0 ×      0.0 ×            -    (27.4%)     (16.1%)    (14.5%)

 Chorus (New Zealand)                          NZX                12.0%              7.7%       0.3 ×      0.3 ×        5.7%        3.9%        2.2%      3.9%

 Colonial Motor Company                        NZX                 4.7%              4.3%       3.4 ×      3.1 ×       16.2%       15.9%       13.1%     15.1%

 Comvita                                       NZX                 8.7%            (3.5%)       0.7 ×      0.6 ×        0.8%        6.4%      (2.2%)      1.7%

 Connexionz                                    USX              (31.0%)              2.5%       2.5 ×      3.8 ×     (30.7%)     (76.7%)        9.6%    (32.6%)

 Contact Energy                                NZX                10.9%             12.4%       0.5 ×      0.6 ×        6.3%        5.5%        7.5%      6.4%

 Cooks Global Foods                            NZX              (58.8%)           (58.6%)       0.5 ×      1.0 ×     (48.4%)     (28.4%)     (60.0%)    (45.6%)

 Delegat                                       NZX                28.4%             28.1%       0.4 ×      0.4 ×        9.7%       12.7%       12.3%     11.6%

 Downer                                        NZX                 3.4%              3.8%       2.8 ×      2.9 ×        8.9%        9.7%       11.1%      9.9%

 Ebos Group                                    NZX                 3.2%              3.1%       4.6 ×      4.3 ×       14.9%       14.8%       13.6%     14.4%

 Enprise Group                                 NZX                 2.2%            (5.7%)       1.6 ×      0.9 ×       11.7%        3.6%      (5.3%)      3.3%

 EROAD                                         NZX               (8.6%)            (3.4%)       0.0 ×      0.8 ×     (10.2%)      (0.3%)      (2.6%)     (4.4%)

 Evolve Education Group                        NZX                 9.7%             20.1%       0.7 ×      0.3 ×       11.7%        7.2%        5.9%      8.2%
Armillary Private Capital   Return on Capital Employed – Review of 2019 Returns                                                                               23

                                                                                                2018       2019                                           3 Year
                                                                2018 EBIT         2019 EBIT   Activity   Activity                                       Average
 Company                                       Market             Margin            Margin      Ratio      Ratio    ROCE 2017   ROCE 2018   ROCE 2019      ROCE

 Fisher & Paykel Healthcare                    NZX                30.3%             29.8%       1.4 ×      1.4 ×       42.6%       42.5%       40.7%     41.9%

 Fletcher Building                             NZX                 0.5%              7.6%       1.7 ×      1.7 ×        9.9%        0.9%       12.7%      7.8%

 Foley Wines                                   NZX                10.9%             13.4%       0.3 ×      0.3 ×        7.0%        3.7%        4.6%      5.1%

 Fonterra Co-operative Group                   NZX                 4.4%              4.1%       1.6 ×      1.6 ×        8.9%        7.0%        6.6%      7.5%

 Freightways                                   NZX                16.4%             15.8%       1.4 ×      1.5 ×       23.8%       23.4%       23.1%     23.4%

 Future Mobility Solutions                     USX               (6.2%)            (4.3%)       2.7 ×      3.6 ×       10.0%     (16.8%)     (15.5%)     (7.4%)

 Genesis Energy (New Zealand)                  NZX                 1.7%              3.6%       0.7 ×      0.8 ×        5.2%        1.2%        3.0%      3.1%

 Gentrack Group                                NZX                25.9%             14.3%       0.6 ×      0.5 ×       17.6%       14.8%        7.9%     13.4%

 Geo                                           NZX              (78.4%)           (43.9%)       0.5 ×      1.5 ×     (36.0%)     (41.8%)     (66.1%)    (48.0%)

 Geological and Nuclear Sciences               Crown               0.3%              0.6%       3.1 ×      3.5 ×       15.2%        0.9%        2.0%      6.0%

 Goodman Property Trust                        NZX                79.5%             70.2%       0.1 ×      0.1 ×        3.9%        4.5%        3.7%      4.0%

 Green Cross Health                            NZX                 6.1%              5.1%       3.2 ×      3.2 ×       23.0%       19.3%       16.4%     19.6%

 Hallenstein Glasson                           NZX                13.8%             13.6%       5.7 ×      5.3 ×       53.8%       78.2%       71.6%     67.9%

 ikeGPS                                        NZX              (83.4%)           (61.2%)       0.9 ×      1.4 ×    (114.4%)     (77.6%)     (84.4%)    (92.1%)

 Infratil                                      NZX                18.8%             21.5%       0.3 ×      0.2 ×        5.6%        6.0%        5.3%      5.6%

 Institute of Environmental Science            Crown               7.0%              2.3%       2.2 ×      2.1 ×       18.2%       15.5%        4.7%     12.8%

 Investore Property                            NZX                82.0%             75.6%       0.1 ×      0.1 ×            -       5.2%        5.5%      3.6%

 Just Life Group                               NZX                17.9%              9.5%       0.9 ×      1.3 ×       20.0%       15.4%       12.4%     15.9%

 Kathmandu Holdings                            NZX                15.3%             15.6%       1.3 ×      1.2 ×       17.1%       19.9%       19.1%     18.7%
Armillary Private Capital   Return on Capital Employed – Review of 2019 Returns                                                                               24

                                                                                                2018       2019                                           3 Year
                                                                2018 EBIT         2019 EBIT   Activity   Activity                                       Average
 Company                                       Market             Margin            Margin      Ratio      Ratio    ROCE 2017   ROCE 2018   ROCE 2019      ROCE

 Kiwi Property Group                           NZX                48.7%             44.2%       0.1 ×      0.1 ×        4.8%        4.3%        3.5%      4.2%

 KiwiRail Holdings                             Crown               2.5%              9.1%       0.7 ×      0.7 ×       13.3%        1.8%        6.4%      7.2%

 Kordia Group                                  Crown               4.1%              0.1%       2.3 ×      2.1 ×      (1.6%)        9.2%        0.1%      2.6%

 Landcorp Farming                              Crown              23.0%            (2.1%)       0.1 ×      0.1 ×        3.7%        3.4%      (0.3%)      2.3%

 Livestock Improvement Corporation             NZX                 6.3%             11.8%       0.9 ×      0.9 ×       12.8%        5.7%       10.6%      9.7%

 Mainfreight                                   NZX                 6.2%              6.8%       3.0 ×      3.1 ×       17.6%       18.4%       21.3%     19.1%

 Marsden Maritime                              NZX              190.2%            163.1%        0.0 ×      0.0 ×        7.0%        6.6%        6.3%      6.7%

 Mercer Group                                  NZX              (15.0%)              1.1%       2.0 ×      3.2 ×     (11.9%)     (29.9%)        3.5%    (12.8%)

 Mercury NZ                                    NZX                23.6%             16.8%       0.4 ×      0.4 ×        8.4%        9.3%        7.1%      8.2%

 Meridian Energy                               NZX                13.7%             17.8%       0.4 ×      0.5 ×        5.0%        6.0%        9.4%      6.8%

 Meteorological Service                        Crown               8.6%              8.4%       1.8 ×      1.9 ×       13.9%       15.6%       16.2%     15.2%

 Metlifecare                                   NZX               (0.1%)              0.3%       0.1 ×      0.1 ×      (0.1%)      (0.0%)        0.0%     (0.0%)

 Metro Performance Glass                       NZX                11.5%              9.4%       1.1 ×      1.1 ×       15.1%       12.1%       10.1%     12.5%

 Michael Hill International                    NZX                 7.0%              6.2%       2.5 ×      2.6 ×       20.5%       17.7%       16.5%     18.2%

 Moa Group                                     NZX              (23.8%)           (17.9%)       2.2 ×      3.1 ×     (48.6%)     (52.4%)     (56.1%)    (52.4%)

 Napier Port Holdings                          NZX                30.6%             30.1%       0.3 ×      0.3 ×        8.9%        9.6%       10.0%      9.5%

 New Zealand Forest Research                   Crown               5.8%              3.4%       1.9 ×      1.6 ×       11.1%       10.8%        5.3%      9.1%

 New Zealand King Salmon                       NZX                14.7%              9.7%       1.0 ×      1.0 ×       23.8%       14.7%        9.9%     16.1%

 New Zealand Oil & Gas                         NZX               (5.9%)            (2.6%)       0.9 ×      0.9 ×     (38.3%)      (5.4%)      (2.4%)    (15.4%)
Armillary Private Capital   Return on Capital Employed – Review of 2019 Returns                                                                                  25

                                                                                                2018       2019                                              3 Year
                                                                2018 EBIT         2019 EBIT   Activity   Activity                                          Average
 Company                                       Market             Margin            Margin      Ratio      Ratio    ROCE 2017   ROCE 2018    ROCE 2019        ROCE

 New Zealand Post                              Crown               0.7%            (3.4%)       0.7 ×      0.7 ×        3.8%        0.5%        (2.5%)        0.6%

 New Zealand Refining Company                  NZX                13.8%              1.0%       0.3 ×      0.3 ×       12.8%        4.2%         0.3%         5.8%

 NZ Windfarms                                  NZX                10.5%             15.7%       0.1 ×      0.2 ×      (3.3%)        1.3%         3.6%         0.5%

 NZME                                          NZX                 6.2%              8.6%       1.0 ×      1.1 ×        8.7%        6.0%         9.2%         8.0%

 NZX                                           NZX                31.0%             32.8%       1.0 ×      1.0 ×       32.4%       30.6%        32.8%        31.9%

 Oceania Healthcare                            NZX                 1.7%            (3.0%)       0.2 ×      0.2 ×        5.1%        0.3%        (0.5%)        1.7%

 Pacific Edge                                  NZX             (556.4%)       (458.0%)          0.9 ×      3.3 ×    (304.0%)    (511.3%)    (1,532.2%)    (782.5%)

 Palliser Estate                               USX                 5.7%            (3.6%)       0.4 ×      0.4 ×        1.6%        2.1%        (1.3%)        0.8%

 Paysauce                                      NZX              (78.7%)       (571.7%)          6.7 ×      4.2 ×    (195.8%)    (524.4%)    (2,416.3%)   (1,045.5%)

 PGG Wrightson                                 NZX                 3.6%              1.5%       2.7 ×      2.5 ×       15.4%       10.0%         3.6%         9.7%

 Pharmazen                                     USX                16.0%             24.6%       0.6 ×      0.8 ×      (0.9%)       10.3%        18.8%         9.4%

 Plant & Food Research                         Crown               4.7%              4.8%       1.4 ×    (0.5 ×)        7.5%        6.6%        (2.2%)        3.9%

 Plexure                                       NZX               (0.1%)              7.5%       2.2 ×      4.1 ×    (115.7%)      (0.2%)        30.9%      (28.3%)

 Port of Tauranga                              NZX                44.6%             43.6%       0.2 ×      0.2 ×        8.8%        8.9%         8.6%         8.8%

 Precinct Properties New Zealand               NZX                63.4%             72.7%       0.1 ×      0.0 ×        4.4%        3.7%         3.1%         3.7%

 Promisia Integrative                          NZX             (391.1%)       (694.4%)          0.4 ×      0.3 ×     (61.6%)    (167.6%)     (224.9%)     (151.4%)

 Property for Industry                         NZX                83.8%             83.9%       0.1 ×      0.1 ×        1.9%        5.9%         5.7%         4.5%

 Pushpay                                       NZX              (29.5%)              0.7%       7.0 ×      5.6 ×    (219.5%)    (207.6%)         4.0%     (141.0%)

 QEX Logistics                                 NZX                 6.5%              5.8%       7.7 ×      5.4 ×      178.7%       49.7%        31.3%        86.6%
Armillary Private Capital   Return on Capital Employed – Review of 2019 Returns                                                                               26

                                                                                                2018       2019                                           3 Year
                                                                2018 EBIT         2019 EBIT   Activity   Activity                                       Average
 Company                                       Market             Margin            Margin      Ratio      Ratio    ROCE 2017   ROCE 2018   ROCE 2019      ROCE

 Rakon                                         NZX                 2.5%              4.7%       1.3 ×      1.3 ×      (2.3%)        3.1%        6.0%      2.3%

 Rangatira                                     USX                 7.2%              5.3%       0.4 ×      0.5 ×       13.7%        2.9%        2.7%      6.4%

 Restaurant Brands NZ                          NZX                 8.2%              7.9%       2.5 ×      2.0 ×       26.6%       20.3%       15.9%     20.9%

 Rubicon (New Zealand)                         NZX                      -            0.2%       0.0 ×      0.3 ×            -           -       0.1%      0.0%

 Rural Equities                                USX                41.9%             40.5%       0.1 ×      0.1 ×        2.4%        2.5%        2.7%      2.5%

 Ryman Healthcare                              NZX                 4.3%              1.4%       0.1 ×      0.1 ×        0.5%        0.4%        0.2%      0.4%

 Sanford                                       NZX                12.6%             11.9%       0.7 ×      0.8 ×        8.6%        8.7%        9.0%      8.8%

 Scales Corporation                            NZX                13.1%              8.8%       1.4 ×      1.5 ×       18.3%       18.0%       13.0%     16.4%

 Scott Technology                              NZX                 8.3%              4.8%       2.2 ×      1.9 ×       21.7%       18.0%        8.9%     16.2%

 SeaDragon                                     NZX             (167.1%)       (117.4%)          0.2 ×      0.5 ×     (41.5%)     (39.3%)     (53.7%)    (44.9%)

 Seeka Ltd                                     NZX                 7.6%              7.0%       1.0 ×      0.9 ×        9.1%        7.5%        6.6%      7.7%

 Serko                                         NZX                12.3%              8.2%       5.9 ×      3.0 ×    (119.0%)       72.9%       24.7%     (7.1%)

 Silver Fern Farms                             USX                 0.4%              3.7%       3.8 ×      3.9 ×        6.4%        1.6%       14.2%      7.4%

 Skellerup                                     NZX                16.4%             17.0%       1.2 ×      1.2 ×       17.4%       19.8%       20.0%     19.1%

 SKY Network Television                        NZX                22.0%             17.4%       0.6 ×      0.9 ×       11.2%       12.3%       15.0%     12.8%

 SKYCITY Entertainment Group                   NZX                24.5%             31.5%       0.6 ×      0.5 ×       14.7%       15.0%       14.6%     14.8%

 Skyline                                       USX                32.3%             31.3%       0.6 ×      0.6 ×       17.7%       18.1%       17.5%     17.8%

 SmartPay Holdings                             NZX                18.8%            (1.1%)       0.5 ×      0.5 ×        9.7%       10.2%      (0.6%)      6.5%

 Smiths City Group                             NZX               (7.1%)              0.5%       2.1 ×      2.1 ×      (3.7%)     (15.3%)        1.1%     (6.0%)
Armillary Private Capital   Return on Capital Employed – Review of 2019 Returns                                                                                  27

                                                                                                2018       2019                                              3 Year
                                                                2018 EBIT         2019 EBIT   Activity   Activity                                          Average
 Company                                       Market             Margin            Margin      Ratio      Ratio     ROCE 2017   ROCE 2018   ROCE 2019        ROCE

 Solution Dynamics                             NZX                 8.6%              3.2%       9.2 ×      8.8 ×        89.8%       78.7%       28.3%        65.6%

 South Port New Zealand                        NZX                34.0%             33.3%       0.9 ×      0.9 ×        26.8%       29.9%       30.6%        29.1%

 Spark New Zealand                             NZX                15.5%             16.2%       1.4 ×      1.2 ×        21.8%       21.1%       19.1%        20.7%

 Speirs Group                                  USX                 6.6%              1.9%       2.4 ×      2.4 ×    (3,422.5%)      16.2%        4.6%    (1,133.9%)

 Steel & Tube Holdings                         NZX                 3.3%              3.4%       1.6 ×      1.8 ×        10.1%        5.3%        6.2%         7.2%

 Stride Stapled Group                          NZX                80.8%             48.4%       0.1 ×      0.1 ×         3.6%        5.5%        4.5%         4.5%

 Summerset Group Holdings                      NZX               (1.9%)            (1.4%)       0.1 ×      0.1 ×        (0.1%)     (0.2%)      (0.1%)        (0.1%)

 Syft Technology                               USX                 7.9%             22.4%       1.6 ×      1.5 ×        17.2%       12.9%       33.0%        21.0%

 Synlait Milk                                  NZX                12.9%             12.2%       1.7 ×      1.5 ×        13.8%       22.4%       18.3%        18.2%

 Telstra                                       NZX                17.9%             12.3%       0.8 ×      0.8 ×        17.2%       15.0%        9.7%        14.0%

 Terra Vitae                                   USX                31.9%             94.8%       0.2 ×      0.1 ×         3.6%        4.9%       11.6%         6.7%

 The a2 Milk Company                           NZX                30.7%             32.3%       5.5 ×      4.8 ×       153.2%      168.4%      156.4%       159.3%

 The Warehouse Group                           NZX                 3.1%              3.7%       4.6 ×      5.1 ×        15.0%       14.3%       19.0%        16.1%

 TIL Logistics Group                           NZX                 4.2%              4.1%       6.6 ×      3.4 ×     (118.2%)       27.8%       13.6%      (25.6%)

 Tilt Renewables                               NZX                15.6%             25.5%       0.1 ×      0.2 ×         5.4%        2.2%        4.6%         4.1%

 TMP                                           USX              (38.4%)           (14.8%)       0.2 ×      0.2 ×      (27.4%)      (8.1%)      (2.6%)      (12.7%)

 Tourism Holdings                              NZX                14.7%             12.2%       1.0 ×      0.9 ×        15.4%       14.9%       10.9%        13.7%

 Tower Insurance                               NZX                 2.7%              5.6%       1.3 ×      1.2 ×        30.9%        3.4%        6.8%        13.7%

 Transpower New Zealand                        Crown              49.2%             46.9%       0.2 ×      0.2 ×        11.5%       12.0%       10.6%        11.4%
Armillary Private Capital   Return on Capital Employed – Review of 2019 Returns                                                                               28

                                                                                                2018       2019                                           3 Year
                                                                2018 EBIT         2019 EBIT   Activity   Activity                                       Average
 Company                                       Market             Margin            Margin      Ratio      Ratio    ROCE 2017   ROCE 2018   ROCE 2019      ROCE

 TruScreen                                     NZX             (521.0%)       (180.6%)          0.1 ×      0.2 ×     (31.3%)     (39.8%)     (32.6%)    (34.6%)

 TrustPower                                    NZX                21.9%             14.3%       0.5 ×      0.5 ×        7.8%       10.1%        7.5%      8.4%

 Turners & Growers                             NZX                 2.4%              2.1%       2.1 ×      2.3 ×        7.4%        5.0%        4.8%      5.7%

 Turners Automotive Group                      NZX               (1.5%)            (0.5%)       0.6 ×      0.3 ×        2.1%      (0.9%)      (0.2%)      0.3%

 Vector                                        NZX                19.7%             19.4%       0.3 ×      0.2 ×        6.1%        5.2%        4.8%      5.4%

 Veritas Investments (New Zealand)             NZX                13.9%             17.6%       0.7 ×      0.7 ×       20.3%        9.6%       12.5%     14.1%

 Vista Group International                     NZX                19.1%             14.8%       0.9 ×      0.9 ×       13.2%       18.2%       13.5%     15.0%

 Vital                                         NZX                24.4%             19.8%       0.6 ×      0.6 ×       14.0%       15.5%       12.6%     14.0%

 Vital Healthcare Property Trust               NZX                29.8%              2.1%       0.1 ×      0.1 ×        5.8%        2.1%        0.1%      2.7%

 Water and Atmospheric Research                Crown               5.4%              5.0%       1.5 ×      1.5 ×        5.6%        8.4%        7.4%      7.1%

 Wellington Drive Technologies                 NZX                 0.8%            (3.5%)       6.1 ×      5.2 ×     (11.6%)        4.8%     (18.0%)     (8.3%)

 Z Energy                                      NZX                 9.1%              5.6%       2.7 ×      3.2 ×       30.4%       24.2%       17.7%     24.1%

 Zespri                                        USX                 5.8%              8.1%     24.0 ×     28.9 ×       121.2%      140.1%      234.0%    165.1%
Armillary Private Capital   Return on Capital Employed – Review of 2019 Returns                                                                             29

Appendix 2 – ROCE explained

What is Return on Capital Employed and what does it show?                         ROCE can be used to test operational efficiency, balance sheet
                                                                                  management efficiency and the adequacy of return on total capital
Return on Capital Employed (ROCE) is a measure of business                        employed to assess a business’s performance.
effectiveness and capital efficiency. ROCE is a function of profitability,
how much profit a business generates before interest and tax (EBIT)               ROCE can be used to help management improve both the profitability
and activity, how much a business has invested in operating assets to             (EBIT) and balance sheet management. Improvements in these areas
generate that level of profitability.                                             will lead to improvements in the Return on Capital Employed.

In the 1920’s Du Pont Corporation developed what is commonly
known as Du Pont accounting and ROCE as a measure of business                     Calculating ROCE
performance to enable it to compare the performance of its
many different business units. The Du Pont accounting method is a                 It is important to note that some changes need to be made to
powerful and relatively simple approach to determine the impact of                traditional thinking to gain the benefits of this dynamic approach. To
management decisions on financial performance. The advantage                      achieve this there are two concepts that need to be considered:
of this method is that it provides a consistent form of evaluation for a
business to use when measuring performance.
                                                                                  Concepts
At an individual business level ROCE:
                                                                                  1. The separation of funding from operating decisions
• allows comparison between business units of different size over time;
• shows where to invest further and where to cut back;                            Consider the traditional formula for presenting financial statements.
• shows whether it is worth borrowing further to invest;
• shows if expectations of shareholders are being met;                               EQUITY = (Current Assets + Cash – Current Liabilities) + Non-current
• indicates the maximum sustainable growth of a business; and                        Assets – Debt – Non-current non-interest-bearing Liabilities
• is used to track whether a project is performing according to plan.
Armillary Private Capital   Return on Capital Employed – Review of 2019 Returns                                                                              30

In order to calculate ROCE, all forms of funding need to be removed               The Activity Ratio is a measure of how many times a business turns over
from the right-hand side of the equation. Total Net Assets should exclude         its CE in a financial year.
any external funding or debt thereby representing the true value of
                                                                                  By way of example, an Activity Ratio of 2.50 × means that for every
scarce resources employed in the business.
                                                                                  $1.00 invested in Capital Employed the business produces $2.50 in sales.
The financial analysis format can now be structured as follows.                   It answers the question of whether the net operating assets are being
                                                                                  utilised efficiently in the production of income.

   DEBT − CASH + EQUITY = (Current Assets – Current Liabilities) +                The activity drivers are:
   Non-Current Assets − Non-current non-interest-bearing Liabilities
                                                                                  • Raw Materials, Work in Progress, and Finished Goods: the value of raw
   CAPITAL EMPLOYED (CE) = TOTAL NET OPERATING ASSETS (TNA)                         materials, work in progress and finished goods the business holds;
                                                                                  • Trade Debtors: how much the business has tied up in receivables;
                                                                                  • Trade Creditors: how much the business owes to its suppliers for goods
The movement in TNA reflects operating changes made to the
                                                                                    and services provided; and
employment of scarce resources, whilst Net Debt (i.e. Debt – Cash) and
Equity reflects how these changes are funded. It should be noted that             • Non-Current Assets: how much is invested in plant and equipment
where the directors of a business elect to retain minimum levels of cash            and intangible assets which are required to operate the business and
this cash should be included in TNA.                                                produce the goods sold.

                                                                                  Other current assets and liabilities such as prepayments and accruals
2. Balance sheet efficiency – ACTIVITY RATIO                                      are included in trade debtors and creditors. Non-current non-interest-
                                                                                  bearing Liabilities, while typically a relatively small number, are also
                                                                                  levers that management can use to influence the Activity Ratio.
   Definition: A measurement of how well the business manages its
   scarce resources                                                               Adjusting one or more of the activity drivers will increase or decrease
                                                                                  the Activity Ratio and therefore improve or worsen ROCE.
                            Revenue
   Formula:
                      Capital Employed
Armillary Private Capital   Return on Capital Employed – Review of 2019 Returns                                                                                 31

3. Operational Efficiency – PROFITABILITY MARGIN                                  4. Return on Capital Employed – ROCE

                                                                                  The link between the Balance Sheet and Profit & Loss is dynamically
   Definition: A measurement of the Return on Sales purely from an                reflected in ROCE.
   operating perspective.

                      Earnings before interest & tax                                 Definition: The percentage return yielded from the employment of
   Formula:                                                                          scarce resources in the form of profit before interest and tax
                                  Revenue

                                                                                                       EBIT
                                                                                     Formula:                   OR       Profitability Ratio × Activity Ratio
The above formula ignores the impact of funding and concentrates on                                    CE
the entity’s ability to produce a return from revenue.

The four key profitability drivers are:                                           The interactive nature of this ratio is seen in the alternative formula
• Price: how much a business receives for the goods it sells;                     as the product of the Profitability and Activity ratios. Operational
                                                                                  and Balance Sheet efficiency are brought to life in one single ratio.
• Volume: how many goods the business sells;
                                                                                  This should be the first area of review in the process of corporate
• Cost of Goods Sold: how much it costs the business to                           performance assessment and it should be determined as to whether or
  produce the goods it sells; and                                                 not ROCE is adequate and which of its components contribute to both
• Expenses: the overhead expenses of the business                                 the strengths and weaknesses of the operational strategy.
  including depreciation.
                                                                                  Irrespective of the type of industry ROCE should at least be equal to or
Adjusting one or more of the profitability drivers will increase or decrease      greater than the weighted average cost of capital (WACC) in order for
the Profitability Ratio and therefore improve or worsen ROCE.                     a business to create shareholder value.
Armillary Private Capital   Return on Capital Employed – Review of 2019 Returns   32

   Example ROCE calculation:

   Revenue                                                            100,000
   EBIT                                                                10,000
   Profitability Ratio                                                    10%
   Capital Employed                                                    50,000
   Activity Ratio                                                          2×
   ROCE                                                         10% × 2 = 20%

It is worth noting that average Capital Employed for the period over
that which Revenue and EBIT are derived will give a better result
than just considering Capital Employed at the end of the period
being measured.

It should also be noted that ROCE does not change when EQUITY is
substituted for DEBT. This highlights the impact of ROCE being a true
operational performance measurement.

5. Interfacing Profit and Loss with the Balance Sheet

The Balance Sheet is just a snapshot of the assets and liabilities of a
business at a point in time. However, its interaction with profit and loss,
through Earnings before Interest and Tax (EBIT), provides the platform for
developing a completely dynamic analytical structure.

Two businesses, producing the same sales and return on sales can be
viewed from an operational point of view as being identical even if one
were funded by debt and the other by equity. This is because the cost
of borrowing is purely a financial issue.
Armillary Private Capital   Return on Capital Employed – Review of 2019 Returns                                                                            33

ROCE Uses                                                                         expansion is unlikely to be experienced on an ongoing basis and the
                                                                                  art of getting the forecasts correct is in challenging such ongoing
ROCE can be used in many ways by organisations and management                     expansion assumptions.
teams as a performance measure and as a tool when preparing
budgets and valuations.                                                           Forecasts for growth businesses often have the opposite issues.
                                                                                  Businesses often struggle to achieve EBIT margins in excess of 20%
One of these ways is that the management team may set ROCE goals                  on an ongoing basis. At those levels competitors are likely to enter a
for either the entire organisation or its sub-units and decision making           market and customers generally start looking elsewhere or in-housing
in respect of investing in new projects to ensure that the business is            the supply. Revenue growth will also demand additional lock up in
performing at a level that is greater than WACC.                                  working capital and additional fixed assets to support the growth.
                                                                                  Therefore, to create robust forecasts for a growth business at some
ROCE is also able to be used to set up a performance remuneration
                                                                                  juncture these charts are likely to level out and this levelling is usually
plan for management and employees. As it is simple to calculate, ROCE
                                                                                  earlier than anticipated generally because the business relaxes controls
provides a transparent model for such programs.
                                                                                  around expenditure.

                                                                                  Taking into account the ratios in the chart helps to reduce the risk of
Budgeting and Valuation                                                           making a budget or forecast error and therefore improves the quality
                                                                                  of the budget or forecast and by extension the quality of any valuation
Businesses and analysts can often make an underlying error in
                                                                                  based off the same.
budgeting or forecasting business performance that impacts a business
valuation. When undertaking a valuation, the biggest error usually arises
from utilising overly optimistic forecasts. Discount rates are generally less
                                                                                  What is a “Good” ROCE?
susceptible to such errors.
                                                                                  ROCE is a measure of a company’s profitability and its activity.
Consider the following four charts that simplistically compare
                                                                                  Quite simply, a good ROCE is a level that exceeds the WACC for the
Profitability, Activity, Capex to Revenue and ROCE ratios for a mature
                                                                                  business. Where this is the case the business will be creating value
business and a growth business. The underlying issue is that budgets
                                                                                  for its shareholders.
for mature businesses more than often assume expanding profitability,
increasing activity, reducing levels of capital expenditure for every
dollar of sales and therefore increasing ROCE. More often than
not a mature business is unlikely to see these improvements on an
ongoing basis. While some improvement is always possible continuous
Armillary Private Capital   Return on Capital Employed – Review of 2019 Returns                                                    34

                                     Profitability                                                     Activity
                                    Mature       Growth                                              Mature       Growth

 25%                                                                              3.50

 20%                                                                              3.00

  15%
                                                                                  2.50
 10%
                                                                                  2.00
   5%
                                                                                  1.50
   0%
                                                                                  1.00
  -5%

 -10%                                                                             0.50

 -15%
        0         1            2             3       4          5          6             0   1   2            3       4    5   6

                                   Capex/Revenue                                                        ROCE
                                    Mature       Growth                                              Mature       Growth

  10%                                                                             80%

   5%                                                                             60%

   0%                                                                             40%

  -5%                                                                             20%

 -10%                                                                              0%

 -15%                                                                             -20%
        0         1            2             3       4          5          6             0   1   2            3       4    5   6
You can also read