Australian Agriculture Outlook 2019 - Rural Bank

Page created by Barbara White
 
CONTINUE READING
Australian Agriculture Outlook 2019 - Rural Bank
Australian
Agriculture Outlook
2019
Australian Agriculture Outlook 2019 - Rural Bank
Australian Agriculture
Outlook 2019                                                                                           About the research
A new year prompts reflection on the year just passed and what                                         The Outlook 2019 report includes data and outlooks on
might lie ahead. In agribusiness, 2018 will be remembered for below                                    production in Australia, seasonal conditions, prices and
average rainfall up until the last month of the calendar year, the                                     demand. Significant effort has been taken to secure the
smallest winter crop for a decade on the east coast, record high wool                                  most recent data available.
and lamb prices, and high feed costs.
                                                                                                       About Ag Answers
This report focuses on 2019 and highlights influential themes for the
year ahead, as well as our expectations for agricultural markets and                                   Ag Answers is a specialist insights division of Rural Bank.
the wider economy.                                                                                     Recognising that good information is the key to making
                                                                                                       good business decisions, Ag Answers provides research
In 2019 expect subjects such as Brexit, economic slowdown, trade
                                                                                                       and analysis into commodities, farmland values, farm
disputes, European Union free trade negotiations and elections
                                                                                                       business performance and topical agricultural issues to
to play a prominent role in markets. For the agricultural sector, the
                                                                                                       enable farmers to make informed decisions.
year ahead is likely to be one where production and prices depend
heavily on rainfall. A ‘good’ season would see graziers switch to
                                                                                                       About Rural Bank
herd and flock rebuilding, with prices subsequently supported. Also,
the increasing value of horticulture exports and historically low milk                                 Rural Bank has been a wholly-owned subsidiary of
production are likely to be key themes in 2019.                                                        Bendigo and Adelaide Bank Limited since 2010. It is
                                                                                                       the only Australian-owned and operated dedicated
The price forecasts presented in this report have been calculated
                                                                                                       agribusiness bank in the country, providing exceptional
using an Auto-Regressive Integrated Moving Average model. The
                                                                                                       financial services, knowledge and leadership for
model projects a range of values based on trend, volatility, cyclical
                                                                                                       Australian farmers to grow.
and seasonal patterns in the historic data. The forward estimates are
current to mid-December 2018, future market conditions may cause
actual prices to move across and outside of the forecast range.

This report is intended to provide general information on a particular subject or subjects and is not an exhaustive treatment of such subject(s). The information herein is believed to
be reliable and has been obtained from public sources believed to be reliable. Rural Bank Limited, ABN 74 083 938 416 AFSL /Australian Credit Licence 238042, a division of
Bendigo and Adelaide Bank Limited ABN 11 068 049 178 AFSL / Australian Credit Licence 237879, make no representation as to or accept any responsibility for the accuracy
or completeness of information contained in this report. Any opinions, estimates and projections in this report do not necessarily reflect the opinions of Rural Bank and are subject
to change without notice. Rural Bank have no obligation to update, modify or amend this report or to otherwise notify a recipient thereof in the event that any opinion, forecast or
estimate set forth therein, changes or subsequently becomes inaccurate. This report is provided for informational purposes only. The information contained in this report does not
take into account your personal circumstances and should not be relied upon without consulting your legal, financial, tax or other appropriate professional.
© Copyright Rural Bank Ltd ABN 74 083 938 416 and Bendigo and Adelaide Bank Ltd ABN 11 068 049 178
Australian Agriculture Outlook 2019 - Rural Bank
Economy                                                                                                                       GDP growth – world
                                                                                                                                (year-ended)
                                                                                                        8
The 2018 calendar year commenced with relatively high optimism
amid synchronised global growth, and in January we saw stock                                            6

exchanges reach record highs in a range of countries. However, as
                                                                                                        4
the year unfolded, sentiment declined and uncertainty increased.

                                                                                              Percent
Much of this divergence can be linked to US trade policy, which                                         2
admittedly was consistent with President Trump’s election
                                                                                                        0
promises, but its impact was underestimated by the markets.
                                                                                                        -2
Global growth is likely to average just below four per cent over
2018, which is the fastest pace seen since the 2010/11 rebound                                          -4
post the financial crisis of 2007/08. However, growth appears                                                   2002          2006     2010       2014        2018

to have peaked around this level. Advanced economies have                                                                  World**         Major trading partners*
achieved a growth rate of around 2.5 per cent this year, and
emerging economies closer to five per cent. Beyond the impact
of trade tensions, the global growth trajectory is challenged by
                                                                                                                    Base metals, rural and oil prices
rising US interest rates (which in turn have impacted funding                                                                  (weekly)
costs for a range of markets) and uncertainty in the European                                 175                                                                    150
Union, especially related to Brexit negotiations and the new Italian
government’s fiscal plans.                                                                    150                                                                    125

Commodity prices had been holding on to solid gains in the first                              125                                                                    100

                                                                                                                                                                           US$/b
                                                                                      Index

half of the year until a sharp sell-off in the oil price in October,
                                                                                              100                                                                    75
which coincided with another bout of volatility in equity prices.
The lower oil price appears to be driven by higher than anticipated                             75                                                                   50
production, rather than just lower expected demand next year.
                                                                                                50                                                                   25
This may not be predictive of an even sharper slowdown, but it is
likely to keep inflation around the globe subdued at a time most                                25                                                                   0
central banks would prefer to see a higher inflation rate. This fall                                         2008      2013     2018    2008      2013      2018
in oil prices coincided with a decrease in bulk commodity prices,                                                   Base metals*       Rural*         Brent oil
although Chinese steel production demand is persistent.
Looking ahead to 2019, the expected themes for the global
                                                                                    While we may face the prospect of a slowing global economy, it is
economy include:
                                                                                    decelerating from a recent high. The path of the US dollar as their
•	Trade developments and economic policy responses arising                         cycle approaches a possible turning point is going to be important.
   from the US – China dispute, which may include China                             As US rates rise, the US dollar should remain strong, but if the US
   placing on hold measures addressing debt, shadow banking                         economic cycle peaks more quickly it may also cause a volatile
   and risks in their property market, some of which may impact                     reversal. Volatility in equities is likely to match this trend.
   commodity prices.
                                                                                    The domestic economy appeared healthy in 2018, exhibiting
•	The US stock ‘bull market’ is approaching 10 years, which                        strong economic and jobs growth, but failed to deliver in a number
   is a record-long upswing. As US rates rise there is a growing                    of other areas, especially asset prices and household wealth.
   risk that this cycle may be drawing to a close, which would                      Annual Australian GDP growth picked up to 3.1 per cent in the
   add volatility to a range of markets. US official interest rates                 second quarter before slowing in the third quarter to 2.8 per cent.
   are likely to rise to around three per cent next year, which                     While its recent downward revision was a surprise, growth still
   will challenge equity valuations, and the accelerating pace                      compares favourably to Australia’s international peers.
   of technology disruptions will add further volatility to valuing
                                                                                    The jobs market also performed strongly throughout the year, with
   businesses.
                                                                                    an increase of around 25,000 jobs per month on average and the
•	Brexit, Italy and a rising populism in the EU may also add to                    unemployment rate improved from 5.5 per cent at the start of the
   volatility. Also, the European Central Bank is expected to end                   year to five per cent, its lowest level for over six years. Despite the
   their asset purchase program and to exit negative interest                       falling jobless rate and a rising participation rate, wages growth
   rates later next year. A decade on from the financial crisis, the                was the missing link indicating that there was still spare capacity in
   unwinding of stimulus is still evolving.                                         labour markets.

GDP growth – world                                       Base metals, rural and oil prices
* Weighted using Australian export shares                * RBA Index of Commodity Prices sub-indices, SDR terms, 2007
** PPP-weighted, accounts for 85 per cent of world GDP   Sources: Bloomberg, RBA, Ag Answers
Sources: ABS, CEIC Data, IMF, RBA, Refinitiv
Australian Agriculture Outlook 2019 - Rural Bank
Real average earnings per hour                                                       Stratified median housing prices
           150                                                                                                           (log scale)
                                                                                               950                                                                       950
           140
                                                                                                               Sydney
                                                                                               850                                                                       850
           130                                                                                                                    Melbourne      Capital cities
                                                                                               750                                                                       750
   Index

                                                      Avg. 1.9%

                                                                                      $ ’000

                                                                                                                                                                               $ ’000
           120                                                                                 650   Perth                   Brisbane     Canberra                       650

           110                                                                                 550                                                                       550
                                                                                                                       Adelaide               Darwin   Regional*
                                                                                               450                                                                       450
           100
                                                                                               350                                                                       350
            90                                                                                                                                         Hobart
                 1998         2003          2008         2013          2018                    250                                                                       250
                                                                                                      2008      2013       2018         2008       2013           2018

The Wages Price Index rose marginally this year. However, real                                 •	Infrastructure investment and public spending: the infrastructure
average earnings, after years of close to two per cent gains in real                              pipeline is already at high levels and is likely to build over the
terms driving improved standards of living, have barely improved                                  course of 2019, which should help the private sector and jobs
since 2013, so wages growth is not keeping ahead of living costs.                                 growth.
This disconnect between economic growth and perceptions of
                                                                                               •	The Federal election may cause uncertainty to build around
household wealth is not being helped by falling asset prices, most
                                                                                                  changes to policy, including changes to negative gearing, capital
notably housing prices and equity markets. While housing prices
                                                                                                  gains tax concessions and franking credits.
are not falling in all areas, and there is considerable variation
between capital cities and between regional properties, the decline                            •	The global slowdown and trade challenges leaves the outlook
in Sydney and Melbourne is significant. From peak to trough,                                      for China and other key trade partners in doubt, although we
Sydney is now off 9.5 per cent, close to its record decline in 1989                               still expect China to achieve a soft landing and still show strong
to 1991, and Melbourne is similarly down 5.8 per cent on average                                  demand for agricultural products.
since its peak in November 2017. These falls need to be put into
                                                                                               •	The tightening in lending standards which has been underway
the perspective of the preceding rises, and thus far have mainly
                                                                                                  for some years via APRA regulatory policy (enforcing lower
been driven by falls in investor lending rather than ‘owner occupier’.
                                                                                                  levels of investor and ‘interest only’ lending) may start to spread
All the same, softening housing markets may be indicative of risks
                                                                                                  from the housing market to having an impact on business
ahead in credit growth, and also risks to household consumption
                                                                                                  lending (SME and agribusiness), in the wake of the Royal
and discretionary spending. From an agricultural perspective, farm
                                                                                                  Commission into Misconduct in the Banking, Superannuation
land as an asset class has averaged annual growth in median
                                                                                                  and Financial Services Industry.
price per hectare of 5.2 per cent nationally over the last five years.
Strong competition for farm land driven by fewer listings is leading                           Looking towards 2019, the lower level of the Australian dollar is
to higher prices, a trend that looks set to continue into 2019.                                likely to continue to help export markets, and given the benign
                                                                                               outlook for inflation (especially with the recent fall in the oil price),
Other emerging themes for the domestic economy in 2019 include:
                                                                                               the RBA official cash rate is likely to remain at its current record
•	A budget surplus is likely to be announced on the early                                     low for much of the year. Growth is likely to be a little slower and
   Federal Budget date of 2 April. This earlier date is due to the                             offshore risks abound.
   Federal election likely to be held in May. Being back in surplus
   underscores the relative strength of Australia’s fiscal position
   and Australia’s relatively low levels of government debt (as a
   percentage of GDP).

Real average earnings per hour                                                     Stratified median housing prices
* Deflated by the HouseholdFinal Consumption Expenditure Implicit Price            * Measured as areas outside capital cities.
Deflator: straight lines denote linear trend; label shows average annual growth.   Sources: APM, RBA, Ag Answers
Sources: ABS, RBA
Australian Agriculture Outlook 2019 - Rural Bank
Cattle
Australian cattle producers entered 2018 with intentions to retain
stock and rebuild herd numbers, but seasonal conditions have
been poor in many regions. Many producers opted to destock in
response to low rainfall and high feed costs, which led to slaughter
rates trending higher, up 10.2 per cent for the year to October.
Increased supply combined with weaker restocker demand led to
an easing in prices. The Eastern Young Cattle Indicator (EYCI) fell
22 per cent from a high of 567c/kg in March to a low of 445c/kg
in August. Prices reached their lowest point since April 2015.
Even so, the annual average price of 509c/kg is still high from a
historical perspective at 15 per cent above the 10-year average.
Prices eased but avoided a collapse in part due to growing export
demand, particularly from China, Japan and South Korea. The
support from export markets was surprising given 2018 was a
record year for global beef production and exports. Fortunately,
demand rose to absorb the higher supply. Australian export
volumes were up 12.5 per cent for the year to October, but despite
this Australian beef still attracted a 2.7 per cent increase in
average unit value.
Cattle prices in 2019 will be supported by lower supply and
continued strong export demand. Supply should be lower than
2018 with producers looking to manage current herd sizes until
seasonal conditions improve. An improvement in conditions will
allow producers to retain stock, particularly females, tightening
supply further. Global supply and demand factors should offer
some support for Australian prices with import demand expected
to match another record year of beef production and exports.
Import growth is expected to be strongest from China but also
                                                                                                                                    The competitiveness of Australian beef exports to Japan will
from traditional markets of the US, Japan and South Korea.
                                                                                                                                    benefit from a 12.5 per cent tariff advantage over the US thanks
                                                                                                                                    to the Comprehensive and Progressive Agreement for Trans
                                                                                                                                    Pacific Partnership (CPTPP) coming into effect. However, growth
                                 Cattle prices to be mostly determined                                                              in exports out of the US and tighter supply from Australia is likely
                                    by seasonal conditions in 2019                                                                  to see the US continue to capture market share in Japan and
                  800                                                                                                               South Korea at Australia’s expense. Nonetheless, both countries
                  700
                                                                                                                                    will continue to be high value markets for Australia and high export
                                                                                                                                    prices should persist. Australian exporters may also benefit from
                  600
                                                                                                                                    growing demand from China, particularly in the premium segment
  EYCI c/kg cwt

                  500                                                                                                               where the US has very low market share. Export markets will
                  400                                                                                                               experience competitive pressure, but the strength of demand
                  300                                                                                                               should give some assistance to domestic prices in Australia.
                  200                                                                                                               Seasonal conditions will be the most significant factor driving
                  100                                                                                                               the direction of prices in 2019. Dry conditions would see prices
                                                                                                                                    continue to ease and follow the lower 68 per cent confidence
                   0
                                                                                                                                    interval, falling below 500c/kg. Significant rainfall would see
                        Jan 14

                                 Jul 14

                                          Jan 15

                                                   Jul 15

                                                            Jan 16

                                                                     Jul 16

                                                                              Jan 17

                                                                                       Jul 17

                                                                                                Jan 18

                                                                                                         Jul 18

                                                                                                                  Jan 19

                                                                                                                           Jul 19

                                                                                                                                    a return to herd rebuilding activity. A tightening of supply and
                                                                                                                                    strengthened restocker demand would see prices rise along the
                                 95% Confidence interval                               68% Confidence interval
                                                                                                                                    upper 68 per cent confidence interval towards 600c/kg.

Sources: Meat and Livestock Australia, Ag Answers
Australian Agriculture Outlook 2019 - Rural Bank
Cropping                                                                                                                   The East Coast production deficit is
                                                                                                                         expected to see Australian wheat prices
In 2018 we saw a 30 per cent increase in the value of Chicago                                                                remain elevated until late 2019
Board of Trade (CBOT) wheat futures in Australian dollar terms                                                550
and domestic values have responded with Newcastle APW wheat

                                                                                APW1 del. Geelong AUD/tonne
                                                                                                              500
firming 60 per cent year-on-year. Strong premiums have been                                                   450
built into domestic markets, reflecting the east coast feed grains                                            400
shortage and in turn supporting local values at levels above                                                  350
export parity.                                                                                                300
                                                                                                              250
If widespread rain eventuates in 2019, subsequent pasture
                                                                                                              200
rejuvenation and a move by livestock producers towards restocking
                                                                                                              150
may result in reduced demand for feed grains. However, even with
                                                                                                              100
rainfall, the severity of the east coast feed grain deficit makes it
                                                                                                               50
difficult to see any meaningful changes to domestic supply and

                                                                                                                    Jan 14

                                                                                                                             Jul 14

                                                                                                                                      Jan 15

                                                                                                                                               Jul 15

                                                                                                                                                        Jan 16

                                                                                                                                                                 Jul 16

                                                                                                                                                                          Jan 17

                                                                                                                                                                                   Jul 17

                                                                                                                                                                                            Jan 18

                                                                                                                                                                                                     Jul 18

                                                                                                                                                                                                              Jan 19

                                                                                                                                                                                                                       Jul 19
demand pressures until late 2019.
Barley markets have followed a similar trend to wheat in 2018,                                                               95% Confidence interval                               68% Confidence interval
with Port Adelaide feed barley values up 45 per cent year-on-year.
China’s recent anti-dumping investigation into Australian barley
exports has brought an air of uncertainty to barley markets.                  In summary, domestic feed markets are expected to be the key
While these claims are not expected to be upheld, China is a                  driver of values in 2019. An estimated 3.5 to four million tonnes
significant trade partner accounting for 75 per cent of Australia’s           of grain will be brought in to the east coast from South Australia
barley exports in the 12 months to October 2018. Continued                    and Western Australia over the 12 months to October 2019, in
access to the Chinese market will be a key determinant of barley              order to meet domestic demand ahead of the 2019 season crop.
values in 2019.                                                               A return to average conditions would see an Australian wheat
                                                                              crop in 2019 of 24 to 25 million tonnes, a 50 per cent increase
Oilseed markets, and soybeans in particular, remain weighed down              on the 2018 season, but five per cent below the five-year average.
by the uncertainty of the China – US relationship. This pressure              Notwithstanding any significant developments in offshore markets,
has also spilled over into global canola markets. In 2019, we will be         we would expect the current price environment to continue into
paying close attention to growing season conditions in Europe and             late 2019 when the new season crop, if successful, may bring
Canada, which account for a combined 55 to 60 per cent of global              some supply side relief to the domestic balance sheet.
canola production.
                                                                              The Indonesia – Australia Comprehensive Economic Partnership
In pulse markets, Indian import tariffs remain a key challenge                Agreement is expected to come into effect by 2020. This will
to values. Australian trade officials in India see no easing of               include provisions for duty free imports of up to 500,000 tonnes of
trading restrictions until the end of 2019 at the earliest. Although          feed grains from Australia to Indonesia, increasing by five per cent
Australian chickpeas have been able to find homes in alternate                annually. While Indonesia has typically been an important trade
export markets (including Pakistan and Bangladesh) burgeoning                 partner for Australian milling wheat, Indonesia consumes 17 to 18
global stocks of lentils have driven strong competition in export             million tonnes of feed grain annually. For this reason, feed grain
markets. In the absence of opportunities into India, lentils continue         markets in Indonesia could present a significant opportunity for the
to price as a protein source in domestic feed rations. Domestic               Australian grains industry over the longer term.
feed markets also continue to underpin values for lupins and
field peas.
Faba bean values shot to new heights in 2018, reflecting strong
Egyptian demand for Australian product against a backdrop of
poor production globally. We expect Australian values to ease in
mid-2019 following the harvest of the new season crops across
Europe.

Sources: Profarmer Australia, Australian Crop Forecasters, USDA, Ag Answers
Australian Agriculture Outlook 2019 - Rural Bank
Dairy                                                                                            Growth in global milk supply is expected
                                                                                                  to put pressure on SMP prices in 2019
Australian milk supply is down four per cent due to dry seasonal
                                                                                     6,000
conditions and high input prices. We expect 2018/19 milk
production to finish at nine billion litres. Production in most states               5,000
will be lower this season. However, Tasmania is growing supply due
                                                                                     4,000

                                                                         AUD/tonne
to more favourable seasonal conditions combined with higher farm
gate milk prices, and South Australia is continuing its return to                    3,000
2015/16 supply levels.
                                                                                     2,000
Looking ahead to the first six months of 2019, we expect the
Global Dairy Trade skim milk powder price to average around                          1,000
$2,600/tonne, 2.2 per cent lower than the current December
                                                                                        0
price. The average Global Dairy Trade cheddar price for the first

                                                                                             Jan 14

                                                                                                       Jul 14

                                                                                                                Jan 15

                                                                                                                         Jul 15

                                                                                                                                  Jan 16

                                                                                                                                           Jul 16

                                                                                                                                                    Jan 17

                                                                                                                                                             Jul 17

                                                                                                                                                                      Jan 18

                                                                                                                                                                               Jul 18

                                                                                                                                                                                        Jan 19

                                                                                                                                                                                                 Jul 19
half of 2019 is forecast to be $4,100/t, which is 4.9 per cent lower
than the current December price. Downward price pressure is
                                                                                                      95% Confidence interval                                68% Confidence interval
expected to come from increased milk production in New Zealand.
This will be partially offset by more modest growth in milk supply in
the EU and a decrease in supply from Australia.
Export demand has become more consistent – driven largely by
China. With milk supply falling, the scenario for Australian exporters                                Cheese prices are expected to decline
is essentially doing the same volume of trade with less milk. This                                     in 2019 due to increasing production
creates strong competition for milk and the prospect of higher farm                  7,000

gate prices. Milk powder exports for the 2018 calendar year are                      6,000
expected to finish 2.6 per cent higher by volume, driven by a 14 per
                                                                                     5,000
cent increase in exports to China. The volume of cheese exports is
                                                                         AUD/tonne

expected to end 2018 1.2 per cent higher. Demand for exports is                      4,000
expected to remain stable in 2019 however volume and value of
                                                                                     3,000
exports could be lower due to falling milk production in Australia.
                                                                                     2,000
We are expecting an average farm gate milk price of $6.10/kg MS
                                                                                     1,000
in southern dairy states this financial year. However, given supply
is low, the average price could climb further. Before the milk price                    0
drop of 2016, the farm gate price averaged $6.24/kg MS which
                                                                                             Jan 14

                                                                                                       Jul 14

                                                                                                                Jan 15

                                                                                                                         Jul 15

                                                                                                                                  Jan 16

                                                                                                                                           Jul 16

                                                                                                                                                    Jan 17

                                                                                                                                                             Jul 17

                                                                                                                                                                      Jan 18

                                                                                                                                                                               Jul 18

                                                                                                                                                                                        Jan 19

                                                                                                                                                                                                 Jul 19

isn’t far away from the current average indicating milk prices are
trending higher.                                                                                      95% Confidence interval                                68% Confidence interval

Sources: Global Dairy Trade, Dairy Australia, GTIS, Ag Answers
Horticulture – vegetables
Vegetable prices in Australia increased gradually during 2018 as a
result of not having the seasonal overlap across production regions
experienced in 2017. We expect the weighted average price index
for vegetables to increase by around one per cent during the first
half of 2019. Demand for vegetables in the domestic market is
consistent, prompting the industry to look to export markets to
boost demand in 2019.
The value of Australian vegetable exports is expected to finish
2018 at $281.5 million, 13 per cent higher than 2017. This
increase in value was spread across several countries. Australia’s
largest market by value is Singapore, where export value increased
four per cent due to an increase in broccoli and cauliflower exports.
Exports to Saudi Arabia rose by 53 per cent in value, due to an
increase in carrot exports. Other top performing commodities
included tomatoes, potatoes and onions. We expect five per cent
growth in the value of vegetable exports in 2019. There could
be further upside if emerging markets repeat the buying pattern
shown in 2018.
Potato exports grew 35 per cent by volume and 33 per cent by
value in 2018. The Philippines and Thailand are two emerging
potato markets, importing $2.83 million and $2.79 million of
Australian potatoes respectively. These markets are not regular
importers and it remains to be seen if they grow again in 2019.
Carrot exports have increased 3.8 per cent by value and 6.3
per cent by volume during 2018. This growth came from Japan
and Saudi Arabia. Saudi Arabia is becoming a major importer of
Australian carrots, with consistent growth in value over the last
three years, making it an important market in 2019.

                        The weighted average vegetable                                                                                             The value of Australian vegetable
                        price index trended higher in 2018                                                                                            exports is growing steadily
     140                                                                                                                              350
     130
                                                                                                                                      300
     120
                                                                                                                                      250
     110
                                                                                                                        Million AUD

     100                                                                                                                              200

      90                                                                                                                              150
      80
                                                                                                                                      100
      70
      60                                                                                                                               50

      50                                                                                                                               0
            Jan 14

                     Jul 14

                              Jan 15

                                       Jul 15

                                                Jan 16

                                                         Jul 16

                                                                  Jan 17

                                                                           Jul 17

                                                                                    Jan 18

                                                                                             Jul 18

                                                                                                      Jan 19

                                                                                                               Jul 19

                                                                                                                                            2015        2016     2017     2018E    2019F

                     95% Confidence interval                               68% Confidence interval

Sources: AusMarket, ABS, GTIS, Ag Answers
Horticulture – fruit
The weighted average fruit price index showed less fluctuation          2018, retaining the 37 per cent growth of 2017. Japan imported
across 2018 compared to 2017. We expect moderate growth                 29.9 per cent more table grapes in 2018, lifting imports above
in the fruit price index of five per cent for the first half of 2019.   10,000 tonnes for the first time. We expect three per cent growth
Domestic fruit consumption is growing, coupled with increasing          in the export value of Australian table grapes in 2019.
export exposure which is likely to create more demand for fruit in
2019. This could have a positive impact on price.
The value of Australian fruit exports is expected to finish the 2018
calendar year seven per cent higher than 2017. The increase in                                         The weighted average fruit price index
value has largely come from China, which is up 25 per cent due                                           is expected to trend higher in 2019
to growth in fresh orange exports, which were 37 per cent higher                        140
in 2018. We expect Australian fruit exports to increase by 10 per
                                                                                        120
cent in value in 2019 due to growing citrus, stone fruit and cherry
exports to China and Hong Kong.                                                         100

In the domestic market, mango production has been more                                   80

consistent this season. As a result, domestic prices for Kensington                      60
Pride mangoes were up 18.7 per cent. Price is expected to remain
                                                                                         40
consistent into early 2019.
                                                                                         20
Table grape production is expected to increase by 18 per cent
during 2018/19. Harvested area is forecast to be nine per cent                            0
                                                                                              Jan 14

                                                                                                         Jul 14

                                                                                                                  Jan 15

                                                                                                                           Jul 15

                                                                                                                                    Jan 16

                                                                                                                                             Jul 16

                                                                                                                                                      Jan 17

                                                                                                                                                               Jul 17

                                                                                                                                                                         Jan 18

                                                                                                                                                                                  Jul 18

                                                                                                                                                                                           Jan 19

                                                                                                                                                                                                    Jul 19
higher and favourable seasonal conditions are expected to lift
yields. International demand is strong particularly from China and
Japan. The volume of exports to China were 1.4 per cent higher in                                       95% Confidence interval                                68% Confidence interval

                         The value of Australian fruit exports is                                           The value of Australian table grape
                           experiencing year-on-year growth                                                       exports has plateaued
                  900                                                                   450
                  800                                                                   400
                  700                                                                   350
                  600                                                                   300
    Million AUD

                                                                          Million AUD

                  500                                                                   250
                  400                                                                   200
                  300                                                                   150
                  200                                                                   100
                  100                                                                    50
                   0                                                                     0
                        2015     2016       2017   2018E     2019F                                     2015                2016                 2017                    2018E              2019F

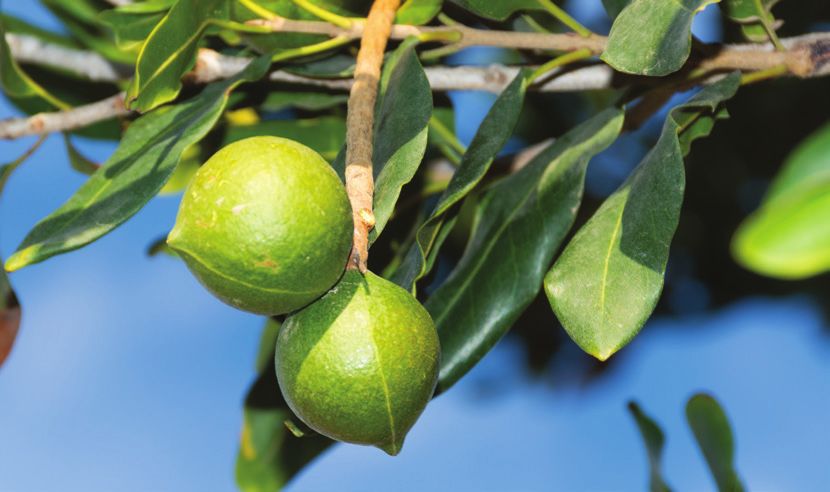
Sources: Ausmarket, ABS, GTIS, Ag Answers
Horticulture – nuts
                                                                                             The value of Australian nut exports
The export value of Australian nuts increased in 2018 largely                                  has been increasing since 2017
due to higher prices. The value of nut exports is expected to end               1,200
2018 around $813.5 million, which is 10 per cent higher than
                                                                                1,000
2017. Given the higher prices being paid for Australian nuts, we
are forecasting the value of exports to grow by five per cent in                    800

                                                                      Million AUD
2019. There may be further upside if volume increases to key
markets, such as India for almonds and China for macadamias.                        600

Macadamia exports were down 12.6 per cent by volume in 2018                         400
due to lower quantities being exported to Vietnam and China.
                                                                                    200
Export price per kilogram has increased particularly for shelled
macadamias, up 24.5 per cent to $22.38/kg compared to 2017.                          0
This is largely due to increased demand from Japan which is a                             2015     2016     2017     2018E    2019F
high value market compared to China.
Almond exports have increased 2.5 per cent by volume in 2018
driven by demand from China. Price per kilogram is up by 14.1
per cent compared to 2017.
Almond milk is the fastest growing category in the non-dairy
milk market. As consumers transition to almond milk, it would
be reasonable to assume that their preference will be directed
at almond milk made from Australian almonds. While this may
not produce market shifting growth for Australian almonds in the
short term, it will aid demand diversity by providing an additional
use for almonds.

Sources: GTIS, Ag Answers
Sheep
Australian lamb and mutton prices continued their exceptional run
in 2018. Lamb prices averaged higher for a sixth consecutive year,
and mutton recorded a fifth year of growth. The value of Australian
sheep meat exports is set to hit a record high for 2018 with strong
demand driving high prices.
In 2018, the Eastern States Trade Lamb Indicator (ESTLI)
averaged 684c/kg, 9.3 per cent higher than 2017, and included
a record high of 884c/kg in late August. While prices were strong,
dry seasonal conditions led to a 2.4 per cent increase in lamb
slaughter for the year to October which flowed through to export
markets. The value of lamb exports was 13.1 per cent higher for
the year to October, supported by increased demand and lower
Australian dollar.
National mutton prices averaged 443c/kg in 2018. This was
only one per cent higher than 2017, but displayed remarkable
resilience under the weight of a 29 per cent increase in slaughter
for the year to October as many producers reduced flock numbers
in response to dry conditions. Export markets absorbed the
increased supply, led by China where mutton exports nearly
doubled in value.
Lamb and mutton markets are expected to be characterised by
tight supply and strong export demand in 2019, leading to higher
prices. Supply will be lower in 2019 for several reasons. Firstly,
the high sheep slaughter rates of 2018 will not be repeated as
producers will be looking to manage current flocks until seasonal
conditions improve. Secondly, the increased sheep slaughter in
2018 will have reduced the national flock, meaning fewer lambs
are available in autumn, and fewer ewes to be joined for lambing
later in the year. Significant rainfall could further stem the supply of
sheep if it allows producers to retain more stock to rebuild flocks.                                                                   While supply will tighten, demand is showing no signs of
                                                                                                                                       weakening. Growing consumption in the US and Middle East will
                                                                                                                                       continue to provide strong demand for Australian sheep meat
                                   Lamb prices to average higher in 2019                                                               exports. But continued growth to China will be the market to
                                       for the seventh year on a row                                                                   watch in 2019 after showing incredibly strong demand in 2018.
                    900                                                                                                                Australian exports will continue to benefit from lower volumes
                    800
                                                                                                                                       exported from New Zealand and a low Australian dollar.
                    700                                                                                                                Rural Bank modelling forecasts the ESTLI to spend much of 2019
   ESTLI c/kg cwt

                    600                                                                                                                above 700c/kg. The seasonal trend in lamb prices means they
                    500                                                                                                                will drop below 700c/kg at times, but expect to see a seventh
                    400                                                                                                                consecutive year of growth in the average annual price. Mutton
                    300                                                                                                                prices are expected to see a greater increase than lamb prices,
                    200
                                                                                                                                       driven by a larger decline in supply. Expect to see mutton prices
                                                                                                                                       regularly exceeding 500c/kg.
                    100
                     0
                          Jan 14

                                    Jul 14

                                             Jan 15

                                                      Jul 15

                                                               Jan 16

                                                                        Jul 16

                                                                                 Jan 17

                                                                                          Jul 17

                                                                                                   Jan 18

                                                                                                            Jul 18

                                                                                                                     Jan 19

                                                                                                                              Jul 19

                                   95% Confidence interval                                68% Confidence interval

Sources: Meat and Livestock Australia, Ag Answers
Wool
For the first two thirds of 2018 the wool market continued to                         In 2019, the theme in Australia will be fewer sheep shorn, less
trend higher as it had done during 2016 and 2017. The Eastern                         wool cut per head and therefore less wool produced. Estimates are
Market Indicator (EMI) climbed to record nominal highs, peaking                       for six to 10 per cent less wool produced in 2018/19 compared
at 2116c/kg in mid-August before closing the calendar year at                         with the previous year. There will be no supply shock to the wool
1849c/kg.                                                                             market. The Australian flock rebuild stalled during the 2018 winter
                                                                                      as the dry conditions in New South Wales made it difficult to
After retreating from the record high during the second half of
                                                                                      continue to grow numbers. Beyond 2019, the Australian sheep
2018, the EMI found support above 1750c/kg (80th percentile).
                                                                                      flock and wool production could take years to establish a strong
The record nominal price highs were equivalent to the fourth
                                                                                      growth trend.
highest inflation adjusted prices since the 1930s.
                                                                                      There are several demand side variables impacting the wool
The three year long wool bull market has both supply and demand
                                                                                      market that deserve close attention in 2019. The health of the
drivers. On the supply side, the Australian sheep flock and wool
                                                                                      global economy will influence the wool demand, as Australian wool
production have dropped to historic lows, limiting the volume of
                                                                                      is largely consumed in China, Europe and the USA and demand is
wool supplied. Dry conditions throughout 2018 and less stock
                                                                                      exposed to luxury spending patterns.
on hand have also contributed to tighter supply. The number of
bales offered is lower by 18 per cent, year-on-year. Similarly,                       The US – China trade dispute and Brexit both have the potential
New Zealand’s sheep flock has been in decline for a decade,                           to undermine global growth and confidence, which could have
contributing to the tightening of supply on the world market.                         indirect consequences for wool demand. Looking just at the
                                                                                      Chinese economy, growth and sentiment could be softer in 2019.
On the demand side, the value of Australian wool exports
                                                                                      The China stock market has been under pressure in 2018, with
increased to $3.9 billion (+22 per cent) in 2017/18, which was
                                                                                      the Shanghai Composite down by 27 per cent year to date and the
entirely due to higher prices, indicating strong demand. Although
                                                                                      Chinese currency has dropped by seven per cent compared with
it is only mid-season for northern hemisphere apparel sales, the
                                                                                      US dollar.
recent support in the wool market at 80th percentile prices (which
is approximately the price level accepted by the apparel market in                    Australian wool auctions resume in the week commencing
the last northern hemisphere winter) suggests continued strong                        7 January 2019.
demand for wool products.
The market fundamentals that pushed wool prices higher over
the past three years are expected to remain at a similar setting in
2019. On that basis, the EMI is expected to track within the 68 per
cent confidence range of the forecast.

                      The volume of wool bales offered                                                           The EMI is likely to remain supported in 2019
                              is trending lower
    250,000                                                                                               2400
                                                                                                          2200
                                                                                                          2000
    200,000
                                                                                                          1800
                                                                                         EMI c/kg clean

                                                                                                          1600
    150,000                                                                                               1400
                                                                                                          1200
    100,000                                                                                               1000
                                                                                                           800
                                                                                                           600
     50,000
                                                                                                           400
                                                                                                           200
          0                                                                                                  0
              Jan

                    Feb

                          Mar

                                Apr

                                      May

                                            Jun

                                                  Jul

                                                        Aug

                                                              Sep

                                                                    Oct

                                                                          Nov

                                                                                Dec

                                                                                                                 Jan 14

                                                                                                                          Jul 14

                                                                                                                                   Jan 15

                                                                                                                                            Jul 15

                                                                                                                                                     Jan 16

                                                                                                                                                              Jul 16

                                                                                                                                                                       Jan 17

                                                                                                                                                                                Jul 17

                                                                                                                                                                                         Jan 18

                                                                                                                                                                                                  Jul 18

                                                                                                                                                                                                           Jan 19

                                                                                                                                                                                                                    Jul 19

                     2015              2016              2017             2018
                                                                                                                          95% Confidence interval                               68% Confidence interval

Sources: ABARES, AWEX, AWTA, Ag Answers
For report enquiries:

AG ANSWERS
P 1300 796 101
E ag.answers@ruralbank.com.au

For banking enquiries:

RURAL BANK
P 1300 660 115
W ruralbank.com.au

ELDERS
P 1300 618 367
E bankmarketing@elders.com.au

(1258559–1258558) (12/18)

ruralbank.com.au
You can also read