FY'18 Results and 2019-'21 Plan TIMe to deliver and delever - TIM Group February 22nd, 2019 - Telecom Italia

Page created by Wanda Flores
 
CONTINUE READING
FY'18 Results and 2019-'21 Plan TIMe to deliver and delever - TIM Group February 22nd, 2019 - Telecom Italia
TIM Group

FY’18 Results and 2019-’21 Plan
TIMe to deliver and delever
February 22nd, 2019

Luigi Gubitosi
Piergiorgio Peluso
FY'18 Results and 2019-'21 Plan TIMe to deliver and delever - TIM Group February 22nd, 2019 - Telecom Italia
Safe Harbour

This presentation contains statements that constitute forward looking
                                                                              Such forward looking statements are not guarantees of future performance
statements regarding the intent, belief or current expectations of future
                                                                              and involve risks and uncertainties, and actual results may differ materially
growth in the different business lines and the global business, financial
                                                                              from those projected or implied in the forward looking statements as a result
results and other aspects of the activities and situation relating to the
                                                                              of various factors.
TIM Group.

                                                                              The FY 2018 results include the effects arising from the adoption, starting from 1

The financial results of the TIM Group are prepared in accordance with        January 2018, of the new standards IFRS 9 (Financial Instruments) and IFRS 15

the International Financial Reporting Standards issued by IASB and            (Revenue from Contracts with Customers). To enable the year-on-year

endorsed by the EU (IFRS). The accounting policies and consolidation          comparison of the economic and financial performance, this presentation shows

principles adopted in the preparation of the financial results for the FY18   “comparable” statement of financial position figures and “comparable” income

and the 19-21 Industrial Plan have been applied on a basis consistent         statement figures, prepared in accordance with the previous accounting

with those adopted in the 2017 Consolidated Financial Statements.             standards applied (IAS 39, IAS 18, IAS 11, and relative Interpretation).
                                                                              The FY18 results have not yet been verified by independent auditors.
                                                                              Segment information is consistent with the prior periods under comparison.

                                                                                                                                                                   1
FY'18 Results and 2019-'21 Plan TIMe to deliver and delever - TIM Group February 22nd, 2019 - Telecom Italia
FY’18 Results and 2019-’21 Plan

 1   CEO Introduction

 2   2018 Highlights

 3   2019-’21 Strategic Plan

 4   Outlook

                                  2
CEO Introduction
Where TIM stands today
Unique assets                                                  Unresolved issues
                                                               •   Resiliency in top-line at the expense of:
  Longstanding brand value and awareness
                                                                   – Rising cost structure
                                                                   – Cash-flow erosion
  Largest customer base in Italy                                     ▫ Working capital absorption
                                                                     ▫ Increasing need for investments
  Most complete "one-stop-shop" offering for B2B               •   Strategic priorities identified by previous plans still
                                                                   not executed

  Largest commercial footprint across all segments
                                                               •   Employees engagement

  Best mobile network quality and fixed backbone               •   Short term and tactical business conduct
  infrastructure

                                                               •   Siloed, functionally and geographically fragmented
  Best performing player in the Italian market, resilient to       organization
  challenging market environment on top line …

                                                                                                      FY’18 Results and 2019-’21 Plan
                                                                                                                                        3
CEO Introduction
The First 100 Days

        Revamp            • Revamp management team: new managers appointed
      Culture and         • Delivery Units launched: focus on execution
      Organization        • People Accountability

                          • Network sharing partnership with Vodafone Italia on both active and passive infrastructure
                                 — Signed non-binding memorandum of understanding
                                 — Active sharing: partnership for 5G technologies
         Strategic               — Passive sharing: potential Business Combination of respective passive infrastructures
        Initiatives       • Potential partnership in fiber roll-out with Open Fiber
                                 — NDA signed and advisors appointed
                                 — Both parties are exploring all potential options with the objective of maximising synergy
                                    realisation, including full business combination
                          • Persidera: received an additional non-binding offer, started exclusive negotiations

  2019-2021 Strategic     • Execution: discipline, focus and simplicity
  plan: TIMe to deliver   • Revamp domestic business: value and quality positioning, modernization, efficiency
      and delever         • Further develop Brazil: ride growth waves and efficiency plan

                                                                                                         FY’18 Results and 2019-’21 Plan
                                                                                                                                           4
CEO Introduction
Network Sharing Partnership with Vodafone Italia
Principles of the Transaction

                        • TIM and Vodafone Italia signed a non-binding memorandum of understanding to enter into a new
     Current status
                          network sharing agreement

                        • Accelerate and enhance the deployment of 5G technology and use network infrastructure more
                          efficiently
                        • Expansion of existing passive sharing agreement and potential Business Combination of Inwit and
       Transaction        Vodafone Italia passive infrastructure in a single entity
        rationale
                        • Active network sharing partnership
                        • Open architecture approach: competitors welcome
                        • Co-operation to upgrade their respective fibre transmission networks for mobile backhauling

                        • No mandatory tender offer on Inwit will be triggered
       Transaction
                        • Parties will have equal shareholding and governance rights
        structure
                        • Closing – subject to all necessary regulatory approvals – is expected by end of 2019

                                                                                                        FY’18 Results and 2019-’21 Plan
                                                                                                                                          5
CEO Introduction
Network Sharing Partnership with Vodafone Italia
Expansion of existing passive sharing agreement and new active network sharing agreement

                                      Description                                    Envisaged Benefits

                    • Expansion of current passive sharing agreement     • Accelerate deployment of 5G
                      to a nationwide agreement                          • Increased infrastructure mutualisation
       Passive
                    • Potential Business Combination of Inwit and        • Cost / CAPEX optimisation
   Infrastructure     Vodafone Italia towers infrastructure
                                                                         • New revenue streams and site
                    • Combined portfolio of c. 22,000 towers               decommissioning for Inwit

                    • Joint roll-out of 5G infrastructure                • Accelerate 5G deployment
       Active
                    • Joint ownership of active equipment to remain      • Wider geographic coverage
   Infrastructure     with TIM and Vodafone                              • Significant OPEX and CAPEX synergies

                                                                         • Increased capital efficiency
                                                                         • Improved customer experience, allowing
                    • Upgrade of respective fiber transmission             development of new use cases
    Backhauling       networks with higher capacity optic fibre cables
                                                                              • Faster speed
                                                                              • Lower latency

                                                                                                   FY’18 Results and 2019-’21 Plan
                                                                                                                                     6
CEO Introduction
Potential Partnership in Fiber Roll-out
Update on Dialogue with Open Fiber
                     • TIM strongly believes          in the value potentially generated by a single state-of-the-art network
                             infrastructure, delivering benefits for all the stakeholders: TIM and OF, market, shareholders,
    Rationale of the         Italian citizens and the whole Country
        project          •   In light of this, TIM has started a dialogue with OF to explore all the potential options, including
                             commercial partnership, co-investment agreement or full business combination between NetCo and
                             OF

                         •   In order to analyse a potential deal between TIM and OF, the following actions have been taken:
                                — Confidentiality agreement has been signed and advisors have been appointed by both
                                  parties
         Status                 — Various teams, including financial advisors, external technical advisors and selected
     and next steps               corporate functions, are working already in order to support TIM and OF
                                — Induction presentations have been already organized and activities will proceed in the
                                  forthcoming weeks to refine analyses on the nature, structure and implications of the various
                                  options available for a potential deal between TIM and OF

 Regulatory framework    •   In December 2018, the Parliament approved the “Collegato Fiscale” aimed at encouraging the
                             development of investments in ultra-broadband network infrastructure
      supportive
                         •   Most stakeholders have expressed interest and support for a single network

                                                                                                           FY’18 Results and 2019-’21 Plan
                                                                                                                                             7
FY’18 Results and 2019-’21 Plan

 1   CEO Introduction

 2   2018 Highlights

 3   2019-’21 Strategic Plan

 4   Outlook

                                  8
FY’18 Main Results
FY’18: Stable revenues and growing Operating Free Cash Flow, despite challenges
Organic data (1), €mln

                                                                                                                                           FY’18                                                            4Q’18
                                                                                                                                 FY’17                       FY’18                                4Q’17                     4Q’18

                                                                                                                                17,552        +0.4%        17,623
      Group service revenues +0.4% on                                                                                                                                                             4,542      -1.8%          4,458
          xxx                                                                          SERVICE
      a full year basis: Brazil growing                                                                         Domestic         13,986       -0.6%         13,896
                                                                                       REVENUES                                                                                                   3,609       -3.0%          3,499
      mid single digit, domestic almost
                                                                                                                     Brazil      3,594        +4.7%          3,763                                            +3.7%           972
      flat, overperforming competitors                                                                                                                                                             939

                                                                                                                                                                     Adj. Growth (2)                                                Adj. Growth (2)

      Market dynamics and non-linear                                                                                            8,404         -3.4%         8,121         -1.1%                   2,179       -9.9%         1,963 -5.3%
      items impacting 4Q domestic                                                      EBITDA                                    7,050        -6.0%          6,629        -3.3%                   1,778      -13.2%          1,544      -7.6%
      service revenues and EBITDA
                                                                                                                                 1,369        +10.4%         1,510                                 405        +5.4%           426

      FY EBITDA less CAPEX growing
      double digit excluding license                                                                                           3,520         +12.6%
                                                                                                                                                           3,962
      payments                                                                         EBITDA-                                                                                                    421       -10.4%          377
                                                                                       CAPEX(3)                                 3,129         +8.5%        3,394
                                                                                                                                                                                                  404       -29.6%
                                                                                                                                                                                                                            284
                                                                                                                        406                  +44.8%                     586             21                  +357.7%                     100
      Stable Group net debt despite
      payment of a total of €513m on
      licenses in 2018 (€477m for 5G in                                                                                                                                                                               -€551m
                                                                                                                        2017                                                                       25,308
      Italy) and NWC absorption                                                        NET     DEBT(4)                                                                                                                  net of
      (-€964m(3))                                                                                                      2018                                                                        25,270             licenses

                         (1)   Excluding exchange rate fluctuations & non recurring items; before IFRS 9, 15, 16
                         (2)   Adjusted EBITDA growth: excluding non-linear items (€195m FY and €105m 4Q: €45m liability reversal, €26m vendor rebates, €34m accounting adjustments). See annex      FY’18 Results and 2019-’21 Plan
                         (3)   CAPEX and NWC net of License: 2017 €630m, 2018 €2,399m for Italian 5G (of which €477m paid) and €36m for Brazilian spectrum clean up                                                                                   9
                         (4)   Adjusted
FY’18 Domestic Wireline
4Q FSR +1.2% yoy, driven by consumer ARPU growth, business, wholesale
                                                                                                                                 Wireline Revenues
                                                                                                 Organic data, € mln
 Consumer
                                                                                                    Wireline Domestic            10,689     -0.7%   10,611
 ▪ Positive net effect on revenues from two price increases (€1.95 net of VAT
   in July and €1.2 in Nov) led to strong ARPU growth at the expense of line                                                                                       Equipment
                                                                                                                       Service   9,952       flat   9,951
   losses
                                                                                                              Core Service (1)     8,603    +0.9%     8,679
 ▪ Head of Business now in charge of Consumer. Focus on upselling rather
   than repricing. Line loss trend improving from Q1 as a result                                                        Retail      6,653   +1.3%      6,739
 ▪ TIM Vision reaching ~1.7 mln registered clients

 Business
                                                                       ICT Revenue (€ mln)
 ▪ Benefiting from quality perception and pricing
   power. Growing in 4Q as well as on a FY basis                             188    191   217
                                                                       168                                                       FY'17              FY'18
 ▪ ICT grew 15% YoY, strong contribution from Cloud
   services to PA, growing further in 2019
                                                                       1Q'18 2Q'18 3Q'18 4Q'18
                                                                                                     Wireline Domestic           2,765      +0.9%   2,791
                                                                                                                Service          2,526      +1.2%   2,556
 Wholesale                                                                                                 Core Service (1)        2,170    +1.5%     2,203
                                                                                                                                    1,689               1,716
                                                                                                                        Retail              +1.6%
 ▪ Domestic WHS grew 1.7% yoy in 4Q despite 3.2% drag from regulated
   prices (expected to fade). Strong growth in VULA demand more than
   offsetting decline in LLU
 ▪ Sparkle revenues stabilized in 4Q                                                                                             4Q'17              4Q'18

              (1)   Includes Domestic Wholesale and excludes Sparkle                                                                                FY’18 Results and 2019-’21 Plan
                                                                                                                                                                                      10
FY’18 Domestic Wireline
Strong fixed ARPU growth from FTTx conversion and repricing
   Strong migration to fiber: TIM retail fiber subs +47% yoy (42%                                                                                                  Accesses
   penetration on BB customer base, +14 p.p. yoy); wholesale
   fiber lines +129%                                                                                                                                            19,216   -289   18,927
   Consumer ARPU growth accelerating to 8.7% yoy (+6.4% in                                                                                                                                               WHOLESALE
                                                                                                                                                                8,114    -51     8,063
   Q3) with BB ARPU +15.4% yoy (+11.8%) positively impacted by                                                          Total Accesses             (1)
   repricing actions during 2018 and offsetting the 28-days to                                                                                                                                               RETAIL
                                                                                                                        on TIM Infrastructure
   monthly billing effect                                                                                                                                       11,102   -238   10,864
   Market is starting to follow TIM’s rationality: strong promos
   cooling down, several price increases in recent weeks                                                                                                        3Q'18           4Q'18
   Peak impact on line losses in 4Q churn related. January on an
   improving path thanks to end of 28-day billing noise and                                                                                                                       5,428
                                                                                                                                                            4,859        +569
   competitors’ price increase                                                                                                                                                    2,262
                                                                                                                                                                1,904    +358
                                                                                                                        FTTx
                                ARPU - Pricing trends(3)                                                                                                                 +211     3,166
                                                                                                                                                                2,955
 € / line / month                                                             FTTH pricing 2019
                                                36.5                                                                                                        3Q'18                 4Q'18
   33.6                  33.9        35.5                                          +2.1€          JAN     FEB
                32.8                                             40
                                                                                            +0.99€

                         26.1        27.4       28.7
                                                                 30
                                                                        TIM       Op1       Op2         Op3                                                      Line Losses (2)
   24.9         25.5
                        Consumer blended ARPU                                 FTTC pricing 2019                                 -199       -201   -195
                                                                                                                                                         -301                   Line losses impacted by repricing and
                        Broadband ARPU                           40                               JAN     FEB
                                                                                  +2.1€                                                                                         voice-only churn (~ -200k in 4Q’18),
                                                                                           +0.99€
                                                                                                                                                                                progressively easing in 1Q 2019
  4Q17         1Q18     2Q18        3Q18       4Q18
                                                                 20                                                            1Q18       2Q18    3Q18   4Q18
                                                                        TIM       Op1       Op2         Op3

                       (1)   Retail VoIP included
                       (2)   VoIP excluded                                                                                                                                                FY’18 Results and 2019-’21 Plan
                       (3)   FTTH /FTTC total monthly prices, including: line rental, unlimited data, unlimited calls, modem, activation fee                                                                                11
FY’18 Domestic Mobile
TIM best-in-class in defending its customer base from new entrant/MVNOs
 € Mln, organic data                        Customer Base                                                                                                          Mobile Revenues
 k, Rounded numbers                                                                                                              Organic data, € mln
                                                                                  % Human active

           Total                                                                                                                                                5,275    -1.3%        5,205
                         31,994           -176        31,818
                                                                                                                                         Handsets                620                   692
                                                                                                                                                                        +11.6%
  Not Human                  9,256       +114         9,370                                84%
                                                                                                                                             Service            4,655    -3.1%       4,513
                                                                                  % LTE on BB CB
        Human            22,738           -290       22,448
                                                                                                                                                                FY'17                 FY'18

                             3Q'18                    4Q'18
                                                                                           79%
                                                                                                                                                                                                         (2)
                                                                                                                                         1,424                                             Δ YoY MSR
                                                                                                                                                       -10.0%   1,282               Actual        Adjusted
                                                                                                                                          199                             3.7%
                                                                                                                                                                 203
 Mobile Number Portability trend                                    “Washing-machine” effect                                             1,225         -11.9%   1,079
                                                                                                                                                                                   -0.2%
                                                                                                                                                                                                 -2.8%
 k, Rounded numbers                                                 penalizing EBITDA (high commercial
                                                                    costs) cooled down starting from Q4                                                                                                        -11.9%
                                                                                                                                                                                                                        -9.1%

                                                                                                                                                                           1Q'18     2Q'18         3Q'18         4Q'18
                                                                                                                                         4Q'17                  4Q'18
                                                                                   TIM(1)
     111               32                                                                                                       4Q mobile service revenues affected by ARPU pressure (lower out of
                                                                                                                                bundle, very low entry level prices)
                                       -182              -46                        -85
                                                                                                                                Market prices on customer acquisition now on an increasing trend
                                                                                         Op1 Op2 Op3
          1Q18               2Q18           3Q18             4Q18                           FY'18                               Positioning on quality to be enhanced further in the new plan

                       (1)    TIM+Kena                                                                                                                                              FY’18 Results and 2019-’21 Plan
                       (2)    Mismatch in pre-paid cards accounting in Q1, Q2 and Q3 was corrected in Q4. No drag in future years and no impact on FY 2018                                                                      12
FY’18 TIM Brasil
Strong Results Rewarding a Year of Many Challenges in the Brazilian market
Organic Performance, R$mln, Rounded numbers

                                                                                              FY’18                                         4Q’18
                                                                                     FY’17               FY’18             xxx    4Q’17                     4Q’18

                                                                             Total   15,474    +4.7%   16,205             Total    4,075     +3.7%         4,225
      Service Revenues up 3.7% YoY in
      4Q and +4.7% in 2018                                SERVICE
                                                          REVENUES          Mobile   14,703    +4.5%    15,369                    3,867      +3.5%         4,003
      MSR increased 3.5% YoY in 4Q
      and +4.5% in 2018

      TIM Live Revenues up by 37.5%                                                                                                                          1,853
                                                                                                        6,505
      YoY in 4Q and +39.4% in 2018                                                            +10.4%                                          +5.4%
                                                          EBITDA                      5,894                                         1,758

      Solid network development:
      ▪     510 new cities                                                                                                                                     444
            out of 1,426 with 700 Mhz                     EBITDA-                                       2,528                                 +357.7%
                                                                                      1,746 +44.8%
      ▪     9 new cities                                  CAPEX                                                                       97
            out of 14 with FTTH in 2018

      2018 Guidance delivered                            TIM Live Revs   TIM Live ARPU         12 Months         Mobile ARPU        12 Months
                                                                                                                                                             FTTH HH (1)
                                                          R$ 383 mln         R$ 82.1          TIM Live Net          R$ 23.7       Postpaid Net
                                                                                                                                                              +1.1Mln
                                                            in FY’18        in 4Q’18           Adds +75k           in 4Q’18       Adds +2.4 Mln
                                                                                                                                                              vs YE’17
                                                          +39.4% YoY       +14% YoY            (CB: 467k)         +8% YoY         (CB: 20.2 Mln)

                    (1)   Addressable HH ready to sell                                                                                FY’18 Results and 2019-’21 Plan
                                                                                                                                                                           13
FY’18 Domestic
OPEX: one-offs affect YoY comps; action taken to improve underlying performance
                                                                                   Organic data, €mln

  Commercial: higher COGS and commissioning to support revenue generation,                              2017            2018              Δ ‘18 vs. ‘17
  higher bad debt and credit costs(1). New plan envisages new commercial
  structure                                                                                             8,290          8,618                      +328
  Industrial: energy efficiency on industrial sites
  G&A, IT: positive impact of “zero-based” approach and real estate space          Interconnection      1,518          1,485                      -33
  reduction (sqm -500k)
  Labour: headcount decrease related to Art.4, partially off-set by lower
                                                                                         Equipment      1,553          1,575                      +22
  Solidarity impact vs. ’17
  Other costs comparison heavily impacted by one offs: e.g. liabilities reversal
  €112m in ’17, vendor rebates €83m                                                     Commercial                                                +115
                                                                                                        1,828          1,943

                                                                                           Industrial
                                                                                                        1,021          1,009                      -12
                                                                                                  G&A    533             523                      -10
     OPEX trend in recent
     past leaves opportunities                                                                 Labour
                                                                                                        2,568          2,537                      -31
     for cost-cutting in the
     coming years
                                                                                             Other(2)    -731           -454                      +277

            (1)   Associated to sales of receivables                                                            FY’18 Results and 2019-’21 Plan
            (2)   Includes other income/provision                                                                                                         14
FY’18 Domestic
CAPEX on a decreasing trend. 5G spectrum provides competitive advantage
                                                           Organic data, €mln, Δ YoY

  UBB coverage extended in line with Plan. Further
  expansion will now continue in synergy with 5G (FWA)                                 4,551                     5,634

  4G access CAPEX will benefit from up-and-coming
  VRAN technology
  Heavy traffic growth fully supported                             Net of
                                                                                       3,921   -686
                                                                  license                                        3,235
  Procurement optimization on the way: number of
  suppliers and unitary costs on a falling path expected                               FY'17                     FY'18
  to accelerate                                               CAPEX                    25.6%   -4.4 p.p.           21.2%
                                                             on sales (1)

    5G spectrum auction
  (€2.4bn) creating a 2-tier
  market, with TIM playing
    in «premium league»

          (1)   Excluding Licenses                                                                         FY’18 Results and 2019-’21 Plan
                                                                                                                                             15
FY’18 TIM Group
Net financial position affected by license payments and NWC absorption
€mln; (-) = Cash generated, (+) = Cash absorbed, excluding call-outs

                                                 Ebitda                      (7,713)
                                                 Capex                        4,159
                                                 ΔWC & Others ex spectrum       964(1)
                                                 Operating FCF              (2,590)

                                                                                                       -551
                                                                                                                                -38

          FY’17                    Op.FCF                  Financial   Cash Taxes        Dividends &           Other    FY’18   License               FY’18
                                     excl.                 Expenses                       Change in           Impacts                                  incl.
                                   License                                                  Equity
                                                                                                                                                     License

                     (1)   See details in the annex                                                                                   FY’18 Results and 2019-’21 Plan
                                                                                                                                                                        16
FY’18 TIM Group
Key Take-aways on 2018

                      •   Competition: Iliad launch, competitors reaction to Iliad’s launch, aggressive fiber promos
      A challenging
          year
                      •   Comparability: positive 2017 and adverse effect of non linear items
                      •   Regulatory: 28 days billing roll-back, wholesale prices, roam-like-at-home

                      •   Stable FY’18 revenues, thanks to Brazil’s growth and resilience of domestic business

      Mixed results   •   EBITDA impacted by OPEX dynamics, non-linear items and commercial push
                      •   Net Debt: stable on 2017, despite €0.5bn spectrum payments (5G in Italy) and NWC
                          absorption

                      •   Early signs of market dynamics improving and competitive intensity easing
         Time to
       turnaround
                      •   Time to tackle unresolved issues in TIM
                      •   Time to deliver and delever

                                                                                             FY’18 Results and 2019-’21 Plan
                                                                                                                               17
FY’18 Results and 2019-’21 Plan

 1   CEO Introduction

 2   2018 Highlights

 3   2019-’21 Strategic Plan

 4   Outlook

                                  18
2019-’21 Plan

2019-’21 Strategic Plan: TIMe to deliver and delever

                                        Revamp domestic                                      ROIC
                                                      Technology                   •   Boost return on
                    Commercial                                                         capital invested
                                                      Modernization, simplifica-
                    Quality positioning                                                (stabilize revenues,
                                                      tion and intelligence
                                                                                       cut costs and NWC
                    Operations                        Efficiency                       absorption)
   Execution        Quality and reliability on all    Structurally leaner cost
                    customer touchpoints              base                         •   Optimize invested
   discipline,                                                                         capital (new
   focus and                                                                           industry paradigm)
   simplicity                        Further develop Brasil
                        Commercial              Infrastructure       Efficiency
                        Growth waves on         Fiber deployment     Continuous
                        Consumer                acceleration,        improvement
                        postpaid, Mobile        global deals for                              Delever
                        B2B, Digital            network access

                                                                                       FY’18 Results and 2019-’21 Plan
                                                                                                                         19
2019-’21 Plan
Commercial – Consumer: «Quality is the name of the game»
    Our assets                                                 Key Strategic Priorities                                       KPIs evolution

                                                   • From “number of GB” to “quality of service and speed”        UBB penetration(1), %
                                                     on mobile (premium connectivity on video, gaming)
                                                                                                                                     +35 pp.
                                                   • Premium positioning with “best speed and security”                                                 80%
    Network                  New                     concept on fixed (modular adds-on, family convergence,
                             quality                                                                                      45%
    quality                                          modem and home devices)
                             offer
                                                   • From repricing to continuous upselling based on
                                                     valuable services (e.g. security, 5play, priority network,           2018                         2021
                                                     assistance)
                                                                                                                  ARPU

                                                   • Partners’ consolidation with focus on mono-brand                                    ++
                             Channel
      Scale                  simplifi-               and stricter commissioning to maximize NPV
                             cation                • Flexible tactical alternative channels (e.g. telesales)
                                                                                                                          2018                         2021

                                                   • Unified fixed-mobile and content caring                      Customer Base
                                                   • Scale-up self care (i.e. IVR, self SMS, APP), monetize                               -
   Technical                 Caring                  human caring
  capabilities               evolution
                                                   • Process efficiency (e.g. automation, process revision,
                                                     offer simplification)                                                2018                         2021

                (1) Percentage of broadband customer base                                                                         FY’18 Results and 2019-’21 Plan
                                                                                                                                                                    20
2019-’21 Plan
Commercial – Business: evolution towards a solution provider
                              Key Strategic Priorities                                                   KPIs evolution

                  • 5G leadership positioning:
                                                                                       Large – ICT revenues, %
                   – Maintain leadership in connectivity (e.g. FWA, flexible
Large                 connectivity packages, premium profiles based on network                                 +9 pp.
Evolve towards        slicing, smart manufacturing)                                                   39%                     48%
a solution
                    – Step-up from carrier to service manager (e.g. vertical app
provider
                      smart cities, public safety), hyperconvergence and multi-cloud
                                                                                                      2018                    2021
                  • Boldly entering ICT arena (partnerships and potential M&A)         SME – Mobile
                                                                                           Customer Base                         ARPU
                  • 100% IP-based offer: fiber connection and only VOIP cloud-
                                                                                                 ++                                   -
SME                  based services
Evolve offer
                  • “Real convergence“: single number, single invoice including
and proposition
                     managed services / unified communication layer                       2018          2021            2018                 2021
towards “one
stop shop”        • Tangible value added services (e.g. security, office assistance,   SME – Fixed
                     insurance) and contiguous market offerings (e.g. ICT, energy)
                                                                                           Customer Base                           ARPU
                                                                                                  -                                  =
Reinforce         • Reskilling direct sales force as a core asset
operating         • Contract-to-delivery time reduction, streamlining and further
model                automating provisioning and activation processes                     2018          2021            2018                 2021
                                                                                                                 FY’18 Results and 2019-’21 Plan
                                                                                                                                                    21
2019-’21 Plan
Commercial – Wholesale: maintain access market leadership, grow in not regulated
                                          Key Strategic Priorities                                                KPIs evolution
                  • UBB take-up by new pricing models and service rules (e.g. pay              Not Regulated Revenues,
                        per use UBB for vacation houses)                                       % on Total Wholesale Revenues
Regulated         •     Fast access to services especially for non-infrastructured OLOs(1)
Defend access           (e.g. temporary offering for exchanges not yet activated)                                    +4 pp
market and        •     Expand value chain offering (e.g. internal house wiring on                          19%                     23%
maintain UBB            demand)
coverage          •     Complete remaining FTTC coverage and continue to develop
leadership              FTTH access                                                                         2018                    2021
                                                                                               Fiber accesses
                  • Connectivity and big deals:                                                (VULA + BTS NGA, m)
                        – Leverage new network capabilities (e.g. automation, API) to                                   +2x
                           allow greater flexibility and faster time to market for customers                2.1                      4.1
Not regulated
Grow in                 – Introduce new pricing model based on volume and
connectivity,              geographical areas                                                               2018                    2021
dark fiber and    •     Digital Services and mobile:
                                                                                               GEA(2) direct pre-sale           GEA indirect pre-sale
boost sales             – Evolve core offering portfolio (e.g. IoT wholesale, FWA) and         leadtime, # days                 leadtime, # days
effectiveness              introduce new cloud services (e.g. VoIP hosting)
                  •     Improve customer experience with new digital channels and                      -30%                                  -60%
                        process simplification
                  •     Improve sales effectiveness through better billing, targeted
                        marketing campaigns                                                       2018        2021                    2018                 2021
                                                                                                                         FY’18 Results and 2019-’21 Plan
                 (1) Other Licensed Operator                                                                                                                      22
                 (2) Gigabit Ethernet Aggregator service
2019-’21 Plan
Technology – Modernization, simplification & intelligence
                                          Key Strategic Priorities                                      KPIs evolution

                           • New 5G and vRAN(1) stacks, complete migration to
Modernization                all-IP for both core and transport
                                                                                                                            -8
& innovation               • Automation of activities at scale on target platforms                            23
                                                                                     Data centers,                                         15
as business                  (5G, vRAN) and tactically on legacy platforms           # cumulated
enablers                   • OSS/BSS architecture renewal, completing to build a                            2018                        2021
                             new digital and convergent “operating system”

                                                                                                                          -279
Simplification             • Stop investments on legacy platforms as of 2019                                 617
                                                                                     IT applications,                                     338
and decom-                 • Decommissioning of legacy platforms, equipment and      # cumulated
missioning to                applications as soon as possible
                                                                                                            2018                        2021
unlock                     • Consolidation of ICT infrastructure and
savings                      transformation into hybrid-cloud
                                                                                                                       +20 pp
                                                                                     Event                                               22%
                           • Shift from technical to ROI-based coverage planning
                                                                                     management              2%
Intelligence               • Expose data, network capabilities and services to all   automated,
for long term                LoB and selectively to 3rd parties                      %                      2018                        2021
opportunities              • Drive TIM-wide Advanced Analytics roadmap bringing
                             3-4 new use cases at scale per quarter
                                                                                                                   FY’18 Results and 2019-’21 Plan
                (1) Virtualized radio access network                                                                                                 23
2019-’21 Plan
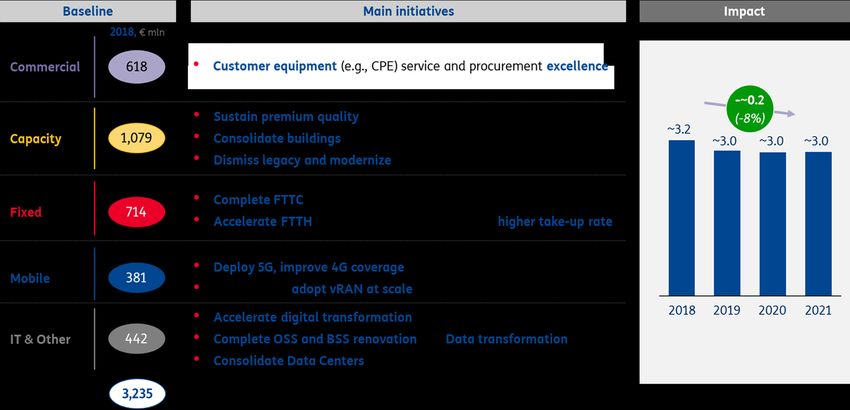
Efficiency – Cost Base Resizing: Main Optimization Initiatives and Impacts
      Addressable baseline                                                                      Main initiatives                                                                         Impact
                                2018
                                € mln
                                                          •     Sales channels optimization and partners consolidation
                                                                                                                                                                         OPEX view (IAS)
                                                          •     Self caring (i.e. IVR , APP), back office automation and
                                                                                          (1)

Commercial                      1,511(2)                        artificial intelligence                                                                                                       -8%
                                                          •     Equipment vendor management optimization
                                                          •     Improvement of credit management practices and processes
                                                          •     Processes redesign and automation to improve on-field
                                                                productivity
Industrial                     1,009(3)                                                                                                                                         2018                      2021
                                                          •     Energy efficiency (incl. decommissioning, network
                                                                virtualization, co-generation)
                                                          •     Office space rationalization and disposal of non-strategic                                               Cash view

G&A                               523                           buildings                                                                                                                    -14%
                                                          •     Facility management optimization
                                                          •     Workforce rightsizing (incl. de-layering, functions
Labour                           2,537                          consolidation, etc.), leveraging on early retirement
                                                                instruments
                                                          ~60%(5) of total 2018 OPEX                                                                                             2018                     2021
                               5,126(4)
                                                          baseline (EUR 8,618 m)
                                                                                                                                                                               FY’18 Results and 2019-’21 Plan
                (1) Interactive Voice Response                        (2) Excludes €432 m of COGS not addressable and includes capitalized costs (e.g. commissioning)                                              24
                (3) includes capitalized costs (e.g. provisioning)    (4) Includes -€454 m of other costs (e.g. capitalized labour)             (5) Remaining ~40% includes: interconnection, equipment and COGS
2019-’21 Plan
ROIC-driven focused CAPEX Allocation

                                       FY’18 Results and 2019-’21 Plan
                                                                         25
2019-’21 Plan
TIM Brasil: Key Strategic Priorities for 2019-2021 Plan
     Areas                                                               Key Strategic Priorities
  Growth waves
                                                                                                                 ARPU             22.4
                    •   Mobile Pre Paid – offer simplification to improve CEx while evolving digital channels                                         Mid to high
                                                                                                                 Blended                              single digit
                    •   Mobile Post Paid consumer (“the controle wave”)                                          (R$)                                 growth (CAGR)
   Consumer
                         – Growth based on a "Mobile Challenger" approach pushing migration and upselling                         2018     2021
                         – Leverage of 4G coverage leadership benefits and loyalty initiatives
                    •   Gain relevance in overall Business revenues leveraging on:                               Churn                                Double digit
                                                                                                                 (%)                                  decrease
   Mobile B2B            – Revision of value proposition and more convergent approach offering E2E solutions
                         – Increase in efficiency and sales productivity                                                          2018     2021

                    • New revenues opportunity from being a platform provider (analytics, BD, mobile adv, …)     Opportunity size by 2021
   Digital          • Increased role in IoT growing ecosystem (beyond connectivity)                                       bn
                    • Content offer aggregation to support mobile+fixed service revenue growth                    ~1      Reais             >30          m
                                                                                                                                                         lines

                    • Fiber deployment acceleration (backbone, backhaul and FTTH), with FTTH offer in selected FTTCITY              601               >1,500
  Infrastructure        regions                                                                                                     2018              2021

  deployment        • Launch of global deals for network access, according to spectrum mix evolving towards      FTTH               1.1               >4
                        significant use of 4G vs. 2G and 3G by 2021                                              (m HH)             2018              2021

                    • Successful efficiency plan still leveraging TIM results                                                                -60%
                    • Digital transformation acceleration in customer facing activities and internal processes   Human
  Efficiency Plan                                                                                                Interac-
                    • Continuous margin improvement, reaching more than 40% in 2020, due to rigid cost control   tions (%)
                        (OPEX growth below inflation)                                                                                    2018      2021
                                                                                                                              FY’18 Results and 2019-’21 Plan
                                                                                                                                                                     26
FY’18 Results and 2019-’21 Plan

 1   CEO Introduction

 2   2018 Highlights

 3   2019-’21 Strategic Plan

 4   Outlook

                                  27
Outlook
Outlook – pre IFRS 9/15 and IFRS 16
                                         Group                                      Domestic                                        Brasil
   YoY growth rates
                                2019                2020-21                  2019                2020-21                2019                        2020-21

 Organic                    Low single             Low single             Low single                                +3% - +5%                    Mid single
                                                                                               Almost stable
 Service revenues         digit decrease          digit growth          digit decrease                                (YoY)                     digit growth

                                                                          Low to Mid                                Mid to High                 EBITDA
 Organic                    Low single             Low single                                   Low single
                                                                          single digit                              single digit              margin ≥ 40%
 EBITDA                   digit decrease          digit growth                                 digit growth
                                                                           decrease                                growth (YoY)                 in 2020

 Capex                                      --                                   ~EUR 3 bn / Year                        ~R$ 12.5 bn cumulated

                              Cumulated ~EUR 3.5 bn.
 Eq FCF                   To be enhanced through inorganic                                --                                             --
                            actions presently not included

 Adjusted
                                   ~EUR 22 bn by 2021                                     --                                             --
 Net Debt
                      • IFRS 9/15 impact over coming years roughly stable vs. 2018.
                      • IFRS 16 impact: Net Debt / EBITDA After Lease adoption implies no impact on leverage ratio based on preliminary analysis
                      • Figures @ avg. Exchange Rate actual 4.31 Reais/Euro
                                                                                                                            FY’18 Results and 2019-’21 Plan
                                                                                                                                                               28
Q&A Session

              29
Annex

        30
Annex
TIM Group IFRS 9-15 impacts

                                                                                IFRS 9 impacts the determination of expected losses
As from January 1, 2018, IFRS 9 (Financial Instruments) and IFRS                on trade receivables and other financial assets
15 (Revenues from Contracts with Customers) have to be applied.                 (change from the incurred loss model provided by IAS
                                                                                39 to the expected credit loss model).
In order to allow comparison of the results for FY’18 with those for
the previous year, financial statements data are also prepared                  IFRS 15 impacts the revenue recognition of fixed and mobile
under previous accounting principles                                            offerings as well as the recognition of relevant contractual
                                                                                costs, without any impacts on cash flows.

                                   Revenues                            Services Revenues                             EBITDA
                         FY '18 old     D IFRS      FY '18         FY '18 old      D IFRS        FY '18    FY '18 old     D IFRS          FY '18
                           IFRS           15       new IFRS          IFRS            15         new IFRS     IFRS         9 - 15         new IFRS

   TIM Group                 19.109       (169)      18.940            17.561        (182)        17.379        7.713       (310)              7.403
     Domestic                15.185       (154)      15.031            13.834        (183)       13.650         6.221       (266)              5.955
     Brazil                   3.959         (16)      3.943             3.763               0      3.763        1.511         (44)             1.467

                                                                                                                        FY’18 Results and 2019-’21 Plan
                                                                                                                                                          31
Annex
TIM Brasil - Outlook
        GOALS                      DRIVERS                     SHORT TERM TARGETS (2019)   LONG TERM TARGETS

                  •   Further improve mobile ARPU                  Service Revenues
                                                                                               Service Revenues
   Revenue                                                                                          Growth:
    Growth
                  •   Expand Residential BB Revenues                    Growth:
                      contribution                                                            Mid single digit
 Sustainability                                                    3% – 5% (YoY)
                  •   Tap B2B opportunity                                                     (CAGR ‘18-’21)

                  •   Accelerate digitalization efficiencies        EBITDA Growth:
                                                                                                EBITDA Margin:
    Improve       •   Maintain zero-based approach and
  Profitability       traditional initiatives                    Mid to High single
                                                                                                ≥40% in 2020
                  •   Improve risk management models
                                                                 digit growth (YoY)

                                                                                                         Capex:
 Infrastructure   •   Additional Capex to grow fiber and          Capex on Revenues:
                                                                                              ~R$ 12,5 bln
  Development         improve mobile capacity                         Low 20’s             (cumulated ‘19-’21)

 Expand Cash
                  •   Increase cash flow from operations           EBITDA-Capex on            EBITDA-Capex on

  Generation      •   Continue with debt and tax rate                 Revenues:                  Revenues:
                      optimization                                      >15%                     ≥20% in 2021
                                                                                           FY’18 Results and 2019-’21 Plan
                                                                                                                             32
Annex
2018 Domestic EBITDA performance net of non-linear items

                                                           FY’18 Results and 2019-’21 Plan
                                                                                             33
Annex
EBITDA-CAPEX (ex licenses) growing, but Equity Free Cash Flow affected by DNWC
                                                              TIM Group             Domestic                                                                                                    Focus on
mln €                                                       2017       2018
                                                                                                                                                                                             Domestic
 EBITDA                                                       7.790       7.713

 CAPEX                                                       (5.701)    (6.558)
                                                                                    • ΔNWC inflow thanks to licence         mln €                                                           2017             2018
  Licences                                                     (630)    (2.399)
                                                                                      payment over 5 years and EUR
                                                                                                                             Operating WC & Other                                                 573         946
 EBITDA - CAPEX ex licenses                                   2.719      3.554
                                                                                      408m non cash one offs items
 EBITDA - CAPEX                                               2.089      1.155        (mainly restructuring costs)           5G License                                                                    (2.399)
 ∆ WORKING CAPITAL                                              407        922                                               5G License paid in the year                                                      477
                                                                                    • Group Recurring Operating              Non recurring items (not paid)                                     (883)       (408)
 NET OPERATING FCF                                            2.496      2.077
                                                                                      ΔNWC absorbing EUR 1,372m
 Add back Licences Domestic                                     630        477                                               Recurring Operating WC                                             (310)      (1.384)
 Add back Brazil Spectrum Clean-up installments                 257           36
 NET OPERATING FCF ex licenses                                3.383      2.590
                                                                                    • Lower capex
                                                                                                                             Inventory                                                           (41)        (90)
 Financial Expenses                                          (1.572)    (1.302)
 Cash Taxes                                                  (1.113)      (739)     • Absorption in domestic due to          Trade Receivables                                                    138         (74)
 Other impacts (FX)                                             266           29      personnel exit (Fornero Law),          Trade Payables                                                        56       (160)
 Eq FCF                                                         964        578        VAT split payment, billing and
                                                                                                                             Other Operating Payables/Receivables & Funds                       (463)      (1.061)
                                                                                      deferred costs
                                                                                                                                    - o/w Litigations & Settlements                              (95)            -

                                                               Recurring Operating
                                                                           RecurringΔWorking   Capital (Group)
                                                                                     Operating WC                                   - o/w Payables vs. Personnel                                     -        (71)
                            license                 non                                                                             - o/w Personnel Exit (Fornero Law)                          (166)        (267)
   D WC           licenses payments               recurring              2018
                                                                          2018      2019
                                                                                     2019      2020
                                                                                                2020   2021
                                                                                                       2021
                                                                                                                                    - o/w VAT split payment                                          -       (373)
        922 – ( 2,399           –     513) -         408           =    -1,372
                                                                        -1,372                                                      - o/w Litigations & Settlements                                  -           -
                                                                                                                                    - o/w Billing (1)                                                -       (114)
                      -964                                                                                                          - o/w Deferred Costs & Revenues                             (346)       (194)

  NWC absorption net of contribution
  from licence deferred payment                                                                   Improvement expected over time as some one off items will not be repeated
                                                                                                  (e.g. billing, VAT split payment) and action has been taken
                                                                                                                                                                         FY’18 Results and 2019-’21 Plan
                                                                                                                                                                                                                34
                              (1)   From billing in advance to billing in arrears
Annex
Well diversified and hedged debt
€mln

                                                                                                                                                    Maturities and Risk Management
              Op. leases and long rent
                       1,948                 Banks & EIB
                 Other            6.6%          5,545
                               2.3%    18.8%                                                                                                     Average m/l term maturity:
                   658                                                                                                                         7.62 years (bond 7.75 years only)

                                                                             Bonds
                                              72.3%                                                                                           Fixed rate portion on gross debt
                                                                             21,282
                                                                                                                                                     approximately 71%

                                                                                                                                          Around 33% of outstanding bonds
                Gross debt                                                         29,432
                                                                                                                                        (nominal amount) denominated in USD
                Financial Assets                                                   (4,162)
                 of which C&CE and marketable securities                              (3,043)
                                                                                                                                              and GBP and fully hedged
                  - C & CE                                                             (1,917)
                  - Marketable securities                                              (1,126)
                     - Government Securities                                             (558)

                                                                                                                                                Cost of debt: ~4.4 %
                     - Other                                                             (568)

                Net financial position                                            25,270

N.B. The figures are net of the adjustment due to the fair value measurement of derivatives and related financial liabilities/assets, as follows:
- the impact on Gross Financial Debt is equal to € 1,540 mln (of which € 215 mln on bonds);
- the impact on Financial Assets is equal to € 815 mln.
Therefore, the Net Financial Indebtedness is adjusted by € 725 mln
                    N.B. The difference between total financial assets (€ 4,162 mln) and C&CE and marketable securities (€ 3,043 mln) is equal to € 1,119 mln and refers to positive
                    MTM derivatives (accrued interests and exchange rate) for € 935 mln, financial receivables for lease for € 125 mln, deposits beyond 3 months for € 0 mln and FY’18 Results and 2019-’21 Plan   35
                    other credits for € 59 mln.
Annex
Liquidity margin
€mln

                                                                                                                                                                    12,843                  27,341 (2)

               Cost of debt: ~4.4 %
                                                                                                                                                                     11,238

                                                                                                                                                                                             21,021
                                                                                                                                               2,880                 1,345
                                                                                                                         4,038                  2,419
                                                                                                                                                 461
                                                                                                                          3,087
            8,043 (1)                       Covered until 2021                                      2,079
                                                                                                    564                    951
            3,043                                                             1,832
                                                       3,929                                        1,515
                                                                              1,267
                                                                               565
            5,000                                       2,446                                                                                                                                 6,320
                                                        1,483
        Liquidity margin                               FY 2019               FY 2020               FY 2021               FY 2022               FY 2023             Beyond 2023          Total M/L Term
        Liquidity                                                                                                                                                                            Debt
         Margin
                                                                                                                   Debt Maturities
                           Cash & cash                       Undrawn portions of                              Bonds                             Loans (of which long-term rent, financial and
                           equivalent                        committed bank lines                                                               operating lease payable € 1,930)

                    (1) Includes € 545 mln repurchase agreements that will expire in January 2019 for € 450 mln and in March 2019 for the remaining amount             FY’18 Results and 2019-’21 Plan
                    (2) € 27,341 mln is the nominal amount of outstanding medium-long term debt. By adding the balance of IAS adjustments and reverse fair value                                         36
                        valuations (€ 781 mln) and current financial liabilities (€ 1,310 mln), the gross debt figure of € 29,432 mln is reached
Annex
Sparkle: Multiple Strategic Options for Transformation and Growth
   Our Vision                                 Key Strategic Priorities                                              Main KPIs
                  • Scale up Sparkle infrastructure presence and Italian role in the Mediterranean   • ~6,000 km submarine cable
      New             and Africa/Middle East:                                                        • Up to 120/ 160 Terabit
 Infrastructure       – Leverage on huge volumes from Asia/Africa to Europe                              capacity
   to Expand          – New markets in the Region
    Footprint     •   Investing in submarine cable project

                   Capture the opportunities of cloud/ SD-WAN technologies                          • >2x Connectivity, DC and
  Growth in         – Customer experience-focused platform                                               Cloud revenues
  Enterprise        – New PoPs                                                                       •   ~10x # of customers
 Networking &       – Sales channel expansion
    Cloud          Expand current South Europe DC facilities and create new DC hub in Caribbean
                   Evaluate partnerships to accelerate growth

                   Automate Voice process                                                           • ~3x Mobile revenues growth
  Efficiency in     – Clearing and settlements through block-chain based applications
 Voice, Develop    Progressively expand the high-growth A2P message market
     Mobile        Global Roaming through the eSIM technology
 Opportunities

                                                                                                             FY’18 Results and 2019-’21 Plan
                                                                                                                                               37
Annex
Ultra Broadband network

                                Fixed UBB                                                Mobile UBB

            % FTTC passed                                             % LTE passed

                                           77%           ~80%                                                     ~99%
                                                                                                  >98%
                                                                                   >96%
                            ~60%
                                                                      88%
                42%

                FY'15        FY'16         FY'17          FY'18       FY'15         FY'16          FY'17          FY'18

        ▪   ~19.4 mln HH passed FTTC                              ▪   >22,6k LTE nodes
        ▪   ~113,5 k cabinets passed                              ▪   7,401 LTE cities with commercial active service, o/w:
        ▪   ~429 k FTTH OTB installed                                 ▪   1,635 with 4Gplus
        ▪   2,676 cities with commercial active service, o/w:         ▪   12 cities with 4.5G
            ▪     2,558 cities FTTC
            ▪     118 cities FTTH/FTTC

                                                                                                               FY’18 Results and 2019-’21 Plan
                                                                                                                                                 38
Organic data(1), €mln, % YoY
Annex
FY’18 service revenues: Brazil, domestic wholesale and business, INWIT grew yoy
                                                             Domestic                                                                                    Brazil
                                   By Technology                                                                By Business Segment                                 By Technology
        Mobile                                                                  Sparkle
                                                                                                          Inwit/others                    Mobile
        -3.1%                                                                    -4.7%      ~3%              +3.4%                        +4.5%
                                                                          Nat. WHS        ~9%
             31%                                                                                                                                   95%
                                                                           +2.6%   ~13%
                                                                                               -4%
                                                                                              Other &
                                                                                           Eliminations

                                                                                 ~30%                                                                                   5%
                              69%         Fixed                       Business                      ~49%       Consumer                                                              Fixed
                                           flat                        +1.4%                                     -1.6%                                                               +8.5%

▪   Mobile: service revenues resilient until ▪                   Business: positive contribution from ICT, cloud                      ▪    Mobile: MSR increased 3.5%
    3Q and slowing in 4Q due to Consumer                         offsetting the competitive dynamics of traditional                        YoY in 4Q and +4.5% in 2018,
    ARPU decrease and price competition                          services                                                                  following customer mix
    from other players and the new entrant. ▪                                                                                              evolution towards higher
                                                                 Consumer: growth in fixed offset by mobile
    Competitive intensity peaked in 3Q, more                                                                                               ARPU customers (post-paid
    rationality since YE 2018                ▪                   National Wholesale: fiber services growth (VULA)                          and controle)
                                                                 offset copper decrease
▪   Fixed: retail service revenues up +1.3%                                                                                           ▪    Fixed: revenue growth
    for re-pricing activities and ARPU                      ▪    Sparkle: revenue mix shifting towards higher margin                       supported by TIM Live
    increase.                                                    services, from voice to data                                              Revenues up +39.4% in 2018
                                                            ▪    Inwit: revenue increase driven by volumes for higher
                                                                 tenancy ratio (1.9x vs. 1.8x) and +1.4k new small cells
             (1) Excluding exchange rate impact and non-recurring items                                                                            FY’18 Results and 2019-’21 Plan
                                                                                                                                                                                             39
For further questions please contact the IR Team

                                  Investor Relations Contact Details

              Phone                                                                   Contact details for all
                                                  E-mail                              IR representatives:
        +39 06 3688 1
                                  Investor_relations@telecomitalia.it         www.telecomitalia.com/ircontacts
        +39 02 8595 1

                                                                                    TIM
             IR Webpage                        TIM Twitter
                                                                                    Slideshare
www.telecomitalia.com/investors   www.twitter.com/TIMNewsroom           www.slideshare.net/telecomitaliacorporate

                                                                                                                    40
You can also read