Nutrient Release Pattern and Greenhouse-Grown Swiss Chard Response to Biochar Inoculated with Vermicast
←
→
Page content transcription
If your browser does not render page correctly, please read the page content below
Hindawi
International Journal of Agronomy
Volume 2020, Article ID 7852187, 9 pages
https://doi.org/10.1155/2020/7852187

Research Article
Nutrient Release Pattern and Greenhouse-Grown Swiss Chard
Response to Biochar Inoculated with Vermicast

 Lord Abbey ,1 Jinsheng Cai ,1 Lokanadha R. Gunupuru ,1 Mercy Ijenyo ,1
 Ebenezer O. Esan ,2 and Suwen Lin 1
 1
 Department of Plant, Food, and Environmental Sciences, Dalhousie University, Faculty of Agriculture, 50 Pictou Road,
 P.O. Box 550, Truro B2N 5E3, Nova Scotia, Canada
 2
 The University of Western Ontario, Department of Biology, 1151 Richmond Street, London N6A 3K7, ON, Canada

 Correspondence should be addressed to Lord Abbey; loab07@gmail.com

 Received 7 March 2020; Accepted 27 March 2020; Published 14 April 2020

 Academic Editor: Maria Serrano

 Copyright © 2020 Lord Abbey et al. This is an open access article distributed under the Creative Commons Attribution License,
 which permits unrestricted use, distribution, and reproduction in any medium, provided the original work is properly cited.

 A study was performed to assess nutrient release from biochar inoculated with solid vermicast (SVB), vermicast tea (VTB),
 deionized water (DWB), uninoculated biochar (Bioc), and Promix-BX (Pro-BX). The growth response of Swiss chard (Beta
 vulgaris subsp. vulgaris) cv. Rhubarb chard was also assessed. Comparatively, nutrients were released slowly from treatments SVB
 and VTB compared to the other treatments. The rate of nutrient release determined by total dissolved solids and electric
 conductivity from the Pro-BX was the highest. The trend for the plant growth components, total leaf surface area and leaf fresh
 weight at first harvest, was Pro-BX > Bioc > DWB � SVB > VTB. The only treatment that increased total leaf area and leaf fresh
 weight at the second harvest by approximately 1.02- and 1.88-fold was VTB. Leaf fresh weight was significantly reduced by
 approximately 0.33-fold for DWB, 0.28-fold for Bioc, and 0.70-fold for Pro-BX but was not altered by SVB at the second harvest as
 compared to the first harvest. A 2-dimensional principal component analysis (PCA) biplot confirmed that treatment Pro-BX
 increased plant growth components at the first harvest only. The locations of SVB and VTB on the PCA biplot confirmed their
 efficacies, which led to increases in the plant growth components at the second harvest. Overall, the VTB adsorbed more nutrients
 onto its surface that were slowly released to enhance the Swiss chard cv. Rhubarb chard plant growth at the second harvest. Further
 studies should consider microbial activities.

1. Introduction chemical properties of growing media. These include im-
 provements in soil structure, slow release of nutrients, se-
Globally, more research is being focused on climate-smart questration of carbon, cation exchange capacity, sorption
agricultural technologies and sustainable food production in capacity, water-holding capacity, and soil fertility [5, 6].
order to meet the current and future food and dietary de- However, it is worth noting that the nature and type of
mands [1–3]. As such, most farmers adopt intensive use of biomass and the method of the pyrolytic process such as
synthetic chemical fertilizers, which can be detrimental to temperature used can influence the physical and chemical
the environment, ecological system, and the health of life properties of the biochar and its efficacy. These properties of
forms. The use of organic amendments such as vermicast biochar have drawn the attention of many researchers,
and biochar for both field and controlled-environment environmentalists, and farmers leading to increased use in
production is professed as sustainable clean technology. the environmental and agricultural sectors worldwide. Es-
 Grewal et al. [4] reviewed that biochar is obtained from sentially, the benefit of biochar is dependent on the rate of
thermochemical conversion of biomass in an oxygen-limited biochar application, the properties of the growing medium,
environment by the process of pyrolysis. Many studies have and the genotypic characteristics of the plant [7]. Biochar
shown that biochar can enhance the biological, physical, and ability to support plant growth is determined by the
2 International Journal of Agronomy

surrounding growing medium chemistry that it interacts white pine (Pinus strobus) was produced through pyrolysis
with. According to Rees et al. [7], the chemical status of soil at 11,000°C and was obtained from Proton Power Inc., TN,
can influence the efficacy of biochar. USA; vermicast from red wiggler (Eisenia fetida) was pur-
 Inoculation of biochar using organic amendment or chased from Co-op Country Store, Truro, NS, Canada;
synthetic chemical fertilizer triggers its adsorptive surface
with abundant nutrients in addition to the creation of op-
 Promix-BX ™ (Premier Horticulture Inc., Quakertown,
 USA); a general-purpose peat-based substrate consisted of
timal microenvironment for microbial growth and increased 75%–85% sphagnum peat moss, horticultural-grade perlite
water storage capacity [7–10]. Ultimately, the functionality and vermiculite, chemical fertilizer, dolomitic and calcitic
of the growing medium is enhanced. However, the previous limestone, a wetting agent, and mycorrhizal fungus (Glomus
study showed that, by virtue of the high pH, biochar can intraradices) was purchased from Halifax Seed Inc., Halifax,
immobilize major nutrients such as calcium, nitrate-nitro- NS, Canada. Seeds of Swiss chard (Beta vulgaris subsp.
gen, and phosphorus [7]. This can be a major problem when vulgaris cv. Rhubarb chard) was also purchased from Halifax
using biochar since these nutrients may become unavailable Seed Inc.
to plants. Also, such immobilization activity can influence
the pattern of nutrient release to plants. Furthermore, the
 2.2. Biochar Inoculation and Chemical Analysis. The biochar
activities of microbial communities as well as other physical
 was inoculated with solid vermicast at 45% moisture con-
characteristics such as water availability and the structure of
 tent, vermicast tea, and distilled water alone for 40 days. The
the growing medium can also influence the release and
 vermicast tea was made by adding a liter of distilled water to
availability of nutrients to plants. It is therefore hypothesized
 100 g of solid vermicast and stirred at 1200 rpm for 24 hr
that intentional inoculation of biochar can circumvent these
 using DLM1886X1 Isotemp stirring plate (Fisher Scientific
potential problems related to nutrient release and plant
 Inc., Markham, ON, Canada). The biochar was then inoc-
uptake. Materials that can be used to inoculate biochar
 ulated with the vermicast tea (VTB) by thoroughly mixing
include vermicast, thermophilic compost, biosolids, animal
 500 g of solid dry biochar and one liter of the vermicast tea
manure, and liquid fertilizer [3]. Despite this knowledge, the
 prior to incubation. The solid vermicast-inoculated biochar
pattern of nutrient release from inoculated biochar using
 (SVB) was made by thoroughly mixing 500 g of the solid dry
natural amendments such as vermicast with respect to time
 biochar and 100 g of the solid vermicast prior to incubation.
of application is not well understood. This is the main thrust
 The deionized water-inoculated biochar (DWB) was made
of the current study.
 by thoroughly mixing 500 g of the dry biochar and one liter
 Vermicast is rich in microorganisms and plant growth-
 of deionized water prior to incubation. The individual
promoting chemical compounds derived from humic and
 mixtures were then incubated for 40 days in the dark at room
nonhumic substances, which include mineral nutrients,
 temperature (ca. 21°C) and relative humidity conditions. The
organic acids, nucleic acids, macromolecules, and antimi-
 control treatments were 500 g of the dry biochar alone and
crobial and pesticidal compounds [11]. It is therefore ex-
 500 g of Promix-BX potting mix alone also incubated under
pected that the characteristic effect of vermicast-inoculated
 the same room conditions. All the treatments were in
biochar will be significantly higher than if it was not in-
 triplicate. Samples (100 g) of each of the growing medium
oculated, as explained by Beesley et al. [9]. And although the
 substrates were sent to the Nova Scotia Department of
nutrient release rate of the inoculated biochar is expected to
 Agriculture (NSDA) Laboratory Services, Truro, NS, for
be low, it is hypothesized that the synergetic benefits derived
 nutrient analysis. Total nitrogen (N) was determined by the
from the combination of biochar and vermicast through
 AOAC-990.03 combustion method [12] using a LECO-Spec
inoculation and incubation procedures will be highly effi-
cacious. The effect of residual nutrients from inoculated ®
 Analyzer (TruSpec Micro, LECO, MI), while calcium (Ca),
 potassium (K), phosphorus (P), magnesium (Mg), sodium
biochar on plant growth also needs to be investigated.
 (Na), boron (B), copper (Cu), iron (Fe), manganese (Mn),
Therefore, the objective of the study was to assess and
 and zinc (Zn) were determined using the AOAC-968.08
compare the nutrient release pattern of solid vermicast-
 inductively coupled plasma (ICP) spectrometer method [13].
inoculated biochar, vermicast tea-inoculated biochar, and
biochar alone and their residual effects on plant growth. The
test plant was Swiss chard (Beta vulgaris subsp. vulgaris cv. 2.3. Nutrient Release and Electrochemical Analysis. A nu-
Rhubarb chard), which was chosen for its ease of production trient release study was performed in the laboratory using a
during the cool weather in fall and winter, and its ability to cylindrical glass jar measuring 35 cm in height and 10 cm for
withstand sequential harvesting required for the assessment the inner diameter. Each glass jar was filled with one liter of
of plant response to growing medium nutrient residue. deionized water, and the dissolved matter and released
 nutrients in solution were determined using the method
2. Materials and Methods described by Abbey et al. [14] with slight modification. In
 brief, 20 g of each of the five growing medium treatments
2.1. Location and Materials. The study was carried out in the was placed separately in a HEPA filter grade Rosin Tech
Compost and Biostimulant Laboratory and the research nylon press bag (Rosin Tech Products, CA, USA) with a
greenhouse located in the Department of Plant, Food, and mesh size of 25 μm and a dimension of 6.35 cm × 10.16 cm.
Environmental Sciences, Dalhousie University, Faculty of The individual samples were submerged in the deionized
Agriculture, from April to December 2017. The biochar from water in the glass jar. 20 ml samples of the solution from the
International Journal of Agronomy 3

individual glass jars were collected with replacement every 2.6. Leaf Tissue Pigmentation and Nutrient Analysis. Leaf
10 min for 1 hr, every 30 min for 2 hr, every 1 hr for 5 hr, greenness was used to estimate leaf chlorophyll content
every 2 hr for 6 hr, every 5 hr for 10 hr, and every 24 hr for 24 using a 502 SPAD meter (Spectrum Technologies Inc.,
days. Oakton PC Tester 35 multimeter (Oakton Instruments, Aurora, Ill., USA). Anthocyanin content was estimated using
IL, USA) was then used to record the pH, total dissolved a portable ACM200+ anthocyanin content meter (Opti-
solids, electric conductivity, and salinity of the solutions Sciences, Inc., Hudson, NY, USA). Chlorophyll fluorescence
collected before pouring them back into the glass jar. indices were used to determine plant stress level using
LAQUA Twin ion meter (HORIBA, Minami-ku, Kyoto, portable OS30p + Chlorophyll Fluorometer (Opti-Sciences,
Japan) was also used to measure calcium (Ca2+), nitrate Inc., Hudson, NY, USA). The Chlorophyll Fluorometer
(NO−3), sodium (Na+), and potassium (K+) ion concen- calculated the maximum quantum yield or efficiency of
trations of each collected sample per treatment. photosystem II as follows:
 Fv Fm − Fo
 � , (1)
2.4. Greenhouse Experiment. A pot experiment was per- Fm Fm
formed in the department’s greenhouse at an average where Fo is the minimum fluorescence, Fm is the maximum
temperature of 28°C/16°C (day/night cycle) and relative fluorescence, and Fv is the variable fluorescence indices [16].
humidity of 76%. Supplemental lighting was provided by a The Swiss chard leaf greenness, anthocyanin content,
600 W HS2000 high-pressure sodium lamps with and chlorophyll fluorescence indices were all recorded from
NAH600.579 ballast (P.L. Light Systems, Beamsville, ON, the 3rd and 4th leaves of each plant per treatment. Samples of
Canada) at 12 hr light cycle between November and De- plant leaf tissues were also sent to the NSDA Laboratory
cember when days got shorter or on cloudy days. Plastic pots Services for nutrient analysis. The leaf samples were washed
(15.24 cm diameter) were filled to the same volume of a with distilled water, air-dried, and then packed in paper bags
mixture of the individual components as shown in Table 1. before sending for nutrients analyses. In brief, the plant leaf
The variation in weight was due to the differences in bulk samples were oven-dried at 60°C for 48 hr and ground into
density (data not presented). The weight of the uninoculated powder. Total N, Ca, K, P, Mg, Na, B, Cu, Fe, Mn, and Zn
dry biochar prior to inoculation was 200 g. Each treatment were determined using methods described in [12, 13].
had four potted plants placed in saucers per replication, and
they were replicated four times to give a total of 80 ex-
perimental units. Each pot was planted with one seedling of 2.7. Experimental Design and Statistical Analysis. The ex-
Swiss chard and watered with approximately 200 ml of tap periment was arranged in a complete randomized design
water (based on previous work) every two to three days with four replications for the greenhouse experiment but
depending on the weather conditions. By this method, three replications for the nutrient release experiment. For
nutrient loss through leachate was avoided. the greenhouse pot experiment, each of the five treatments
 had four samples of plants and a total of 16 potted plants per
2.5. Plant Growth Analysis. Plant height was measured from treatment. Data on leaf greenness and anthocyanin content,
the stem collar to the tip of the longest leaf using a 30 cm plant height, stem diameter, and leaf area were analyzed by
ruler at first harvest, which was four weeks after trans- one-way analyses of variance (ANOVA) using SAS version
planting. The other growth measurements were stem di- 9.4 software (SAS Institute Inc., Cary, NC, USA). Whenever
ameter, which was measured from the middle portion of the the ANOVA indicated a significant difference, i.e., P ≤ 0.05,
stem using a pair of Mastercraft calipers (Canadian Tire. Fisher’s protected least significant difference (LSD) at α � 5%
Toronto, ON, Canada); total plant fresh weight was recorded was used to separate the means. Graphs of pH, total dis-
prior to total dry weight determination by drying the solved solids, electrical conductivity, salinity, calcium, ni-
samples in an 52100-10 Cole-Parmer mechanical convection trate, sodium, and potassium were plotted for the nutrient
oven dryer (Cole-Parmer Instrumental Company, Vernon release experiment using Microsoft Excel. A biplot of
Hills, Ill., USA) at 65°C for 24 hr; plant mass density was principal component analysis was performed to determine
determined from the dry weights according to the method of the association between the growing media treatments and
Louw-Gaume et al. [15]. The number of edible leaves per the plant growth components of the Swiss chard cv. Rhubarb
treatment was also recorded at first harvest. The two chard using XLSTAT version 19.1.
youngest leaves on each plant were left for the plants to
regrow for a second harvest at eight weeks after trans- 3. Results and Discussion
planting. The weights of the harvested leaves were recorded
using an electronic MXX-412 Denver precision balance Considerable variations were found in the composition of
(Denver Instrument Company, CO, USA). The total leaf area nutrients in the individual growing medium components,
was determined using a LI-3100 Leaf Area Meter (Li-Cor i.e., the solid vermicast-inoculated biochar (SVB), vermicast
Inc., Lincoln, NE, USA). Measurements of plant height, stem tea-inoculated biochar (VTB), deionized water-inoculated
diameter, and leaf area were performed again at the second biochar (DWB), biochar alone (Bioc), and the Promix-BX
harvest (i.e., 8 weeks after transplanting) for comparison (Pro-BX) alone (Table 2). The SVB had higher amounts of N,
with those recorded at the first harvest (i.e., 4 weeks after P, Na, B, and Zn as compared to all the other biochar
transplanting). treatments except the VTB treatment, which had
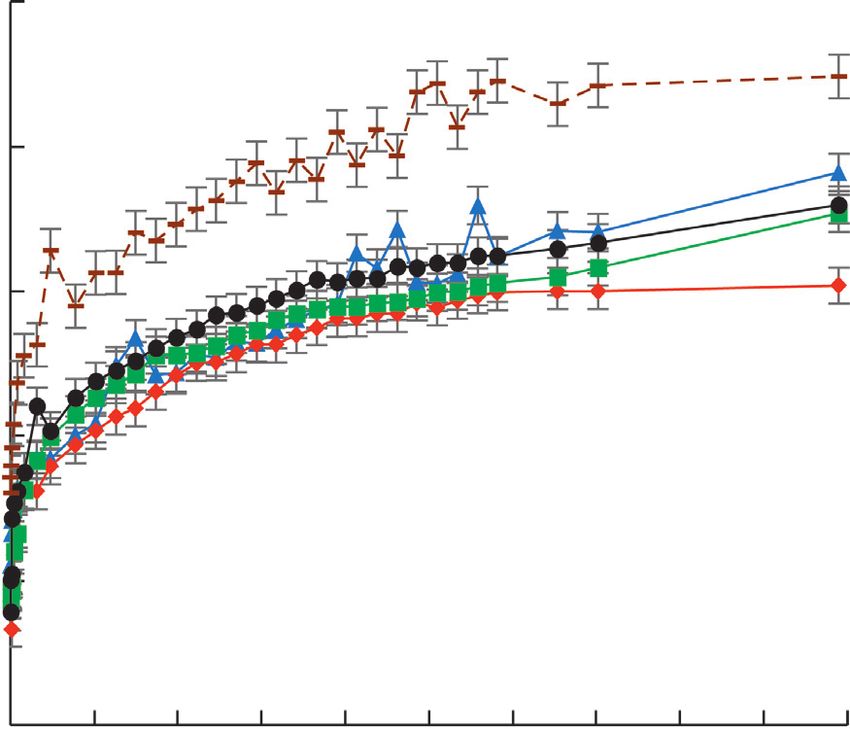
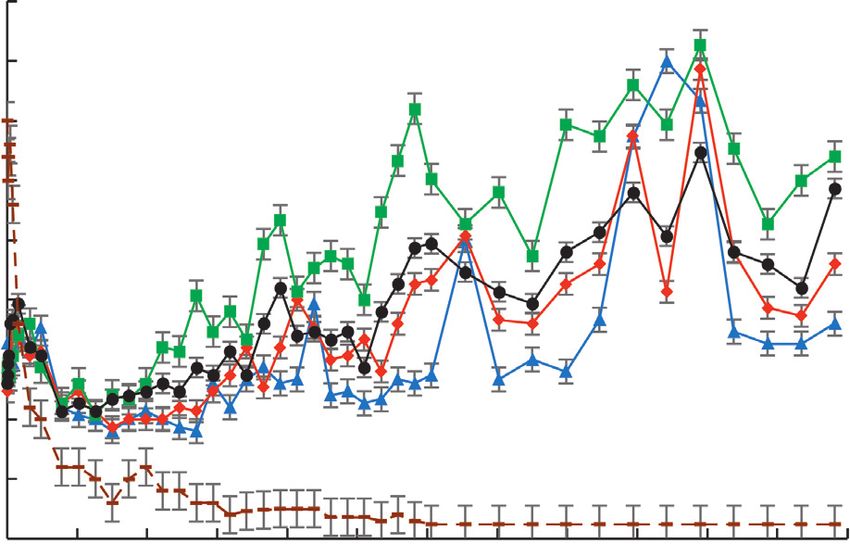
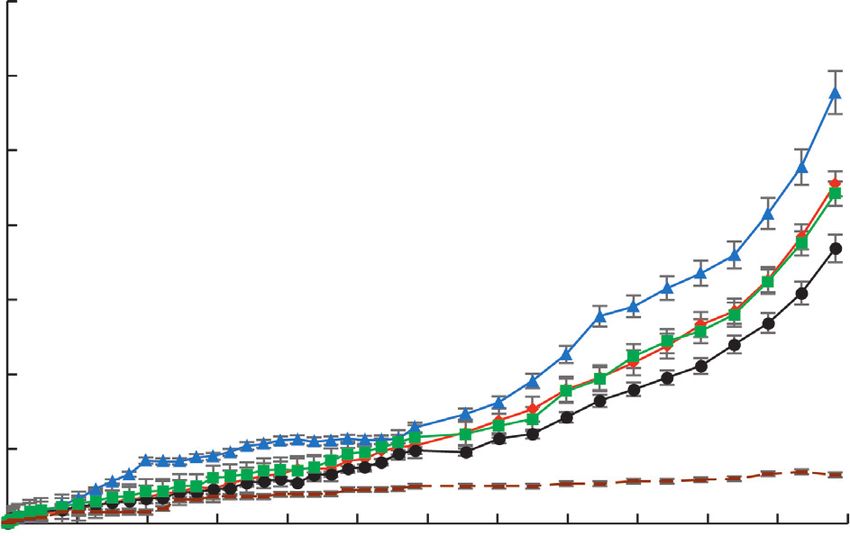
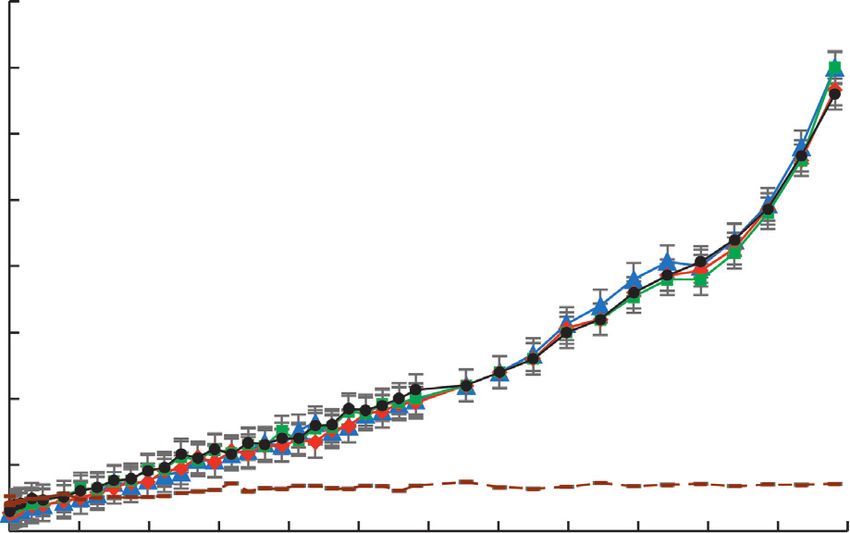
4 International Journal of Agronomy

 Table 1: Composition of individual vermicast-inoculated biochar treatments.
Treatment Inoculated biochar (g) Promix-BX added (g) Total weight of mixture (g)
Bioc 200 560 760
DWB 470 540 1010
SVB 240 520 760
VTB 445 490 935
Pro-BX 0 800 800

comparable amounts of N, K, Mg, and Na. However, the Table 2: Mineral nutrient composition of the growing media
manufacturer’s premixed medium Promix-BX (Pro-BX) components.
with synthetic chemical fertilizer had the highest amounts of Nutrients Biochar alone DWB SVB VTB Pro-BX
Ca, Mg, and Cu and a similar amount of N as found in the N (%) 0.570 0.540 0.640 0.610 0.630
SVB and the VTB. The uninoculated biochar (Bioc) that was Ca (%) 1.498 1.556 1.573 1.658 2.653
used in this study and the DWB had the highest amounts of K (%) 0.039 0.042 0.049 0.050 0.033
Mn and Fe, respectively, but these two treatments contained P (%) 0.066 0.055 0.091 0.082 0.065
the least amounts of all the other remaining nutrients. Mg (%) 0.156 0.165 0.175 0.171 0.217
 The richness in nutrients of the two types of vermicast- Na (%) 0.037 0.037 0.052 0.051 0.028
inoculated biochar (i.e., SVB and VTB) compared to the Bioc B (mg/l) 17.01 16.93 18.82 17.85 17.37
and the DWB was expected. Cocomposting or combination Cu (mg/l) 15.90 15.30 11.99 10.95 24.62
of biochar and natural amendments was reported to increase Fe (mg/l) 550.32 1064.92 637.32 792.61 497.14
biochar nutrient adsorption and overall growing medium Mn (mg/l) 501.80 452.10 437.69 346.61 87.23
 Zn (mg/l) 589.53 504.09 793.37 486.73 658.70
fertility status [9, 10, 17]. Typically, vermicast is valued for its
richness and diversity in humic and nonhumic substances N, nitrogen; Ca, calcium; K, potassium; P, phosphorus; Mg, magnesium;
 Na, sodium; B, boron; Cu, copper; Fe, iron; Mn, manganese; Zn, zinc; DWB,
including macro- and micronutrients and other plant deionized water-inoculated biochar; SVB, solid vermicast-inoculated bio-
growth factors [11]. These vermicast chemicals can alter the char; VTB, vermicast tea-inoculated biochar; Pro-BX, Promix-BX.
properties of biochar when combined or cocomposted.
Based on the reports by Pietikainen et al. [8] and Sizmur
et al. [18], we can fairly suggest that the biochar inoculated activity in the deionized water as compared to the vermicast-
with the dry solid vermicast (SVB) or the vermicast tea inoculated biochar treatments. The values of all the mea-
(VTB) became activated with ionized nutrients that en- sured water quality indices for the Pro-BX treatment were
hanced the functionality of the biochar. This assertion will found to be higher than the respective values for SVB, VTB,
have to be verified in future studies. DWB, and Bioc treatments. However, the differences began
 The nutrient release experiment showed that initial water to show after the 300th hour. These findings demonstrated
activity prior to the dissolution of soluble materials such as the slow release of nutrients from the biochar treatments
surface wetting followed by water imbibition by the particles compared to the Pro-BX. Particularly, the DWB seemed to
constituting the mixed media led to a lag phase within the be the fastest in releasing its nutrients while the SVB and the
first few hours when they were submerged in the deionized Bioc seemed to be intermediate. It was noticed that the
water (Figures 1(a)–1(d)). Consequently, changes in pH, release of materials into the solution and the pH for
total dissolved solids (TDS), salinity, and electric conduc- treatment Pro-BX seemed to be generally more stable after
tivity (EC) were initially slow before rapidly increasing the 350th hour of sampling compared to the other
continuously up to the 100th hour (ca. 4th day) before treatments.
slowing down to the end of the experiment on the 495th hour The release of nitrate (NO3−) into the deionized water
(ca. day 21). The high positive correlation exiting between from the Pro-BX treatment was the fastest compared to all
EC and total nutrient concentration allows for its use to the biochar treatments and was followed by a steep decline
estimate growing medium fertility status [19]. Compared to immediately after 2 hr of submergence (Figure 2(a)). After
all the other indices, the trend for the changes in pH of the the 150th hour, the amount of NO3− released into the so-
solutions for all the treatments was different (Figure 1(a)). lution from the Pro-BX did not change. However, NO3−
 The pH of the solution rapidly declined within the first released into solution from the SVB, DWB, VTB, and the
40 min before steeply rising to reach a peak at the 8th hour Bioc showed significant fluctuations throughout the sam-
followed by a steep fall at the 24th hour. Overall, there were pling period which lasted for 591 hr (ca. 24.6 days). The
no clear differences in salinity, TDS, pH, and EC of the fluctuations can be attributed to microbial and chemical
solutions for the SVB, VTB, DWB, and the Bioc apart from activities such as bioconversion of N, anion exchange, and
the obvious fluctuations in the line graph for treatment volatilization but were not determined in the present study.
DWB. According to Sizmur et al. [18], the manifestation of A lag phase prior to the first 50th hour followed by a rapid
chemical sorption is attributed to ion exchange and nu- increase in ionic concentrations of K+, Na+, and Ca+2 in the
merous functional groups on the carbonaceous surface of sampled solution (Figures 2(b)–2(d)) was also observed. The
biochar. As such, the fluctuations in the line graphs for the concentrations of K+ and Na+ in the sampled solutions from
DWB in Figures 1(a)–1(d) can be ascribed to low chemical all the treatments increased exponentially while that of the
International Journal of Agronomy 5

 9.0 400

 8.5 320

 Total dissolved solids (mg/l)
 8.0 240
 pH

 7.5 160

 7.0 80

 6.5 0
 0 50 100 150 200 250 300 350 400 450 500 0 50 100 150 200 250 300 350 400 450 500
 Time of sampling (hr) Time of sampling (hr)
 (a) (b)
 600 250

 500
 200
 Electric conductivity (µm/cm)

 Total salt content (mg/l)

 400
 150
 300

 100
 200

 100 50

 0 0
 0 50 100 150 200 250 300 350 400 450 500 0 50 100 150 200 250 300 350 400 450 500
 Time of sampling (hr) Time of sampling (hr)
 (c) (d)

Figure 1: Changes in pH, total dissolved solids, salinity, and electric conductivity of solid vermicast-inoculated biochar (solid line, green
square), vermicast tea-inoculated biochar (solid line, red rhombus), deionized water-inoculated biochar (solid line, blue triangle), biochar
alone (solid line, black round), and Promix-BX alone (broken line, brown dash) in deionized water. Vertical lines represent standard error
bars.

Ca2+ seemed to have increased linearly as sampling time VTB (Figure 2(c)). The fluctuations in the concentrations of
progressed. Amongst the biochar treatments, the highest K+ Ca2+ released into solution from the biochar treatments
concentration was recorded by the DWB treatment and the could be ascribed to ionic exchange activities on the car-
least was recorded by the Bioc treatment, while the SVB and bonaceous surface of the biochar. Therefore, the present
the VTB treatments were in between and not different. results can be explained by possible modification and ac-
 Comparatively, the release of K+ and Na+ into solution tivation of the biochar when it was inoculated with vermicast
from the Pro-BX was instant and consistently the least just or deionized water followed by an incubation period as
like the NO3−. This can be attributed to the highly soluble reported by Sizmur et al. [18]. From Figures 2(a)–2(d), it
nature of K and Na salts. However, the release of Na+ into seemed the concentrations of NO3−, K+, Ca2+, and Na+ from
solution was not different amongst the four biochar treat- each of the biochar treatments will continue to rise if the
ments. On the contrary, the release of Ca2+ into solution sampling time was extended beyond the 591 hr of the nu-
from the Pro-BX treatment was the fastest and the highest trient release study. The variation in the trend of nutrient
and was represented by a sigmoidal curve in Figure 2(c). The release from the different media treatments is an indication
result showed that the release of Ca2+ from the Pro-BX of possible variations in nutrient availability for plant uptake
steeply rose after the 100th hour of sampling before levelling and utilization for growth and development.
off. Overall, Ca2+ concentration of all the four biochar Chlorophyll fluorescence activity was used to assess
treatments fluctuated. The release of Ca2+ was highest for the photosynthetic activities in Swiss chard cv. Rhubarb chard
Bioc treatment followed by the SVB, then the DWB and the grown in different treatments. It was found that the
6 International Journal of Agronomy

 45 1050
 40 900

 Potassium content (mg/l)
 35
 Nitrate content (mg/l)

 750
 30
 25 600
 20 450
 15
 300
 10
 5 150

 0 0
 0 50 100 150 200 250 300 350 400 450 500 550 600 0 50 100 150 200 250 300 350 400 450 500 550 600
 Time of sampling (hr) Time of sampling (hr)
 (a) (b)
 400 1400
 350 1200

 Calcium content (mg/l)
 Sodium content (mg/l)

 300
 1000
 250
 800
 200
 600
 150
 400
 100
 50 200

 0 0
 0 50 100 150 200 250 300 350 400 450 500 550 600 0 50 100 150 200 250 300 350 400 450 500 550 600
 Time of sampling (hr) Time of sampling (hr)
 (c) (d)

Figure 2: Release of potassium, sodium, nitrate, and calcium contents of solid vermicast-inoculated biochar (solid line, green square),
vermicast tea-inoculated biochar (solid line, red rhombus), deionized water-inoculated biochar (solid line, blue triangle), biochar alone
(solid line, black round), and Promix-BX alone (broken line, brown dash) in deionized water. Vertical lines represent standard error bars.

maximum quantum yields also termed as efficiency of and SVB compared to the other treatments. This further
photosystem II (Fv/Fm) for the Swiss chard plants ranged confirmed the slow release of nutrients from biochar in-
between 0.76 and 0.78 and were not significantly (P > 0.05) oculated with vermicast.
different between treatments (data not presented). Leaf The number of Swiss chard green leaves and plant mass
chlorophyll content estimated using the SPAD value of leaf density, which indicate assimilate accumulation, were not
greenness was differentially influenced by the different significantly (P > 0.05) different among the treatments and
medium treatments. Prior to the first harvest, i.e., four weeks between the two harvest times (data not presented). How-
after transplanting, the SPAD value was significantly highest ever, other plant growth components such as plant height,
in plants grown in the treatment Pro-BX followed by stem diameter, leaf fresh weight, and total leaf area were
treatments SVB and VTB and lowest in treatments Bioc and clearly affected (Figures 4(a)–4(d)). These plant growth
DWB (Figure 3(a)). components were significantly (P < 0.05) increased by
 However, there was a remarkable change in the extent to treatment Pro-BX followed by treatments DWB and Bioc
which the treatments affected the SPAD value of leaf and the lowest by treatments SVB and VTB at the first
greenness at the second harvest at eight weeks after trans- harvest. But this growth trend changed at the second harvest.
planting. Treatments SVB and VTB equally increased SPAD Changes in plant height between the first and the second
value at the second harvest by ca. 0.44-fold compared to the harvests were prominent for VTB and SVB. It was found that
first harvest but was remarkably reduced in plants grown in plant height increased by approximately 2.03-fold for VTB
the Pro-BX by ca. 0.38-fold. It was noted that the change was, and by 0.67-fold for SVB and did not significantly (P > 0.05)
however, moderate in Swiss chard plants grown in the DWB change for Bioc or DWB, but significantly (P < 0.05) reduced
and the Bioc. Leaf anthocyanin content was similar for all the by ca. 0.45-fold for Pro-BX. Swiss chard plant stem diameter
plants irrespective of the medium treatment at the first was increased by approximately 1.66-fold for VTB and 0.59-
harvest (Figure 3(b)). At the second harvest, only treatments fold for SVB while minor nonsignificant changes were
VTB and SVB increased leaf anthocyanin contents by ca. recorded for Bioc and DWB. The Pro-BX, on the other hand,
0.80- and 0.95-fold, respectively. These findings indicated significantly (P < 0.05) reduced stem diameter by ca. 0.47-
that leaf pigmentation was significantly influenced by VTB fold at the second harvest. The trend for both total leaf
International Journal of Agronomy 7

 60.0 6.0
 A A A
 Leaf greenness (SPAD value)

 Anthocyanin content (ACI)
 50.0 5.0 B
 a
 40.0 b b 4.0
 C C
 30.0 c B c 3.0 C a
 B a a
 B a a
 20.0 2.0

 10.0 1.0

 0.0 0.0
 Bioc DWB SVB VTB Pro-BX Bioc DWB SVB VTB Pro-BX
 Treatments Treatments
 LG1 AC1
 LG2 AC2
 (a) (b)

Figure 3: Leaf greenness and anthocyanin content of Swiss chard (Beta vulgaris subsp. vulgaris) cv. Rhubarb chard as affected by biochar
alone (Bioc), deionized water-inoculated biochar (DWB), solid vermicast-inoculated biochar (SVB), vermicast tea-inoculated biochar
(VTB), and Promix-BX alone (Pro-BX). Lowercase and uppercase alphabetical letters represent mean separation by the least significant
difference (α � 0.05) at the first (1) and the second (2) harvests, respectively. Vertical lines on bars represent standard error of the means.

 25.0 10.0

 20.0 A 8.0 A
 Stem diameter (mm)
 Plant height (cm)

 a
 15.0 a 6.0
 B B
 b C b C BC b
 10.0 bc 4.0 bc BC C
 c D c c

 5.0 2.0

 0.0 0.0
 Bioc DWB SVB VTB Pro-BX Bioc DWB SVB VTB Pro-BX
 Treatments Treatments
 PH1 SD1
 PH2 SD2
 (a) (b)
 25.0 75.0
 a
 Total leaf fresh weight (g/plant)

 20.0 A 60.0
 Mean leaf area (cm2)

 15.0 a 45.0 b A
 bc
 b B c
 10.0 b b 30.0
 C C c d
 B
 5.0 D 15.0 BC
 D
 D
 0.0 0.0
 Bioc DWB SVB VTB Pro-BX Bioc DWB SVB VTB Pro-BX
 Treatments Treatments
 LFW1 LA1
 LFW2 LA2
 (c) (d)

Figure 4: Plant height (PH), stem diameter (SD), leaf area (LA), and total edible leaf fresh weight (LFW) of Swiss chard (Beta vulgaris subsp.
vulgaris) cv. Rhubarb chard as affected by biochar alone (Bioc), deionized water-inoculated biochar (DWB), solid vermicast-inoculated
biochar (SVB), vermicast tea-inoculated biochar (VTB), and Promix-BX alone (Pro-BX). Lowercase and uppercase alphabetical letters
represent mean separation by the least significant difference (α � 0.05) at the first (1) and the second (2) harvests, respectively. Vertical lines
on bars represent standard error of the means.
8 International Journal of Agronomy

surface area and fresh weight at first harvest was Pro- Biplot (axes F1 and F2: 92.0%)
BX > Bioc > DWB � SVB > VTB (Figures 4(c)–4(d)). This 1.5
 Pro-BX LG1
 AC1
trend drastically changed at the second harvest. The only 1.0
treatment that increased total leaf area and leaf fresh weight SVB AC2
 LG2 VTB
at the second harvest was VTB, i.e., by approximately 1.02- 0.5 SD1 LFW1 SD2
 LA2
 LA1
and 1.88-fold compared to those at the first harvest. On the PH2 LFW2

 F2 (22.7 %)
 PH1
 0.0
contrary, total leaf area was significantly (P < 0.05) reduced
by approximately 0.42-fold for SVB, 0.74-fold for DWB, –0.5
0.69-fold for Bioc, and 0.90-fold for Pro-BX (Figure 4(c)),
while leaf fresh weight was significantly reduced by ap- –1.0 Bioc

proximately 0.33-fold for DWB, 0.28-fold for Bioc, and 0.70- –1.5 DWB
fold for Pro-BX but was not altered by SVB (Figure 4(d)) at
the second harvest as compared to the first harvest. A 2- –2.0
 –2.0 –1.5 –1.0 –0.5 0.0 0.5 1.0 1.5 2.0
dimensional biplot principal component analysis (PCA) was
 F1 (69.3 %)
used to further explain relationships between the treatments
and the growth components. The PCA biplot explained 92% Active variables
of the variations in the dataset for the plant growth com- Active observations
ponents as affected by the media treatments Pro-BX, Bioc, Figure 5: A two-dimensional principal component analysis biplot
DWB, SVB, and VTB (Figure 5). showing relationships among media treatments as active variables
 There were distinct differences in the media except that and plant growth components as active observations. Plant growth
Bioc and DWB were similar and both appeared in the same components were leaf greenness (LG), anthocyanin content (AC),
quadrant on the PCA biplot. The plant growth components plant height (PH), stem diameter (SD), leaf area (LA), and total
at the first harvest can be found in the first quadrant with the edible leaf fresh weight (LFW) of Swiss chard (Beta vulgaris subsp.
Pro-BX treatment. This suggested that the PCA plot agreed vulgaris) cv. Rhubarb chard as affected by biochar alone (Bioc),
 deionized water-inoculated biochar (DWB), solid vermicast-in-
with Figures 3 and 4 that the Pro-BX treatment significantly
 oculated biochar (SVB), vermicast tea-inoculated biochar (VTB),
increased plant growth components at the first harvest. Both and Promix-BX alone (Pro-BX) at the first (1) and the second (2)
SVB and VTB can be found in quadrant 2 of the PCA biplot harvests, respectively.
with the plant growth components at the second harvest. The
location of SVB relative to VTB and the plant growth
components suggested that the latter was more effective in Data Availability
influencing the plant growth components. Neither Bioc nor
DWB influenced plant growth. These showed that the effect The nutrient release, plant nutrient uptake, and plant growth
of treatment VTB, which was not apparent in the first four data used to support the findings of this study are included
weeks, became obvious. Additionally, VTB recorded the within the supplementary information files.
highest effect on the Swiss chard plant growth components
at the second harvest. Thus, the VTB treatment delayed the Conflicts of Interest
release of nutrients but was made available eventually to
 The authors declare that they have no conflicts of interest.
increase the Swiss chard plant growth and yield during the
regrowth phase after the first harvest. These findings can be
confirmed by the results of the nutrient release experiments
 Acknowledgments
in Figures 1 and 2 as shown on the PCA biplot. The authors wish to thank Dr. Samuel Asiedu for his as-
 In conclusion, the study confirmed that inoculation of sistance during the experimentation and Dr. Nancy
biochar with vermicast can increase its adsorption capacity MacLean for her guidance on performing the statistical
for nutrients, which will subsequently be released slowly to analysis. However, the authors wish to thank Proton Power
plants for root uptake and plant utilization. It is evident from Inc., Tennessee, USA, for the donation of the biochar.
the present study that the nutrient release rate of inoculated
biochar is initially slow. Vermicast tea-inoculated biochar Supplementary Materials
and solid vermicast-inoculated biochar have similar nutrient
release patterns and proved to be highly activated. Inocu- The supplementary files with data showed in S1–S11 were
lated biochar characteristically releases nutrients slowly with used to report the outcomes of the study. The common
a long-lasting impact on growing media, environment, and acronyms used were as follows: Bioc � biochar alone;
ultimately, plant productivity. Comparatively, vermicast tea DWB � deionized water-inoculated biochar; SVB � solid
was the most effective in inoculation of the biochar, and as vermicast-inoculated biochar; VTB � vermicast tea-inocu-
such, it was the most efficacious under the conditions of this lated biochar; Pro-BX � Promix-BX soilless medium alone.
study. Future investigation should consider microbial ac- S1: the data for the various growing medium salinity content
tivities in these media. during the nutrient release studies. S2: the data for the
 DWB, deionized water-inoculated biochar; SVB, solid changes in electric conductivity of the solution when the
vermicast-inoculated biochar; VTB, vermicast tea-inocu- individual media were submerged in deionized water. S3: the
lated biochar; Pro-BX, Promix-BX. changes in the acidity level (i.e., pH) of the solution when the
International Journal of Agronomy 9

individual media were submerged in deionized water. S4: the [10] N. Hagemann, K. Spokas, H.-P. Schmidt, R. Kägi, M. Böhler,
total dissolved solids in solution when the individual media and T. Bucheli, “Activated carbon, biochar and charcoal:
were submerged in deionized water. S5, S6, S7, and S8: the linkages and synergies across pyrogenic carbon’s ABCs,”
concentrations of calcium, potassium, nitrate, and sodium Water, vol. 10, no. 2, pp. 182–201, 2018.
ions in solution when the individual media were submerged [11] C. Sreenivas, S. Muralidhar, and M. S. Rao, “Vermicompost: a
 viable component of IPNSS in nitrogen nutrition of ridge
in the deionized water. S9: the data for a two-dimensional
 gourd,” Annals of Agricultural Research, vol. 21, no. 1,
principal component analysis biplot showing relationships pp. 108–113, 2000.
among media treatments as active variables and plant [12] AOAC, Protein (Crude) in Animal Feed: Combustion Method,
growth components as active observations. Plant growth AOAC Official Method 990.03. Official Methods of Analysis,
components were leaf greenness (LG), anthocyanin content Association of Official Analytical Chemists, Gaithersburg,
(AC), plant height (PH), stem diameter (SD), leaf area (LA), MD, USA, 17th edition, 2003.
and total edible leaf fresh weight (LFW) of Swiss chard (Beta [13] AOAC, Metals and Other Elements in Plants and Pet Foods:
vulgaris subsp. vulgaris) cv. Rhubarb chard as affected by the Inductively Coupled Plasma Spectroscopic Method, AOAC
growing medium treatments at the first (1) and the second Official Method 968.08. Official Methods of Analysis, Asso-
(2) harvests, respectively. S10: the data for the mineral ciation of Official Analytical Chemists, Gaithersburg, MD,
 USA, 17th edition, 2003.
nutrient composition of the individual growing media be-
 [14] L. Abbey, S. A. Rao, L. N. Hodgins, and F. Briet, “Drying and
fore the beginning of the nutrient release studies. S11: the rehydration of vermicasts do not affect nutrient bioavailability
data for plant growth and yield components as affected by and seedling growth,” American Journal of Plant Nutrition
the individual growing medium treatments. (Supplementary and Fertilization Technology, vol. 3, no. 1, pp. 12–21, 2013.
Materials) [15] A. E. Louw-Gaume, I. M. Rao, A. J. Gaume, and E. Frossard,
 “A comparative study on plant growth and root plasticity
 responses of two Brachiaria forage grasses grown in nutrient
References solution at low and high phosphorus supply,” Plant and Soil,
 vol. 328, no. 1-2, pp. 155–164, 2010.
[1] G. Agegnehu, A. K. Srivastava, and M. I. Bird, “The role of
 [16] K. Maxwell and G. N. Johnson, “Chlorophyll fluorescence-a
 biochar and biochar-compost in improving soil quality and
 practical guide,” Journal of Experimental Botany, vol. 51,
 crop performance: a review,” Applied Soil Ecology, vol. 119,
 no. 345, pp. 659–668, 2000.
 pp. 156–170, 2017.
 [17] H. Wu, C. Lai, G. Zeng et al., “The interactions of composting
[2] R. Xiao, M. K. Awasthi, R. Li et al., “Recent developments in
 and biochar and their implications for soil amendment and
 biochar utilization as an additive in organic solid waste
 pollution remediation: a review,” Critical Reviews in Bio-
 composting: a review,” Bioresource Technology, vol. 246,
 technology, vol. 37, no. 6, pp. 754–764, 2016.
 pp. 203–213, 2017.
 [18] T. Sizmur, T. Fresno, G. Akgül, H. Frost, and E. Moreno-
[3] Y. Yuan, H. Chen, W. Yuan, D. Williams, J. T. Walker, and
 Jiménez, “Biochar modification to enhance sorption of in-
 W. Shi, “Is biochar-manure co-compost a better solution for
 organics from water,” Bioresource Technology, vol. 246,
 soil health improvement and N2O emissions mitigation?” Soil
 pp. 34–47, 2017.
 Biology and Biochemistry, vol. 113, pp. 14–25, 2017.
 [19] L. Martı́nez-Suller, G. Provolo, D. Brennan et al., “A note on
[4] A. Grewal, L. Abbey, and L. R. Gunupuru, “Production,
 the estimation of nutrient value of cattle slurry using easily
 prospects and potential application of pyroligneous acid in
 determined physical and chemical parameters,” Irish Journal
 agriculture,” Journal of Analytical and Applied Pyrolysis,
 of Agricultural and Food Resarch, vol. 49, pp. 93–97, 2010.
 vol. 135, pp. 152–159, 2018.
[5] G. Agegnehu, A. M. Bass, P. N. Nelson, B. Muirhead,
 G. Wright, and M. I. Bird, “Biochar and biochar-compost as
 soil amendments: effects on peanut yield, soil properties and
 greenhouse gas emissions in tropical North Queensland,
 Australia,” Agriculture, Ecosystems & Environment, vol. 213,
 pp. 72–85, 2015.
[6] N. Khan, I. Clark, M. A. Sanchez-Monedero et al., “Physical
 and chemical properties of biochars co-composted with
 biowastes and incubated with a chicken litter compost,”
 Chemosphere, vol. 142, pp. 14–23, 2016.
[7] F. Rees, C. Germain, T. Sterckeman, and J.-L. Morel, “Plant
 growth and metal uptake by a non-hyperaccumulating species
 (Lolium perenne) and a Cd-Zn hyperaccumulator (Noccaea
 caerulescens) in contaminated soils amended with biochar,”
 Plant and Soil, vol. 395, no. 1-2, pp. 57–73, 2015.
[8] J. Pietikainen, O. Kiikkila, and H. Fritze, “Charcoal as a habitat
 for microbes and its effect on the microbial community of the
 underlying humus,” Oikos, vol. 89, no. 2, pp. 231–242, 2000.
[9] L. Beesley, E. Moreno-Jiménez, and J. L. Gomez-Eyles, “Effects
 of biochar and greenwaste compost amendments on mobility,
 bioavailability and toxicity of inorganic and organic con-
 taminants in a multi-element polluted soil,” Environmental
 Pollution, vol. 158, no. 6, pp. 2282–2287, 2010.
You can also read