Faraday Discussions Air Quality in Megacities Volume: 226
←
→
Page content transcription
If your browser does not render page correctly, please read the page content below
Open Access Article. Published on 26 August 2020. Downloaded on 9/24/2021 10:21:07 AM.
                                                      This article is licensed under a Creative Commons Attribution-NonCommercial 3.0 Unported Licence.

                            Volume: 226
                                      Faraday
                                      Discussions
                                                                                                                                            View Journal | View Issue
                                                                                                                                                                        View Article Online

Air Quality in Megacities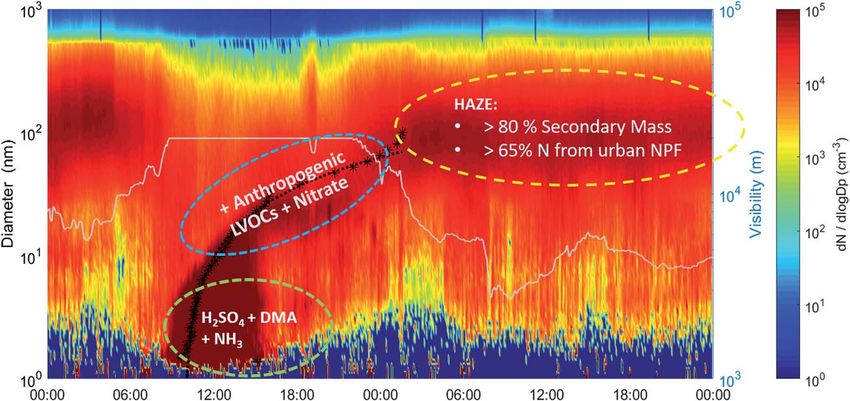
Faraday Discussions
This article is licensed under a Creative Commons Attribution-NonCommercial 3.0 Unported Licence.
Cite this: Faraday Discuss., 2021, 226, 334
PAPER
Open Access Article. Published on 26 August 2020. Downloaded on 9/24/2021 10:21:07 AM.
Is reducing new particle formation
a plausible solution to mitigate particulate
air pollution in Beijing and other Chinese
megacities?†
Markku Kulmala, *ab Lubna Dada, b Kaspar R. Daellenbach, b
Chao Yan, ab Dominik Stolzenburg, b Jenni Kontkanen, b
Ekaterina Ezhova,b Simo Hakala, b Saana Tuovinen,b
Tom V. Kokkonen, b Mona Kurppa, b Runlong Cai,b Ying Zhou,a
Rujing Yin,c Rima Baalbaki, b Tommy Chan,ab Biwu Chu, bd
Chenjuan Deng,c Yueyun Fu,c Maofa Ge, e Hong He, d
Liine Heikkinen,b Heikki Junninen,f Yiliang Liu,g Yiqun Lu,g Wei Nie,h
Anton Rusanen, b Ville Vakkari,ij Yonghong Wang,b Gan Yang,g Lei Yao,b
Jun Zheng, k Joni Kujansuu,ab Juha Kangasluoma,ab
Tuukka Petäjä, abh Pauli Paasonen, b Leena Järvi,bl
Douglas Worsnop,bm Aijun Ding,h Yongchun Liu,a Lin Wang, g
Jingkun Jiang, c Federico Bianchi ab and Veli-Matti Kerminenb
Received 26th June 2020, Accepted 25th August 2020
DOI: 10.1039/d0fd00078g
a
Aerosol and Haze Laboratory, Beijing Advanced Innovation Center for So Matter Science and Engineering,
Beijing University of Chemical Technology, Beijing, China. E-mail: markku.kulmala@helsinki.
b
Institute for Atmospheric and Earth System Research/Physics, Faculty of Science, University of Helsinki, Finland
c
State Key Joint Laboratory of Environment Simulation and Pollution Control, State Environmental Protection Key
Laboratory of Sources and Control of Air Pollution Complex, School of Environment, Tsinghua University, Beijing, China
d
State Key Joint Laboratory of Environment Simulation and Pollution Control, Research Center for Eco-
Environmental Sciences, Chinese Academy of Sciences, Beijing, China
e
Institute of Chemistry, Chinese Academy of Sciences, Beijing, China
f
Institute of Physics, University of Tartu, Ülikooli 18, EE-50090 Tartu, Estonia
Shanghai Key Laboratory of Atmospheric Particle Pollution and Prevention (LAP3), Department of
g
Environmental Science & Engineering, Fudan University, Shanghai 200438, China
h
Joint International Research Laboratory of Atmospheric and Earth System Sciences, School of Atmospheric
Sciences, Nanjing University, 210023 Nanjing, China
i
Finnish Meteorological Institute, 00560 Helsinki, Finland
j
Atmospheric Chemistry Research Group, Chemical Resource Beneciation, North-West University,
Potchefstroom, South Africa
k
Jiangsu Key Laboratory of Atmospheric Environment Monitoring and Pollution Control, Nanjing University of
Information Science & Technology, Nanjing 210044, China
l
Helsinki Institute of Sustainability Science, University of Helsinki, Finland
m
Aerodyne Research Inc., Billerica, Massachusetts 01821, USA
† Electronic supplementary information (ESI) available. See DOI: 10.1039/d0fd00078g
334 | Faraday Discuss., 2021, 226, 334–347 This journal is © The Royal Society of Chemistry 2021
This article is licensed under a Creative Commons Attribution-NonCommercial 3.0 Unported Licence. Paper Faraday Discussions
Atmospheric gas-to-particle conversion is a crucial or even dominant contributor to haze
formation in Chinese megacities in terms of aerosol number, surface area and mass. Based
on our comprehensive observations in Beijing during 15 January 2018–31 March 2019, we
are able to show that 80–90% of the aerosol mass (PM2.5) was formed via atmospheric
reactions during the haze days and over 65% of the number concentration of haze
particles resulted from new particle formation (NPF). Furthermore, the haze formation
Open Access Article. Published on 26 August 2020. Downloaded on 9/24/2021 10:21:07 AM.
was faster when the subsequent growth of newly formed particles was enhanced. Our
findings suggest that in practice almost all present-day haze episodes originate from
NPF, mainly since the direct emission of primary particles in Beijing has considerably
decreased during recent years. We also show that reducing the subsequent growth rate
of freshly formed particles by a factor of 3–5 would delay the buildup of haze episodes
by 1–3 days. Actually, this delay would decrease the length of each haze episode, so
that the number of annual haze days could be approximately halved. Such
improvement in air quality can be achieved with targeted reduction of gas-phase
precursors for NPF, mainly dimethyl amine and ammonia, and further reductions of SO2
emissions. Furthermore, reduction of anthropogenic organic and inorganic precursor
emissions would slow down the growth rate of newly-formed particles and
consequently reduce the haze formation.
1. Introduction
The rapid, large-scale urbanization and industrialization of China are unique in
history. Consequently, China’s air pollution situation has worsened dramatically
during the last 2–3 decades, as emissions from industrial activities, energy production
and traffic have increased.1 However, the clean air policies implemented in China
aer 2010 have reduced the emissions of some major pollutants (e.g. SO2, CO, NOx,
primary particulate matter) by up to several tens of percent, while having little effect
on ammonia and volatile organic compound (VOC) emissions.2 Highly non-linear
processes involving radiative transfer, atmospheric boundary layer (ABL) develop-
ment, atmospheric chemistry and aerosol dynamics create an urban pollution cock-
tail and generate secondary atmospheric pollutants, including ultrane particles, ne
particulate matter and ozone.3–7 Among the multiple negative environmental and
economic consequences of these pollutants,8 their adverse effects on human health
are of the greatest concern in China.9–11
Beijing and its vicinity is one of the most polluted areas in China, where high
particle mass concentrations causing haze are most frequent in winter.12–16 The
Beijing winter haze tends to occur in 5 to 7 day cycles, during which cleaner
periods are followed by haze episodes that typically last for 3 days.3,17,18 The haze
occurs preferably under southerly winds which bring warm and humid air along
with air pollutants from the industrial areas located south of Beijing.3,12,13,16,19–23
The local meteorological conditions found to be associated with haze formation
in Beijing include low wind speeds, high humidity of air and low intensity of solar
radiation.18,23–25 Climate warming arguably inuences weather conditions in such
a way that the likelihood of winter haze episodes in Beijing has already increased,
and is likely to increase further in the future.12,26–29
The development and ultimate severity of a haze episode depend on the
interplay between air pollutant emissions, their atmospheric transport, and the
processes responsible for accumulating and transforming these pollutants in the
This journal is © The Royal Society of Chemistry 2021 Faraday Discuss., 2021, 226, 334–347 | 335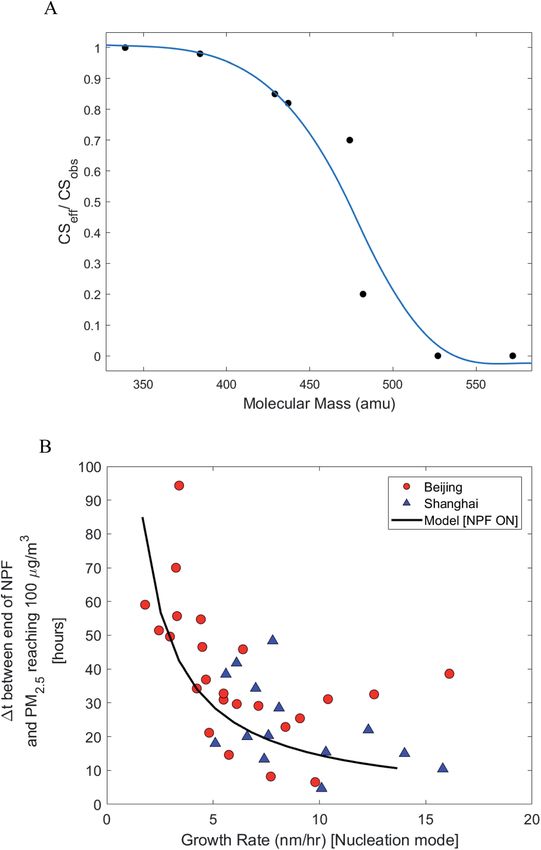
This article is licensed under a Creative Commons Attribution-NonCommercial 3.0 Unported Licence. Faraday Discussions Paper
7
ABL. In the case of Beijing haze, prior research has focused mainly on the
processes and feedbacks causing the highest particle mass concentrations, typi-
cally encountered during the nal stages of haze development.23 In 2014, Guo
et al.3 reported that atmospheric new particle formation (NPF) tends to precede
winter haze episodes in Beijing. However, it has remained unclear whether NPF
and haze formation are causally connected and, in case they are, to which extent
Open Access Article. Published on 26 August 2020. Downloaded on 9/24/2021 10:21:07 AM.
NPF might affect the formation and properties of haze. Here, we investigate how
NPF and subsequent particle growth affect the initial steps of haze formation in
Beijing and how reduced NPF and/or subsequent growth can affect haze
reduction.
2. Materials and methods
The measurement site is at the campus building of the Beijing University of
Chemical Technology (BUCT) in the western part of Beijing (39 560 3100 N,
116 170 5000 E). BUCT is located near the 3rd Ring Road of Beijing, and therefore,
close to fresh traffic emissions and is also surrounded by residential areas. The
particle number size distribution of 1 nm to 10 mm was measured with a home-
made Diethylene Glycol Scanning Mobility Particle Sizer (DEG-SMPS) and with
a Particle Size Magnier (PSM; Airmodus A11) and a Neutral cluster and Air Ion
Spectrometer (NAIS; Airel Ltd) in parallel. Additionally, ions in the mobility
diameter range of 0.8–42 nm were measured with the ion mode of the NAIS. More
details on the measurements of the particle number size distributions and the
parameters derived from the acquired data can be found in the ESI.† Additionally,
meteorological variables were measured by the Vaisala automatic weather station
AWS310 at the BUCT site. Trace gases including NOx, CO, O3 and SO2 were also
measured at BUCT (see ESI† for more details). To measure the composition of
PM2.5, an online Time-of-Flight Aerosol Chemical Speciation Monitor (ToF-ACSM)
equipped with a PM2.5 lens was utilized at the BUCT station from February 21 to
April 7, 2018. The Black Carbon (BC) mass concentration and absorption coeffi-
cient were measured by a dual spot aethalometer at BUCT. Details of the
measurement, chemical composition and source apportionment of PM2.5 are
provided in the ESI.†
3. From new particle formation to haze
In large urban areas, like Eastern China where megacities are tied to each other, the
sub-30 nm particle population has several sources and formation pathways. First,
atmospheric chemical reactions produce vapors that participate in atmospheric
clustering and subsequent growth of these clusters to form nucleation mode parti-
cles.30 Second, there are direct emissions of particles down to 5 nm diameter or even
below, especially related to traffic emissions.31–33 Since various gas-to-particle
conversion processes are heavily interlinked, it is difficult to resolve which fraction
of sub-30 nm particles originates from direct (primary) emissions and which fraction
results from atmospheric reactions (secondary formation).
We performed comprehensive measurements in Beijing between 15 January
2018 and 31 March 2019. The measurement site is located on a rooop of the
campus building at the Beijing University of Chemical Technology (BUCT) in the
western part of Beijing (Fig. S1†). A full description of the instrumentation used is
336 | Faraday Discuss., 2021, 226, 334–347 This journal is © The Royal Society of Chemistry 2021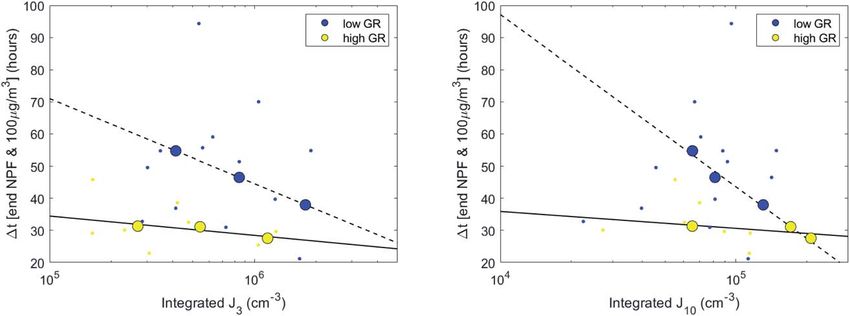
This article is licensed under a Creative Commons Attribution-NonCommercial 3.0 Unported Licence. Paper Faraday Discussions
given in the ESI, Section 1.† During the measurements, we observed 189 NPF
event days, of which over 50 were followed by a haze episode (Fig. S2–S4†). While
none of these haze episodes were extremely severe, most of them lasted for more
than two days so that the total number of haze days was 158 (haze lasting at least 8
hours). Interestingly, there was an NPF event before almost every haze episode,
whereas practically no NPF was detected during any of the haze episodes. Typi-
Open Access Article. Published on 26 August 2020. Downloaded on 9/24/2021 10:21:07 AM.
cally, within 15–20 hours, particles associated with the observed NPF events grew
to sizes large enough (>100 nm diameter) to be considered as haze particles
(Fig. S5†). Both atmospheric clustering and direct emissions, especially from
traffic, contributed to the sub-30 nm particle population. The observed particle
formation and growth rates (Table S1†) indicate that atmospheric clustering
contributes signicantly to NPF. Traffic and other sources contributed to the
emissions of precursor compounds participating in clustering, particle growth
and secondary aerosol mass formation during and before the haze periods.
Fig. 1 shows the median time evolution of the total particle number concen-
tration (N), condensation sink (CS) and volume concentration (V), along with the
corresponding size distributions, when considering all the 2 day periods during
which an NPF event day was followed by a day with no apparent NPF (see Fig. S4†
for this subset of days). The following day was in many cases a haze day. NPF
starts to increase the sub-3 nm and total particle number concentrations at
around 08:00 during the rst day. As a result, N peaks at around noon and then
declines gradually to a level that still considerably exceeds the total particle
number concentration observed before the NPF event. Sub-3 nm particles
contribute little to N aer about 16:00–17:00 during the rst day, suggesting that
atmospheric clustering and particularly the growth of clusters to the nucleation
mode become inactive aer the late aernoon of the rst day. Traffic emissions
cause increases in N (Fig. 1) during both morning and evening rush hours, and
contribute to the observed increases in CS and V during the following hours.
Besides traffic, there are no detectable changes in N caused by other primary
particle sources during the median 2 day period. Both CS and V increase in the
aernoon of the rst day, with no decline thereaer, indicating a continuous
production of (secondary) particulate surface and mass until the end of the 2 day
period. The observed increases are clearly faster during the daytime than at night,
which suggests that photochemical reactions enhance the formation of secondary
particulate matter. The temporal behavior of the daytime CS and V is very
different between the two days: during the rst day no increase in CS or V can be
observed until a few hours aer the start of NPF, while during the second day both
increase notably in the early morning. This means either that the initiation of
haze formation is connected causally with NPF, or that both of these phenomena
are caused by a common set of processes or atmospheric conditions.
Beijing is located not very far from the northern clean mountain regions. As
a result, if the measured air mass continued to arrive from the north, the particles
formed by atmospheric clustering grew slowly in size, making it difficult to
separate them from particles emitted by traffic (Fig. S6†). However, when the
measured air mass started to circle over more populated areas (Fig. S7†), the
particles formed by atmospheric clustering grew rapidly beyond 30 nm (Fig. S8†)
so that they became distinguishable from traffic emissions.
Despite the underlying uncertainties mentioned above, we attempted to esti-
mate the fraction of accumulation mode particles (>100 nm diameter) originating
This journal is © The Royal Society of Chemistry 2021 Faraday Discuss., 2021, 226, 334–347 | 337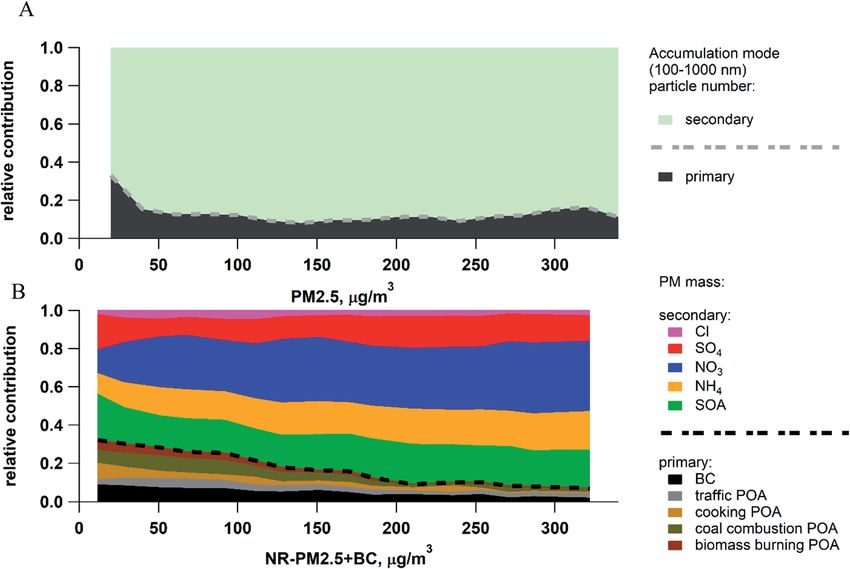
This article is licensed under a Creative Commons Attribution-NonCommercial 3.0 Unported Licence. Faraday Discussions Paper
Open Access Article. Published on 26 August 2020. Downloaded on 9/24/2021 10:21:07 AM.
Fig. 1 Time evolution (local time) of the (A) particle number size distribution and total number
concentrations of particles larger than 1.5 nm, 3 nm, 50 nm and 100 nm in diameter, (B)
condensation sink size distribution and total condensation sink (solid line), and (C) particle
volume size distribution and total volume concentrations of particles larger than 1.5 nm, 3 nm,
50 nm and 100 nm in diameter. The surface plots are calculated as a median of 15 cases (Table
S2†), in which an NPF event day was followed by a non-event day (this could be a haze day or
a day in the process of forming haze). In (A), right after the start of NPF, we observe a major
increase in the number concentrations of particles with diameters larger than 1.5 nm and 3 nm,
as demonstrated by the solid and broad-dashed lines. Around 6 hours later, we observe an
increase in the number concentrations of 50 nm and 100 nm particles. At the onset of NPF, we
observe a small contribution of the recently-formed particles to the total condensation sink
(solid line in (B)), which later systematically increases concurrent with the increase in larger
particle numbers (>50 nm and 100 nm) observed in (A). Finally, similar to the CS, we observe
a contribution to the total volume of particles, even though the volume of particles is domi-
nated by larger particles, easily visible from the fact that particles with diameters larger than
1.5 nm, 3 nm, 50 nm and 100 nm have almost the same total volume. A drop in visibility is
observed around midnight on the second day (Fig. S18†).
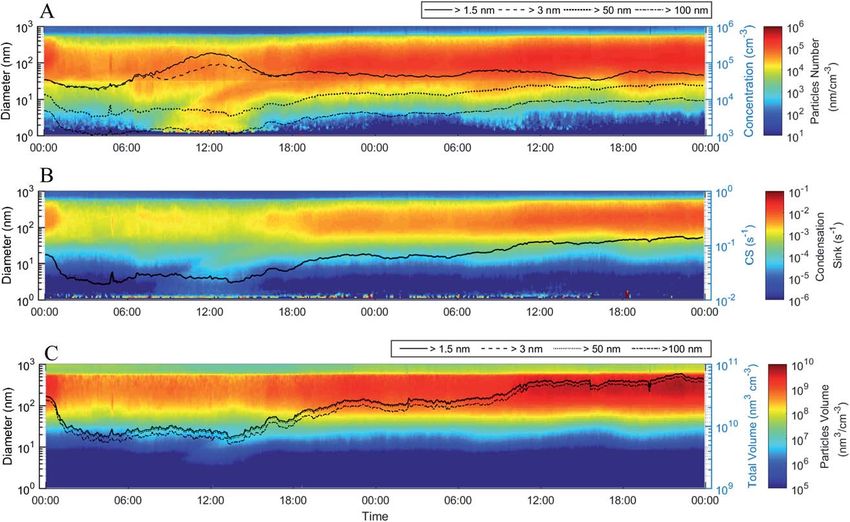
from direct emissions compared to secondary formation through different
approaches.34 Our results suggest that 65–80% of the accumulation mode parti-
cles originate from secondary formation (NPF) in the atmosphere during the
observed haze episodes (Fig. 2A, B and S9, S10†), and that this fraction was
already clearly above 50% before haze formation. Analyses of the particle phase
composition combined with advanced source apportionment techniques
(Fig. S11–S14†) showed that about 80–90% of the ne particle mass was secondary
during the haze episodes (Fig. 2B), with secondary inorganic matter aerosols
(SIAs, mostly NH4NO3 and (NH4)2SO4) being about twice as abundant as
secondary organic aerosols (SOAs).
4. The estimated time it takes from NPF to haze
formation
We investigated the time between NPF and subsequent formation of haze. These
results (Fig. 3) show that faster haze formation (reected by smaller time difference
338 | Faraday Discuss., 2021, 226, 334–347 This journal is © The Royal Society of Chemistry 2021This article is licensed under a Creative Commons Attribution-NonCommercial 3.0 Unported Licence. Paper Faraday Discussions
Open Access Article. Published on 26 August 2020. Downloaded on 9/24/2021 10:21:07 AM.
Fig. 2 (A) The fraction of primary particles in the accumulation mode (>100 nm) estimated
using the NOx tracer method (see ESI, Section 3.1), for the percentile line of 1% in Fig. S9
and S10.† (B) Relative contributions of black carbon (BC), primary organic aerosols (POAs)
from traffic, cooking, coal and biomass burning, secondary organic aerosols (SOAs),
ammonium (NH4), nitrate (NO3), sulphate (SO4), and chloride (Cl) to the total PM2.5 mass
concentration as a function of the non-refractory PM2.5 mass concentration. Our
observations mean that most of the accumulation mode particles are secondary, which
confirms our hypothesis that secondary sources also contribute to the number concen-
tration and not only to the mass concentration. With increasing PM2.5, the relative
contribution of secondary PM2.5 (SOAs, NH4, NO3, SO4, Cl) increases up to 90% of the total
PM2.5 mass concentration.
Dt on the y-axis) was associated primarily with a larger number of particles produced
by the NPF event preceding the haze, and secondarily with a higher growth rate (GR)
of the newly formed particles. Since the eventual clearing of haze is dictated by
larger-scale weather conditions, the length of a haze episode is strongly related to
how quickly haze forms. If the underlying cause governing the speed of haze
formation is NPF, then our ndings suggest that NPF has the potential to consid-
erably increase the total number of haze days, typically by 1–2 days for each haze
episode. On the other hand, since during our observation period we observed 57
haze episodes and since the normal cycle from haze formation to clearance lasts up
to 7 days,3,17,18 we could cut the number of haze days to almost half by reducing the
vapors responsible for the growth of nucleation mode particles.
Aer establishing the strong linkage between NPF and haze formation, we
explore whether faster haze formation could be causally connected to NPF in the
following sections.
First, we started from the unresolved puzzle of why and by which mechanisms
NPF is possible in a polluted environment like Beijing.30 Based on our recent
observations that clusters composed of sulfuric acid (H2SO4) and dimethyl amine
(DMA) are crucial in producing new aerosol particles in both Shanghai and Bei-
jing,35,36 we estimated the effective condensation sink (CSeff) of such clusters using
This journal is © The Royal Society of Chemistry 2021 Faraday Discuss., 2021, 226, 334–347 | 339This article is licensed under a Creative Commons Attribution-NonCommercial 3.0 Unported Licence. Faraday Discussions Paper
Open Access Article. Published on 26 August 2020. Downloaded on 9/24/2021 10:21:07 AM.
Fig. 3 The time difference between the end of the NPF event and the time when the
PM2.5 concentration reaches 100 mg m3 as a function of the (left panel) total number
of 3 nm particles produced during the NPF event and (right panel) total number of
10 nm particles produced during the NPF event. The points are divided into points with
low growth rate (GR < 6 nm h1) shown in blue and points with high growth rate (GR >
6 nm h1) shown in yellow. The data points are binned based on the number
concentration (x-axis). A linear fit for the points with low GR is shown as a dashed line
and one for the points with high GR is shown as a solid line. Our results show that an
increase in the total number of formed 3 nm or 10 nm particles results in a shorter time
needed to form haze. Accordingly, a decrease in the intensity of NPF could result in
delaying the haze formation. The data set with larger values of GR shows faster haze
development. More specifically, decreasing the total number of formed 3 nm particles
by a factor of 2 results in delaying the haze formation by up to 40 and 60 hours for
cases with low and high GR, respectively. Reducing particle growth rates by 50% (a
shift from yellow to blue points), e.g. by reducing anthropogenic VOC concentrations,
will delay haze formation by between about 20 and 50 hours.
heterogeneous nucleation theory37 (Fig. 4A, see details in the ESI, Section 3.3†).
We found that, depending on the contact angle of heterogeneous nucleation and
the properties of the nucleating vapor, CSeff can be substantially lower, by a factor
of more than 100, than CS obtained using the traditional assumption that clusters
are scavenged by larger (mainly accumulation mode) particles upon every colli-
sion with them. Low values of CSeff/CS for H2SO4–DMA clusters can explain why
such clusters are able to survive in polluted air to produce growing nanoparticles.
Additionally, this observation indicates that vapors with a low heterogeneous
nucleation probability on accumulation mode particles might prefer condensing
onto the nucleation mode over the accumulation mode. Investigating the contact
angles of vapours under atmospherically relevant conditions remains essential,
especially since the contact angles of nucleation of atmospheric vapors are still
unknown.
Second, regardless of their exact origin and formation pathway, fresh particles
produced by NPF are likely to have a chemical composition very different from
that of accumulation mode particles. The chemically distinct aerosol surface and
volume of these particles facilitate heterogeneous reactions that contribute to
their growth38 and, as a side product, produce secondary aerosol mass. We found
that the growth rates of aerosol particles produced by NPF (measured as a func-
tion of time and size, Fig. S7†) appear not to depend on the particle size for
particles larger than 25 nm. This is consistent with surface reactions (reactive
uptake) being the dominant growth mechanism39 for these particles.
340 | Faraday Discuss., 2021, 226, 334–347 This journal is © The Royal Society of Chemistry 2021This article is licensed under a Creative Commons Attribution-NonCommercial 3.0 Unported Licence. Paper Faraday Discussions
Open Access Article. Published on 26 August 2020. Downloaded on 9/24/2021 10:21:07 AM.
Fig. 4 (A) The ratio between effective and total condensation sink, CSeff/CS, for sulfuric acid–
DMA clusters as a function of condensing cluster mass was estimated using heterogeneous
nucleation theory with a constant contact angle of 45 (see details in the ESI, Section 3.4†). (B)
Measured and modeled effect of the growth rate of freshly formed particles by NPF on the time
needed for formation of haze. The measured data in the figure covers the 15 months in Beijing
between Jan 1 2018 and Mar 31 2019; the Shanghai data (see the ESI, Section 1.9† for details)
spans the dates from 25 February 2014 to 25 February 2016. The curve shows the results of
model calculations. The model simulations are described in the ESI (Section 3.3).†
This journal is © The Royal Society of Chemistry 2021 Faraday Discuss., 2021, 226, 334–347 | 341This article is licensed under a Creative Commons Attribution-NonCommercial 3.0 Unported Licence. Faraday Discussions Paper
Table 1 The influence of enhanced aerosol mass growth rate (first column), caused by the
reactive aerosol surface area originating from NPF, on the aerosol mass concentration
after 10 hours (second column) and 24 hours (third column) of ageing, and the time it takes
for the aerosol mass concentration to reach 100 mg m3 (fourth column). The initial
(before NPF) aerosol mass concentration and growth rate were set equal to 10 mg m3 and
1 mg m3 per hour, respectively. Without any enhancement in aerosol mass growth, it
would take 90 hours for the aerosol mass concentration to reach 100 mg m3
Open Access Article. Published on 26 August 2020. Downloaded on 9/24/2021 10:21:07 AM.
The time it takes for
Enhanced mass the aerosol mass
growth rate (times the Additional aerosol Additional aerosol concentration to
original value) mass aer 10 hours mass aer 24 hours reach 100 mg m3
1.01 1 mg m3 6.5 mg m3 57 hours
1.04 4.8 mg m3 37.5 mg m3 31 hours
1.10 16 mg m3 212.4 mg m3 18 hours
Third, we investigated the effect of enhanced aerosol mass growth (dM/dt ¼
DM/Dt) due to surface reactions on haze formation by assuming that the
increased reactive surface area is due to NPF. We used a simple conceptual model
and set the initial (before NPF) aerosol mass concentration and growth rate equal
to 10 mg m3 and 1 mg m3 per hour, respectively. The results (Table 1) show that
even small enhancements in the mass growth rate due to new reactive aerosol
surfaces will lead to signicant increases in the accumulated aerosol mass, and
that a mass growth rate enhancement of 10% is sufficient for haze (100 mg m3) to
form within 24 hours. This supports our observations that without NPF the time
needed for haze formation is signicantly longer.
How would preferential heterogeneous nucleation and reactive uptake on the
nucleation mode compared with the accumulation mode affect how fast haze
forms? We performed simulations using a simple but realistic model (see ESI,
Section 3.4, Fig. S15†) that has two modes, a growing mode (originating from
NPF) and an accumulation mode, and two different vapors. We assume that one
of these vapors condenses irreversibly onto both modes, representing all low-
volatility vapors, whereas the other vapor can be taken up only by the growing
mode, representing vapors that show preferential heterogeneous nucleation or
reactive uptake with nucleation mode particles. By repeating these simulations
for a large number of cases with different initial conditions, we obtained essen-
tially the same result as that observed in the atmosphere (see Fig. 4B): higher
growth rates of the nucleation particle mode following NPF lead to faster haze
formation.
5. Potential solutions for mitigating winter haze
In Fig. 5 we summarize our main ndings from clustering to haze formation. The
particulate matter formed during haze episodes in Beijing is mainly secondary, in
terms of both particle number and mass concentration (Fig. 2). This, together
with our other ndings listed above, suggests that a reduction in the strength of
NPF and subsequent particle growth would delay the starting times of haze
episodes and reduce particle mass concentrations during these episodes. By
reducing the number of particles formed during an NPF event by a factor of 4, we
342 | Faraday Discuss., 2021, 226, 334–347 This journal is © The Royal Society of Chemistry 2021This article is licensed under a Creative Commons Attribution-NonCommercial 3.0 Unported Licence. Paper Faraday Discussions
Open Access Article. Published on 26 August 2020. Downloaded on 9/24/2021 10:21:07 AM.
Fig. 5 The main mechanisms of NPF and subsequent particle growth. The initial stages of
NPF are dominated by formation of sulfuric acid–DMA clusters, with additional contri-
butions by ammonia. Growth of particles larger than 3 nm in diameter is mainly due to
anthropogenic low-volatility organic and inorganic compounds. Heterogeneous chem-
istry, including reactive uptake of aerosol precursors, is crucial for the production of
secondary aerosol mass.
might be able to delay the initiation of haze by up to 40 hours, particularly if we
can decrease their growth rate at the same time. The most effective way to reduce
NPF strength is to reduce DMA emissions together with H2SO4 concentrations
originating predominantly from gas-phase SO2 oxidation, since H2SO4–DMA
clustering has been shown to be an effective pathway in megacities.35 Reductions
in anthropogenic inorganic and organic gas-phase precursor emission would
decrease the growth rates of newly-formed particles and further delay haze
formation. A potential delay of 1–2 days per haze period would mean 16 to 32
fewer haze days each winter in Beijing.
Major clean air policies have already been implemented to reduce SO2 emis-
sions in China,2 especially in the North China Plain surrounding Beijing. As
a result, SO2 concentrations in the surface air have decreased considerably during
the recent years.40 Though the sulfate aerosol mass decreased, the observed
reduction in the PM2.5 concentration was smaller,40 partly due to compensating
effects of more efficient nitrate formation.41 Other contributors to PM2.5 (SOAs,
NH4+ and NO3) will likely be targeted in future emission reductions. When it
comes to particle number concentrations, practically no change in the NPF event
frequency in Beijing was observed in the past four years (Fig. S3†). This indicates
that SO2 concentrations have probably not yet reached levels low enough to make
them a limiting factor for NPF in Beijing. The apparent lack of major emission
changes for the other precursors for NPF and subsequent particle growth, espe-
cially NH3 and VOCs2 and probably also amines, during recent years is consistent
with this picture.
During our research period of about 400 days in Beijing, we had 189 NPF event
days and more than 50 of them were followed by a haze episode. In practice
almost no haze episodes were recorded without a preceding NPF event. Based on
our results, we identify potential solutions to reduce aerosol formation and
growth rates that will reduce the strength and frequency of NPF, leading to less
This journal is © The Royal Society of Chemistry 2021 Faraday Discuss., 2021, 226, 334–347 | 343This article is licensed under a Creative Commons Attribution-NonCommercial 3.0 Unported Licence. Faraday Discussions Paper
haze formation: (1) further reducing SO2 emissions to decrease H2SO4 concen-
trations and weaken both NPF and formation of particulate sulfate; (2) reducing
amine and ammonia emissions to decrease the strength of NPF; and (3) reducing
anthropogenic organic and inorganic gas-phase precursor emissions to decrease
the rate at which particles formed by NPF grow into haze particles. Using our
current emission estimates for the Beijing–Tianjing–Hebei area (see ESI†), the
Open Access Article. Published on 26 August 2020. Downloaded on 9/24/2021 10:21:07 AM.
regional SO2 emissions are split mainly between industrial combustion (60%),
residential combustion (20%) and power production (10%), with more than 70%
of these emissions being related to coal combustion, whereas approximately 90%
of the NH3 emissions originate from agriculture. No official emission data for
amines in this region exists, but our measurements in Beijing indicate a large
contribution from local traffic. Based on Fig. 3 and 4, a reduction by a factor of 3–5
in the particle growth rate will delay the onset of haze by 1–3 days and conse-
quently provide more time for the synoptic meteorological situation to change.
This has the potential to cut the total number of haze days by more than half. In
order to verify the efficiency of imposed control mechanisms, and to understand
how the mutual effects of aerosol precursor emissions and changes in conden-
sation sink affect NPF and ultimately haze, we need continuous and compre-
hensive observations in Chinese megacities, as suggested by Kulmala.6
Author contributions
All co-authors contributed to revising and commenting on the manuscript.
Scientic discussions and interpretations
MK, LD, KRD, CY, DS, JKon, EE, TP, PP, DW, AD, LW, JJ, FB, VMK.
Data analysis
MK, LD, KRD, CY, JKon, EE, SH, ST, TK, MoK, RC, YZ, RY, RB.
Modeling
EE, ST.
Writing
MK, LD, KRD, CY, DS, JKon, VMK.
Measurements
KRD, CY, TK, YZ, RY, TC, BC, CD, YF, LH, HJ, YiLiu, YLu, AR, VV, YW, GY, LY, JZ,
JKan, JKuj, YoLiu.
Conflicts of interest
The authors declare no conict of interest.
344 | Faraday Discuss., 2021, 226, 334–347 This journal is © The Royal Society of Chemistry 2021This article is licensed under a Creative Commons Attribution-NonCommercial 3.0 Unported Licence. Paper Faraday Discussions
Acknowledgements
We thank Maija Peltola for providing the growth rate code. The work is supported
by the Academy of Finland via the Center of Excellence in Atmospheric Sciences
(project no. 307331) and the European Research Council via ATM-GTP (742206).
This research has also received funding from the European Union’s Horizon 2020
Open Access Article. Published on 26 August 2020. Downloaded on 9/24/2021 10:21:07 AM.
research and innovation programme under the Marie Sklodowska-Curie grant
agreement no. 895875 (“NPF-PANDA”), the Academy of Finland (project no.
316114 & 315203) as well as the Doctoral Programme in Atmospheric Sciences at
the University of Helsinki. Partial support from the National Key R&D Program of
China (2017YFC0209503 & 2017YFC0209505), the National Natural Science
Foundation of China (21876094 & 91644213 & 41730106), and Samsung PM2.5
SRP is acknowledged. Moreover, this research received support from a Swiss
National Science postdoc mobility grant (P2EZP2_181599).
References
1 R. Han, et al., Spatial and temporal variation of haze in China from 1961 to
2012, J. Environ. Sci., 2016, 46, 134–146, DOI: 10.1016/j.jes.2015.12.033.
2 B. Zheng, et al., Trends in China’s anthropogenic emissions since 2010 as the
consequence of clean air actions, Atmos. Chem. Phys., 2018, 18, 14095–14111,
DOI: 10.5194/acp-18-14095-2018.
3 S. Guo, et al., Elucidating severe urban haze formation in China, Proc. Natl.
Acad. Sci. U. S. A., 2014, 111, 17373–17378, DOI: 10.1073/pnas.1419604111.
4 R.-J. Huang, et al., High secondary aerosol contribution to particulate pollution
during haze events in China, Nature, 2014, 514, 218, DOI: 10.1038/
nature13774.
5 M. Kulmala, Atmospheric chemistry: China’s choking cocktail, Nature, 2015,
526, 497, DOI: 10.1038/526497a.
6 M. Kulmala, Build a global Earth observatory, Nature, 2018, 553, 21–23, DOI:
10.1038/d41586-017-08967-y.
7 Z. Li, et al., Aerosol and boundary-layer interactions and impact on air quality,
Natl. Sci. Rev., 2017, 4, 810–833, DOI: 10.1093/nsr/nwx117.
8 Y. Gu, et al., Impacts of sectoral emissions in China and the implications: air
quality, public health, crop production, and economic costs, Environ. Res. Lett.,
2018, 13, 084008, DOI: 10.1088/1748-9326/aad138.
9 R. Burnett, et al., Global estimates of mortality associated with long-term
exposure to outdoor ne particulate matter, Proc. Natl. Acad. Sci. U. S. A.,
2018, 115, 9592–9597, DOI: 10.1073/pnas.1803222115.
10 J. Hu, et al., Premature Mortality Attributable to Particulate Matter in China:
Source Contributions and Responses to Reductions, Environ. Sci. Technol.,
2017, 51, 9950–9959, DOI: 10.1021/acs.est.7b03193.
11 J. Lelieveld, J. S. Evans, M. Fnais, D. Giannadaki and A. Pozzer, The
contribution of outdoor air pollution sources to premature mortality on
a global scale, Nature, 2015, 525, 367, DOI: 10.1038/nature15371.
12 W. Cai, K. Li, H. Liao, H. Wang and L. Wu, Weather conditions conducive to
Beijing severe haze more frequent under climate change, Nat. Clim. Change,
2017, 7, 257, DOI: 10.1038/nclimate3249.
This journal is © The Royal Society of Chemistry 2021 Faraday Discuss., 2021, 226, 334–347 | 345This article is licensed under a Creative Commons Attribution-NonCommercial 3.0 Unported Licence. Faraday Discussions Paper
13 H. Chen and H. Wang, Haze Days in North China and the associated
atmospheric circulations based on daily visibility data from 1960 to 2012, J.
Geophys. Res.: Atmos., 2015, 120, 5895–5909, DOI: 10.1002/2015jd023225.
14 J. He, et al., Analyses of winter circulation types and their impacts on haze
pollution in Beijing, Atmos. Environ., 2018, 192, 94–103, DOI: 10.1016/
j.atmosenv.2018.08.060.
Open Access Article. Published on 26 August 2020. Downloaded on 9/24/2021 10:21:07 AM.
15 B. Lv, B. Zhang and Y. Bai, A systematic analysis of PM2.5 in Beijing and its
sources from 2000 to 2012, Atmos. Environ., 2016, 124, 98–108, DOI: 10.1016/
j.atmosenv.2015.09.031.
16 X. Wang, et al., Characteristics and classication of PM2.5 pollution episodes
in Beijing from 2013 to 2015, Sci. Total Environ., 2018, 612, 170–179, DOI:
10.1016/j.scitotenv.2017.08.206.
17 Y. Jia, K. A. Rahn, K. He, T. Wen and Y. Wang, A novel technique for
quantifying the regional component of urban aerosol solely from its
sawtooth cycles, J. Geophys. Res.: Atmos., 2008, 113, D21309, DOI: 10.1029/
2008jd010389.
18 G. Zheng, et al., Episode-Based Evolution Pattern Analysis of Haze Pollution:
Method Development and Results from Beijing, China, Environ. Sci.
Technol., 2016, 50, 4632–4641, DOI: 10.1021/acs.est.5b05593.
19 C. Jiang, H. Wang, T. Zhao, T. Li and H. Che, Modeling study of PM2.5 pollutant
transport across cities in China’s Jing–Jin–Ji region during a severe haze
episode in December 2013, Atmos. Chem. Phys., 2015, 15, 5803–5814, DOI:
10.5194/acp-15-5803-2015.
20 X. Tie, et al., A budget analysis of the formation of haze in Beijing, Atmos.
Environ., 2015, 100, 25–36, DOI: 10.1016/j.atmosenv.2014.10.038.
21 P. Wu, Y. Ding and Y. Liu, Atmospheric circulation and dynamic mechanism
for persistent haze events in the Beijing–Tianjin–Hebei region, Adv. Atmos.
Sci., 2017, 34, 429–440, DOI: 10.1007/s00376-016-6158-z.
22 G. J. Zheng, et al., Exploring the severe winter haze in Beijing: the impact of
synoptic weather, regional transport and heterogeneous reactions, Atmos.
Chem. Phys., 2015, 15, 2969–2983, DOI: 10.5194/acp-15-2969-2015.
23 J. Zhong, et al., Feedback effects of boundary-layer meteorological factors on
cumulative explosive growth of PM2.5 during winter heavy pollution episodes
in Beijing from 2013 to 2016, Atmos. Chem. Phys., 2018, 18, 247–258, DOI:
10.5194/acp-18-247-2018.
24 Z. Chen, et al., Understanding meteorological inuences on PM2.5
concentrations across China: a temporal and spatial perspective, Atmos.
Chem. Phys., 2018, 18, 5343–5358, DOI: 10.5194/acp-18-5343-2018.
25 L. Zhang, T. Wang, M. Lv and Q. Zhang, On the severe haze in Beijing during
January 2013: unraveling the effects of meteorological anomalies with WRF-
Chem, Atmos. Environ., 2015, 104, 11–21, DOI: 10.1016/
j.atmosenv.2015.01.001.
26 H. Chen, H. Wang, J. Sun, Y. Xu and Z. Yin, Anthropogenic ne particulate
matter pollution will be exacerbated in eastern China due to 21st century
GHG warming, Atmos. Chem. Phys., 2019, 19, 233–243, DOI: 10.5194/acp-19-
233-2019.
27 Z. Han, B. Zhou, Y. Xu, J. Wu and Y. Shi, Projected changes in haze pollution
potential in China: an ensemble of regional climate model simulations, Atmos.
Chem. Phys., 2017, 17, 10109–10123, DOI: 10.5194/acp-17-10109-2017.
346 | Faraday Discuss., 2021, 226, 334–347 This journal is © The Royal Society of Chemistry 2021This article is licensed under a Creative Commons Attribution-NonCommercial 3.0 Unported Licence. Paper Faraday Discussions
28 L. Shen, D. J. Jacob, L. J. Mickley, Y. Wang and Q. Zhang, Insignicant effect of
climate change on winter haze pollution in Beijing, Atmos. Chem. Phys., 2018,
18, 17489–17496, DOI: 10.5194/acp-18-17489-2018.
29 X. Zhang, J. Zhong, J. Wang, Y. Wang and Y. Liu, The interdecadal worsening
of weather conditions affecting aerosol pollution in the Beijing area in relation
to climate warming, Atmos. Chem. Phys., 2018, 18, 5991–5999, DOI: 10.5194/
Open Access Article. Published on 26 August 2020. Downloaded on 9/24/2021 10:21:07 AM.
acp-18-5991-2018.
30 M. Kulmala, V. M. Kerminen, T. Petäjä, A. J. Ding and L. Wang, Atmospheric
gas-to-particle conversion: why NPF events are observed in megacities?,
Faraday Discuss., 2017, 200, 271–288, DOI: 10.1039/c6fd00257a.
31 T. Rönkkö, et al., Traffic is a major source of atmospheric nanocluster aerosol,
Proc. Natl. Acad. Sci. U. S. A., 2017, 114, 7549–7554, DOI: 10.1073/
pnas.1700830114.
32 J. Kontkanen, et al., Size-resolved particle number emissions in Beijing
determined from measured particle size distributions, Atmos. Chem. Phys.,
2020, 20, 11329–11348, DOI: 10.5194/acp-20-11329-2020.
33 Y. Zhou, et al., Variation of size-segregated particle number concentrations in
wintertime Beijing, Atmos. Chem. Phys., 2020, 20, 1201–1216, DOI: 10.5194/acp-
20-1201-2020.
34 M. Kulmala, et al., On the mode-segregated aerosol particle number
concentration load: contributions of primary and secondary particles in
Hyytiala and Nanjing, Boreal Environ. Res., 2016, 21, 319–331.
35 L. Yao, et al., Atmospheric new particle formation from sulfuric acid and
amines in a Chinese megacity, Science, 2018, 361, 278–281, DOI: 10.1126/
science.aao4839.
36 C. Deng, et al., Seasonal Characteristics of New Particle Formation and Growth
in Urban Beijing, Environ. Sci. Technol., 2020, 54(14), 8547–8557, DOI: 10.1021/
acs.est.0c00808.
37 S. Tuovinen, J. Kontkanen, J. Jiang and M. Kulmala, Investigating the
effectiveness of condensation sink based on heterogeneous nucleation
theory, J. Aerosol Sci., 2020, 149, 105613, DOI: 10.1016/j.jaerosci.2020.105613.
38 I. Riipinen, et al., The contribution of organics to atmospheric nanoparticle
growth, Nat. Geosci., 2012, 5, 453, DOI: 10.1038/ngeo1499.
39 S. K. Friedlander, Smoke, Dust, and Haze: Fundamentals of Aerosol Dynamics,
Wiley-Interscience, New York, 1977, vol. 333.
40 J. M. Moch, et al., Contribution of Hydroxymethane Sulfonate to Ambient
Particulate Matter: A Potential Explanation for High Particulate Sulfur
During Severe Winter Haze in Beijing, Geophys. Res. Lett., 2018, 45, 11-969–
11-979, DOI: 10.1029/2018gl079309.
41 X. Fu, et al., Persistent Heavy Winter Nitrate Pollution Driven by Increased
Photochemical Oxidants in Northern China, Environ. Sci. Technol., 2020, 54,
3881–3889, DOI: 10.1021/acs.est.9b07248.
This journal is © The Royal Society of Chemistry 2021 Faraday Discuss., 2021, 226, 334–347 | 347You can also read