A method to analyze the influence of mechanical strain on dermal collagen morphologies - Nature
←
→
Page content transcription
If your browser does not render page correctly, please read the page content below
www.nature.com/scientificreports
OPEN A method to analyze the influence
of mechanical strain on dermal
collagen morphologies
Maximilian Witte1,2, Michael Rübhausen1, Sören Jaspers2, Horst Wenck2 & Frank Fischer2*
Collagen fibers and their orientation play a major role in the mechanical behavior of soft biological
tissue such as skin. Here, we present a proof-of-principle study correlating mechanical properties
with collagen fiber network morphologies. A dedicated multiphoton stretching device allows for
mechanical deformations in combination with a simultaneous analysis of its collagen fiber network by
second harmonic generation imaging (SHG). The recently introduced Fiber Image Network Evaluation
(FINE) algorithm is used to obtain detailed information about the morphology with regard to fiber
families in collagen network images. To demonstrate the potential of our method, we investigate an
isotropic and an anisotropic ex-vivo dorsal pig skin sample under quasi-static cyclic stretching and
relaxation sequences. Families of collagen fibers are found to form a partially aligned collagen network
under strain. We find that the relative force uptake is accomplished in two steps. Firstly, fibers align
within their fiber families and, secondly, fiber families orient in the direction of force. The maximum
alignment of the collagen fiber network is found to be determined by the largest strain. Isotropic and
anisotropic samples reveal a different micro structural behavior under repeated deformation leading
to a similar force uptake after two stretching cycles. Our method correlates mechanical properties
with morphologies in collagen fiber networks.
Skin is the largest organ of the human body and it is responsible for the bodys protection towards external factors.
In our daily life skin is able to undergo large strains of up to 25 %1. The mechanical functionality of skin is altered
due to aging2, scars3 and skin diseases like the Ehlers-Danlos syndrome4. The microstructural identification and
quantification of these factors is crucial for the development of counteractive biological approaches.
Collagen fibers are known to dominate the mechanical properties of skin and are also one of its main
constituents5–8. Upon stretching of skin, collagen fibers straighten, align in the direction of force and, at high
strains, slide against each o ther9,10. There is a discussion about the onset of fiber alignment in the l iterature6. It is
assumed that the unstressed orientation distribution of the dermal collagen fiber network defines the anisotropic
mechanical behavior of s kin11,12. Furthermore, diverse viscoelastic properties such as creep, stress relaxation,
strain history-dependence, and strain-rate dependence are believed to depend on the collagen fiber n etwork13–18.
Indeed previous second harmonic generation (SHG) i maging19 at different stretching states has shown that the
fibers orient along the force d irection6,10. However, a microstructural interpretation of the observed changes of
collagen networks requires a suitable approach to characterize and quantify complex fiber networks in fiber-
reinforced materials.
In order to understand the properties of the dermal collagen fiber network under cyclic loads, we use a
dedicated multiphoton stretching device and determine the network properties by the recently introduced Fiber
Image Network Evaluation (FINE) algorithm20,21. The FINE algorithm evaluates the number of fiber families,
their angular properties, and the alignment index. It is based on the cumulative orientation d istribution20 and
was successfully applied to a stack of in-vivo SHG images of human dermal c ollagen21. The FINE algorithm was
also applied to silver-nanowire composites under mechanical s train22. Here, we present a method allowing for
SHG imaging, while simultaneously deforming the sample. On each image representing a specific strain state,
the FINE algorithm is applied to quantify the orientation of the collagen fiber n etwork21.
Results and discussion
Sample stretching and image processing. The multiphoton stretching device that is used for deform-
ing skin, while simultaneously capturing its collagen fiber network, is shown in Fig. 1a and Supplementary Fig. 1.
An exemplary deformation protocol is shown in Fig. 1b. Four consecutive cycles of repeated stretching and
1
Center for Free‑Electron Laser Science (CFEL), University of Hamburg, Hamburg 22607, Germany. 2Beiersdorf
AG, Hamburg 20245, Germany. *email: Frank.Fischer@Beiersdorf.com
Scientific Reports | (2021) 11:7565 | https://doi.org/10.1038/s41598-021-86907-7 1
Vol.:(0123456789)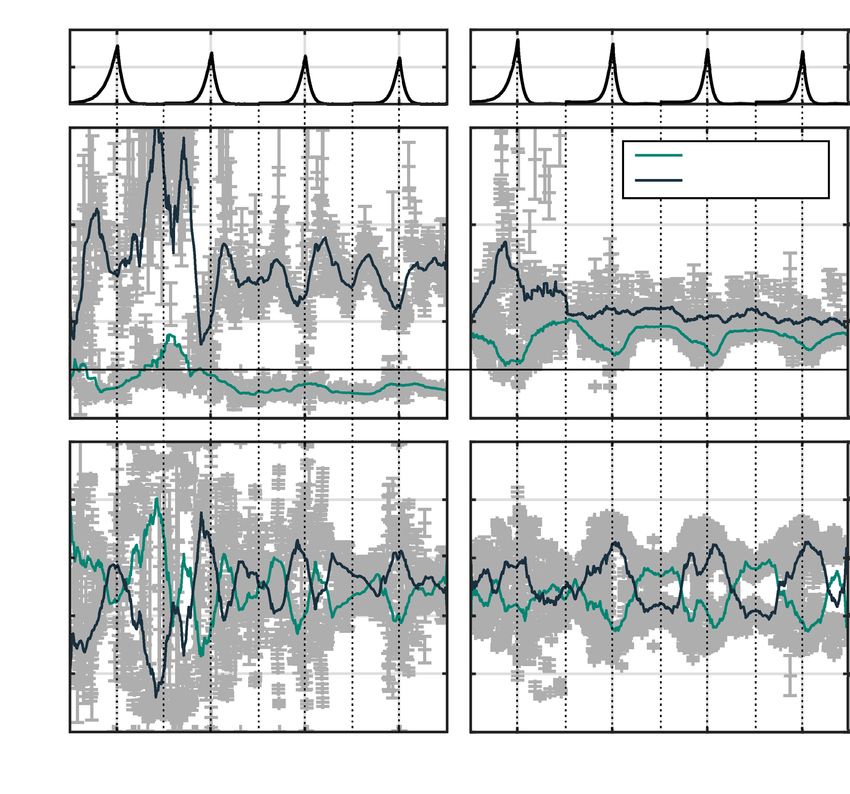
www.nature.com/scientificreports/
Figure 1. Experimental set-up and deformation protocol. (a) Schematic illustration of the multiphoton
microscope stretching device. (b) Deformation protocol consisting of four repeated cycles with successive
stretching and relaxation.
relaxation in cranial-caudal direction are applied to the skin. For our proof-of-principle study we use maximum
strains of 25 % as it appears to be the maximum strain in the human body, which was measured at the forearm1.
To ensure a reliable sequence of image acquisition and storage, images are recorded every 3 s with a mean scan
time of (2.63 ± 0.04) s. By using a rather low strain rate of 0.075 %/s, compared to other studies8,18, the variation
of strain during image acquisition is assumed to be negligible.
We use the FINE algorithm to obtain detailed, quantitative information about the collagen fiber network at
each state of the deformation protocol21.
The FINE algorithm determines the number of fiber families N and their angular properties in terms of their
mean orientations θ̄i, their amplitudes ai and their dispersion parameters bi. The dispersion parameter b describes
the spread of fiber angles around their main orientation and increases with fiber alignment. To measure the
overall alignment of the fiber network, we evaluate the alignment index (AI)21:
N
AI = ai · bi′ bi′ = (bi − bmin )/(bmax − bmin ), (1)
1
where bmin = 0.016 and bmax = 0.26 define the scale of the AI21. In addition, we make use of the orientation index
(OI) in order to quantify the fraction of fibers that is oriented along the force direction of 90◦:
180◦ 2 ◦
◦ I(θ) cos (θ − 90 )
OI = 2 θ =0 180◦ − 1, (2)
θ =0◦ I(θ)
where I(θ) denotes the angular orientation distribution, which is achieved by a Fourier-based m ethod20. Note
that the common definition of the OI uses the main orientation Ī(θ) of the fiber network23.
Two rectangular skin samples originating from the same dorsal pig skin are analyzed. Samples were chosen
such that they express a different unstressed orientation of their collagen fiber network as indicated by FINE
parameters. In the process, an isotropic and an anisotropic sample were identified. An isotropic fiber network
is indicated by low OI and AI values. This is the case for one of our samples having an OI of 0.05 and and AI of
0.18. That is the reason why we refer to this sample as isotropic sample. In contrast, the collagen fiber network
of the anisotropic sample expresses an OI and an AI of 0.31 and 0.32, respectively. For more information about
the FINE parameters and the detailed introduction of isotropic and anisotropic classes, we refer to our previous
work21. The original, anatomical location of both samples is illustrated in Supplementary Fig. 2.
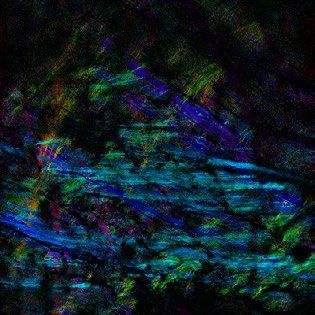
The collagen fiber network of the isotropic sample at minimum and maximum strain of the deformation
protocol (Fig. 2b) is shown in Fig. 2(a–i). The measured averaged force acting onto the sample is shown in Fig. 2j.
The corresponding figure for the anisotropic sample is shown in Supplementary Fig. 3. SHG images in Fig. 2a–i
are processed to visualize the local orientation of collagen fibers in false colors.
As shown in Fig. 2a, the orientation of the collagen fibers initially occupies the entire angular range from 0◦
to 180◦. At maximum stretch of the first cycle, the fibers in Fig. 2b orient along the direction of force (90◦) with a
variation of ±45◦. After complete relaxation of the sample, thick fiber bundles originally oriented along the 110◦
direction have disappeared (Fig. 2c). Compared to the initial state in Fig. 2a, the fraction of fibers that are aligned
along the force direction has strongly increased as visible by the enhanced amount of blue colors. At maximum
stretch of the second deformation cycle (Fig. 2d), the fraction of oriented fibers is further increased compared
to Fig. 2b. The fraction of oriented fibers further increases after the second deformation cycle in Fig. 2e, com-
pared to Fig. 2c. This trend continues after the third and the fourth deformation cycle in Fig. 2g,i, respectively.
Repeated stretching of the sample seems to have little effect on the local fiber orientation at maximum stretch,
as seen in Fig. 2f,h.
Collagen fiber network upon stretching. The OI and the AI of the isotropic sample are shown in Fig. 3a
as a function of the deformation cycle number. The measured force is displayed in Fig. 3b. Initially, the isotropic
sample is characterized by an OI of 0.05 and an AI of 0.16. This indicates an isotropic fiber network, where a neg-
Scientific Reports | (2021) 11:7565 | https://doi.org/10.1038/s41598-021-86907-7 2
Vol:.(1234567890)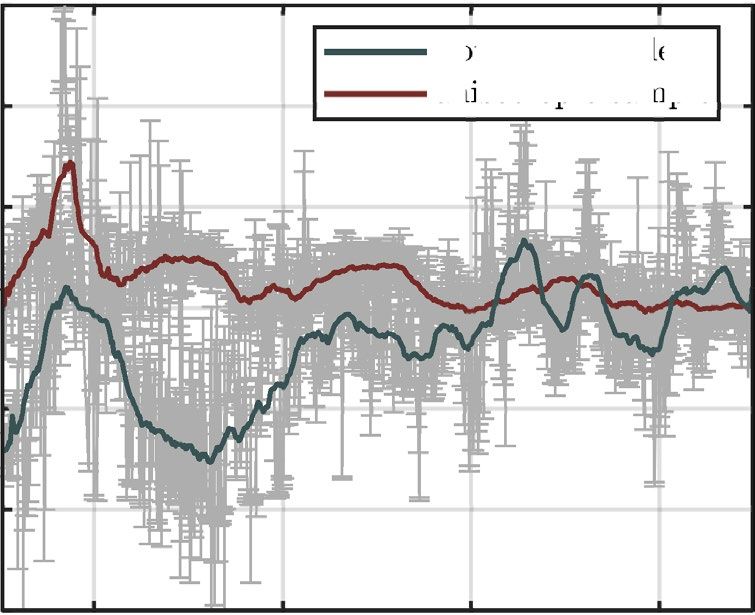
www.nature.com/scientificreports/
Figure 2. Evolution of the local collagen fiber orientation of the isotropic skin sample due to repeated
stretching and relaxation. Local fiber orientations are shown in false colors. Dashed lines indicate the minimum
and maximum strains of the corresponding stretching cycle. (a) Collagen fiber orientation prior to deformation.
The sample is stretched in the 90◦ direction as indicated by the arrow. (b) Local fiber orientation at maximum
stretch of the first deformation cycle. The corresponding local orientations at maximum stretch of the second,
third, and fourth deformation cycle are shown in (d), (f) and (h), respectively. (c) Local fiber orientation at
maximum relaxation of the first deformation cycle. Similarly, local orientations at minimum stretch of the
second, third, and fourth deformation cycle are shown in (e), (g) and (i), respectively. (j) Averaged force acting
on the sample, measured by the force sensors as a function of the deformation cycle.
ligible fraction of fibers is oriented along the direction of force. Upon stretching, both quantities increase until
the OI reaches a maximum value of 0.50 at maximum sample stretch. This agrees with the local fiber orientation
of Fig. 2b, where aligned fibers still express a considerable angular range. The AI reaches its highest value of 0.32
at 16 % of maximum stretch. Compared to their initial values, the OI and the AI are significantly increased after
relaxation as they amount to 0.31 and 0.15, respectively. This trend continues throughout the additional defor-
mation cycles until the OI and the AI fluctuate permanently around values of 0.48 and 0.30, respectively. This
is visually in line with the local collagen fiber orientation of Fig. 2e–i, which hardly differ from each other after
two deformation cycles. This suggests that collagen fibers of the isotropic sample are not relaxing to their initial
orientation during the experiment.
The OI and the AI of the anisotropic sample are shown in Fig. 3c as a function of the deformation number.
The corresponding measured force is displayed in Fig. 3d. The aligned network is characterized by an OI of 0.31
and an AI of 0.32 in the initial state. This OI additionally indicates that a non-vanishing fraction of fibers aligned
along the direction of force before the initial stretching cycle. Stretching the anisotropic sample increases the AI
to a local maximum of 0.44 at 18 % sample stretch. The OI first decreases, but then maximizes locally to 0.40 at
maximum stretch. Similar to the isotropic sample, the collagen fibers first align themselves and then orient into
the direction of stretch during the first deformation cycle. The observations of Bancelin et al., who measured a
simultaneous increase of the OI with sample stretch, are v erified6. The findings additionally suggest that repeated
stretching and relaxation decreases the ability of the collagen network to orient along the direction of force. This
is indicated by a continuously decreasing amplitude of the OI for both samples.
To analyze the micro-structural differences between both samples in detail, we track the amplitudes and dis-
persions of fiber families which are identified by the FINE algorithm. These are shown for both samples in Fig. 4.
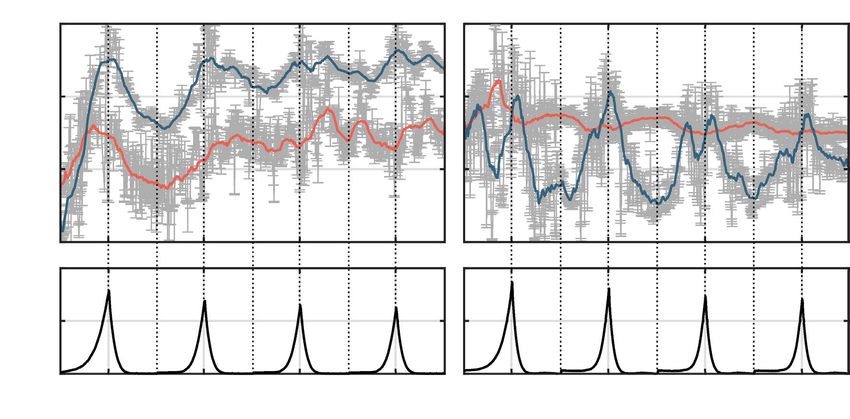
The measured force of the isotropic sample is shown in Fig. 4a. Amplitudes and dispersion parameters of
the identified fiber families are plotted in 4b,c, respectively. Throughout the entire deformation protocol, the
isotropic sample is characterized by two collagen fiber families. The dispersion parameter of fiber family 1 falls
below the threshold of an isotropic distribution except for a few data points located at maximum relaxation of
the first deformation cycle. Fiber family 2, however, strongly fluctuates within the domain of a high alignment
Scientific Reports | (2021) 11:7565 | https://doi.org/10.1038/s41598-021-86907-7 3
Vol.:(0123456789)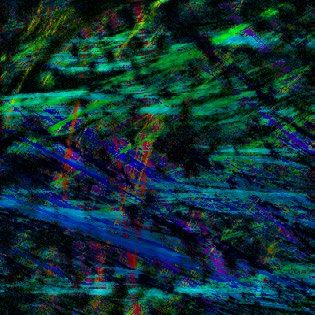
www.nature.com/scientificreports/
Figure 3. Derived parameters of the FINE algorithm applied to the collagen fiber network of the isotropic and
the anisotropic sample under repeated stretching and relaxation. (a) Orientation index (OI) and alignment
index (AI) of the collagen network of the isotropic sample as a function of the deformation cycle number. Data
points with error bars indicating the 95 % confidence intervals are shown in grey. Solid lines represent smoothed
data points. (b) Averaged force acting on the isotropic sample measured by the force sensors as a function of the
deformation cycle number. (c) OI and AI of the collagen network of the anisotropic sample as a function of the
deformation cycle number. (d) Averaged force acting on the anisotropic sample measured by the force sensors as
a function of the deformation cycle number.
up to dispersion parameter values of 0.3. In the initial, unstressed state, 70 % of the fibers are contained in the
isotropic fiber family 1.
The corresponding measured force of the anisotropic sample is shown in Fig. 4d. Amplitudes and dispersion
parameters of the identified fiber families are plotted in Fig. 4e,f, respectively. The collagen network of the aniso-
tropic sample is characterized by two aligned fiber families. In the initial state before the first stretching cycle both
fiber families have equal amplitudes and equal dispersion parameter values of 0.10 and 0.09. Upon stretching, we
find a similar behavior for both samples. Fibers migrate from fiber family 1 to fiber family 2 with an periodically
oscillating amplitude maximizing to ∼ 60 %. One fiber family is oriented along the force direction as indicated
by the OI of Fig. 3a,c increasing upon stretching. Furthermore, the dispersion parameter of fiber family 2 of the
isotropic sample increases continuously in the relaxed state being responsible for its permanently increased AI.
Morphological changes and mechanical behavior upon stretching. The relation between the AI
of both skin samples and their respective mechanical behaviors is shown in Fig. 5. The AI of both samples is
shown in Fig. 5a. As pointed out before, the AI of the anisotropic sample constantly fluctuates around a value of
0.3, while the collagen network of the isotropic sample approaches this value after two deformation cycles. As
shown in Fig. 5b and in Supplementary Fig. 4, the force at maximum stretches decreases for samples with each
deformation cycle, which is in line with stress strain curves measured in literature7,8,18. This altered mechanical
response of soft tissue due to repeated deformation cycles is referred to as preconditioning effect24. In capsular
ligaments Quinn et al.25 correlated this effect with a permanent alignment of collagen fibers along the direction
of force. Here, we note that for both samples, the degree of maximum orientation of the collagen network is only
determined by the maximum stretch, since the maximum of the OI of the first deformation cycle is not exceeded
by performing additional deformation cycles. A permanent increase of the OI and the AI of collagen fibers in
the relaxed state can be observed in case of the isotropic sample. The alignment of the collagen networks of both
samples becomes identical after two deformation cycles. This is microscopically reflected by the relative change
of the maximum force between each deformation cycle, shown in Fig. 5c. The large relative difference of −12 %
between maximum forces of the first two cycles of the isotropic sample correlates with the permanent alignment
of fibers. Once fibers align to an AI of 0.3, the relative difference of maximum forces between consecutive defor-
mation cycles becomes identical for both samples.
In this proof-of-principle study we introduced an approach to perform mechanical deformations of biologi-
cal samples while analyzing its collagen microstructure using SHG imaging and the FINE algorithm. The initial
results suggest that repeated stretching and relaxation of skin is found to decrease the ability of the collagen fiber
network to align in the direction of force indicating a plastic material behavior. Plasticity might be induced by
repeatedly stretching the skin above its physiological limit in the dorsal region affecting collagen cross-links.
Collagen cross-links are reported to determine the strength of the collagen fiber network at quasi-static strain
rates26. Nevertheless, in order to prove the biological findings of this proof-of-principle study, further samples
need to be analyzed. Additional information on the mechanical behavior of dorsal pig skin can be found in the
Scientific Reports | (2021) 11:7565 | https://doi.org/10.1038/s41598-021-86907-7 4
Vol:.(1234567890)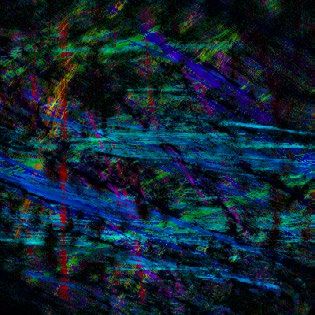
www.nature.com/scientificreports/
Figure 4. FINE algorithm parameters of the collagen fiber families of the isotropic and the anisotropic sample
under repeated stretching and relaxation. (a) Averaged force acting on the isotropic sample, measured by the
force sensors as a function of the deformation cycle number. (b) Dispersion parameter b of each fiber family
identified by the FINE algorithm in the isotropic sample as a function of the deformation cycle number. Data
points with error bars indicating the 95 % confidence intervals are shown in grey. Solid lines represent smoothed
data points. Note that, a third fiber family is identified in a negligible fraction of images (≤ 1 %). For the sake
of clarity, parameters of this fiber family are not shown. The line at b = 0.05 indicates the threshold value
below which a fiber family is considered as isotropic. (c) Amplitude of each fiber family identified by the FINE
algorithm in the isotropic sample as a function of the deformation cycle number. (d) Averaged force acting
on the anisotropic sample, measured by the force sensors as a function of the deformation cycle number. (e)
Dispersion parameter b of each fiber family identified by the FINE algorithm in the anisotropic sample as a
function of the deformation cycle number. (f) Amplitude of each fiber family identified by the FINE algorithm
in the anisotropic sample as a function of the deformation cycle number.
l iterature27,28. It should be noted that different liquids, namely water, saline or phosphate-buffered saline solutions
(PBS) are used for moisturizing biological samples during mechanical d eformation8,27,29.
This setup aims to study skin deformation using quasi-static strain rates in order to catch slow effects such
as aging, long-term loads. At higher strain rates skin exhibits a stiff material r esponse18,30. This is related to
additional effects like the interaction of collagen fibers with the ground substance as well as the relative sliding
of collagen fibers against each o ther9,26. Please note that the bio-mechanical findings of this work are found in
response to supra-physiological strains. Future experiments using a maximum strain within the physiological
range of dorsal skin will clarify if these findings are maintained in an in-vivo scenario.
In conclusion, we are able to resolve different micro-structural variations of the collagen fiber network of
skin, that are related to the interplay of its fiber families. Permanent as well as periodic processes of the collagen
fiber network due to cyclic deformations are identified. Furthermore, differences across the samples in terms of
their mechanical response are successfully correlated with their individual collagen fiber networks and thus to
skin morphologies. Our proof-of-principle study opens a new avenue to investigate biological fiber-reinforced
tissue upon mechanical strain. The FINE algorithm in combination with the multiphoton stretching device
represents a sophisticated method to relate micro-structural properties to the macroscopic mechanical behavior.
Scientific Reports | (2021) 11:7565 | https://doi.org/10.1038/s41598-021-86907-7 5
Vol.:(0123456789)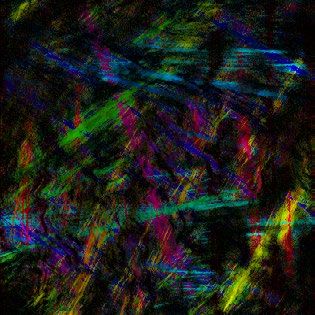
www.nature.com/scientificreports/

                                            Figure 5.  Relation between measured force and orientation of the collagen fiber network. (a) Alignment
                                            index of the isotropic sample and the anisotropic sample as a function of the deformation cycle number. (b)
                                            Relative maximum force applied to the isotropic and the anisotropic sample as a function of the deformation
                                            cycle number. (c) Relative difference of the maximum force of each deformation cycle of the isotropic and the
                                            anisotropic sample.

                                            Methods
                                            Sample preparation. A back skin of a ∼ 90 days-old female pig (Viktoria breed) was acquired from a local,
                                            commercial butcher. Rectangular skin samples were punched with an orientation parallel to the spine and stored
                                            in the freezer at −24◦ until usage. The location of the samples is illustrated in Supplementary Fig. 2. Directly
                                            before the experiment, the subcutaneous fat was cautiously removed using a surgical blade. The skin samples
                                            were still frozen to avoid any pre-stress of the collagen fibers. Additionally, samples were cut to dimensions of
                                            (80 × 6) mm2. The thickness of the samples was (3.0 ± 0.5) mm. Thawed samples were placed between the two
                                            clamps with the dermis pointing towards the multiphoton microscope to image deep dermal layers. Constant
                                            hydration of the skin during the experiment was ensured by constantly moistening the samples with room tem-
                                            perature water.

                                            Multiphoton microscope stretching device. Multiphoton microscopy. For second harmonic genera-
                                            tion (SHG) measurements we used a multiphoton microscope (DermaInspect) which was developed in col-
                                            laboration with Jenlab GmbH (Jena, Germany)31. To measure the collagen-specific second-harmonic generation
                                            (SHG) signal, a femtosecond titanium:sapphire laser (Mai Tai, Spectra-Physics, California, USA) at a wave-
                                            length of 820 nm was used together with a (410 ± 10) nm band-pass filter (AQ 410/20m-2P, Chroma Technol-
                                            ogy Corp., Bellows Falls, VT). A water-immersion objective with a 20x magnification (XLUMPlanFl 20x/0.95,
                                            Olympus) captured a (440 × 440) µm field of view with a resolution of (512 × 512) pixels. Images were cropped
                                            by 100 pixels since the left border was found to suffer from motion artefacts induced by the scanning mirrors of
                                            the microscope.

                                            Stretching device. As shown in Fig. 1a, samples were clamped into a custom made traction device, which
                                            consists of two opposing linear guide units (RK Compact 30, RK Rose+Krieger GmbH, Minden, Germany)
                                            with equipped stepper motors and 45 N load cells (SML-45, Interfaceforce e.K., Germany). The stepper motors
                                            (ST4209S1006-B, Nanotec Electronic GmbH & Co. KG, Feldkirchen, Germany) with encoder (WEDS5541-A14,
                                            Nanotec Electronic GmbH & Co. KG, Feldkirchen, Germany) allow for a minimum step size of 1 µm. The whole
                                            set-up was mounted onto a lifting stage to allow for a precise placement under the object lens of the microscope.
                                            To minimize displacements of the imaging plane, the skin samples were constrained in both directions along
                                            the optical axis. The minimum distance to the objective was ensured by a 3D-printed cylindrical spacer (Form
                                            2, standard black resin, Formlabs, Somerville, USA) that was mounted to the microscope. The spacer further
                                            guaranteed a constant immersion of the objective, since a certain level of water between objective, spacer and the
                                            sample was kept. To avoid a potential sagging of the sample, a 3D-printed supporter was attached to the mount-
                                            ing plate underneath the sample. The stretching device was checked for sample slippage in preliminary tests.

                                            Tensile tests with simultaneous imaging. We performed tensile, strain-controlled, mechanical tests in cranial-
                                            caudal direction with four consecutive cycles of repeated stretch and relaxation. For a simultaneous deformation
                                            and imaging of the sample, tensile tests were performed at low strain rate of 0.075 %/s. Images were recorded with

          Scientific Reports |   (2021) 11:7565 |                https://doi.org/10.1038/s41598-021-86907-7                                                 6

Vol:.(1234567890)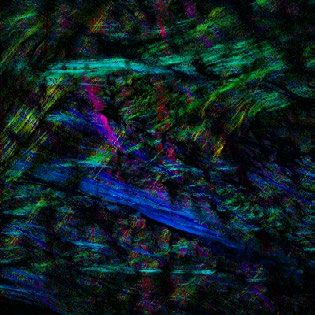
www.nature.com/scientificreports/
a mean scan-time of (2.63 ± 0.06) s every 3 s to ensure reliable sequences of consecutive image acquisition and
data storage. Prior to deformation, samples were slightly pre-stretched to a force of 0.2 N to ensure a uniform
starting point. Although stretching and relaxation was performed in opposing directions along the specimen’s
long axis, a shift of the field of view in the tensile direction could ultimately not be prevented. We took advantage
of the piezo element to adjust residual displacements in the direction of the optical axis. Distorted images were
omitted from quantitative analysis. However, a sufficient number of images was captured at every point of the
deformation curve ensuring a continuous tracking of the dermal collagen fiber network throughout the entire
measurement.
Image processing. Angular orientation distribution. We used a Fourier-based method20 to obtain the an-
gular orientation distribution I(θ) of the unprocessed SHG images. Fourier-based methods make use of the
power spectrum, defined as the absolute square of the Fourier transform of the image, to calculate I(θ) by means
of a radial sum. Within the method, Poissonian photonic noise of the measured SHG image is assumed20. Meas-
urement uncertainties are then propagated to the Fourier domain. These uncertainties are used to define a filter
by means of a relative error constrain on the power spectrum. In addition, the uncertainty of the angular orien-
tation spectrum, �I(θ) is achieved. I(θ) is used for the computation of the orientation index (OI) (equation 2).
Since the FINE algorithm21 is based on the cumulative orientation distribution C(θ) and its uncertainty, �C(θ),
both quantities were calculated and passed to the algorithm.
FINE algorithm. The FINE algorithm21 determines the number of fiber families N, their mean orientations θi ,
amplitudes ai and dispersion parameters bi . The dispersion parameter b quantifies the spread of angles around
their mean orientation. It can be understood as reciprocal standard deviation, meaning that a large value of b
indicates a small spread of angles, i.e. an aligned fiber family, and vice versa. Within the FINE algorithm, a single
fiber family is modeled with a sigmoid function that respects the semi-circularity of the angular orientation
distribution. Fiber families are iteratively added until the deviation between cumulative orientation distribution,
C(θ), and the fitted model is smaller than 3σ = 3�C(θ)21.
Local fiber orientation. The local fiber orientation was calculated as described p reviously21. First, the local
angular orientation spectra of an image Ip (x, y) were calculated, denoted as Ip (x, y, θ ). Local orientation spec-
tra were achieved from applying the inverse Fourier transformation to the wedge-filtered Fourier transform of
the image. The main local orientation in each pixel indicates the angle at which the local orientation spectrum
reaches its maximum intensity. The color-coded local main orientation was scaled by the relative intensity of
each pixel. To enhance the contrast of fibers, the background signal was removed from the image by using the
function Subtract Background of the open-source platform Fiji32 with a rolling ball radius of 50 pixels.
Received: 13 July 2020; Accepted: 17 February 2021
References
1. Maiti, R. et al. In vivo measurement of skin surface strain and sub-surface layer deformation induced by natural tissue stretching.
J. Mech. Behav. Biomed. Mater. 62, 556–569. https://doi.org/10.1016/j.jmbbm.2016.05.035 (2016).
2. Diridollou, S. et al. Skin ageing: Changes of physical properties of human skin in vivo. Int. J. Cosm. Sci.https://doi.org/10.1046/j.
0412-5463.2001.00105.x (2001).
3. Clark, J. A., Cheng, J. C. & Leung, K. S. Mechanical properties of normal skin and hypertrophic scars. Burnshttps://doi.org/10.
1016/0305-4179(96)00038-1 (1996).
4. Malfait, F. et al. The 2017 international classification of the Ehlers-Danlos syndromes. Am. J. Med. Genet. C 175, 8–26. https://doi.
org/10.1002/ajmg.c.31552 (2017).
5. Ní Annaidh, A., Bruyère, K., Destrade, M., Gilchrist, M. D. & Otténio, M. Characterization of the anisotropic mechanical proper-
ties of excised human skin. J. Mech. Behav. Biomed. Mater. 5, 139–148, https://doi.org/10.1016/j.jmbbm.2011.08.016 (2012).
6. Bancelin, S. et al. Ex vivo multiscale quantitation of skin biomechanics in wild-type and genetically-modified mice using mul-
tiphoton microscopy. Sci. Rep. 5, 1–14. https://doi.org/10.1038/srep17635 (2015).
7. Lynch, B. et al. A novel microstructural interpretation for the biomechanics of mouse skin derived from multiscale characteriza-
tion. Acta Biomater. 50, 302–311. https://doi.org/10.1016/j.actbio.2016.12.051 (2017).
8. Pissarenko, A. et al. Tensile behavior and structural characterization of pig dermis. Acta Biomater. 86, 77–95. https://doi.org/10.
1016/j.actbio.2019.01.023 (2019).
9. Yang, W. et al. On the tear resistance of skin. Nat. Commun. 6, 6649. https://doi.org/10.1038/ncomms7649 (2015).
10. Nesbitt, S., Scott, W., Macione, J. & Kotha, S. collagen fibrils in skin orient in the direction of applied uniaxial load in proportion
to stress while exhibiting differential strains around hair follicles. Materials 8, 1841–1857. https://doi.org/10.3390/ma8041841
(2015).
11. Ridge, M. D. & Wright, V. The directional effects of skin. A bio-engineering study of skin with particular reference to Langer’s
lines. J. Investig. Dermatol. 46, 341–346. https://doi.org/10.1038/jid.1966.54 (1966).
12. Annaidh, A. N. et al. Automated estimation of collagen fibre dispersion in the dermis and its contribution to the anisotropic
behaviour of skin. Ann. Biomed. Eng. 40, 1666–1678, https://doi.org/10.1007/s10439-012-0542-3 (2012).
13. Arumugam, V., Naresh, M. D. & Sanjeevi, R. Effect of strain rate on the fracture behaviour of skin. J. Biosci.https://d oi.org/1 0.1 007/
BF02716820 (1994).
14. Purslow, P. P., Wess, T. J. & Hukins, D. W. Collagen orientation and molecular spacing during creep and stress-relaxation in soft
connective tissues. J. Exp. Biol. 201, 135–142 (1998).
15. Crichton, M. L. et al. The viscoelastic, hyperelastic and scale dependent behaviour of freshly excised individual skin layers. Bio-
materials 32, 4670–4681. https://doi.org/10.1016/j.biomaterials.2011.03.012 (2011).
Scientific Reports | (2021) 11:7565 | https://doi.org/10.1038/s41598-021-86907-7 7
Vol.:(0123456789)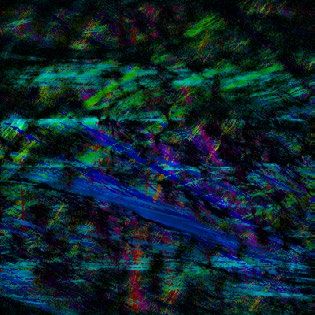
www.nature.com/scientificreports/
16. Wong, W. L., Joyce, T. J. & Goh, K. L. Resolving the viscoelasticity and anisotropy dependence of the mechanical properties of skin
from a porcine model. Biomech. Model. Mechanobiol. 15, 433–446. https://doi.org/10.1007/s10237-015-0700-2 (2016).
17. Oftadeh, R., Connizzo, B. K., Nia, H. T., Ortiz, C. & Grodzinsky, A. J. Biological connective tissues exhibit viscoelastic and poroe-
lastic behavior at different frequency regimes: Application to tendon and skin biophysics. Acta Biomater. 70, 249–259. https://doi.
org/10.1016/j.actbio.2018.01.041 (2018).
18. Remache, D., Caliez, M., Gratton, M. & Dos Santos, S. The effects of cyclic tensile and stress-relaxation tests on porcine skin. J.
Mech. Behav. Biomed. Mater. 77, 242–249. https://doi.org/10.1016/j.jmbbm.2017.09.009 (2018).
19. Zipfel, W. R. et al. Live tissue intrinsic emission microscopy using multiphoton-excited native fluorescence and second harmonic
generation. Proce. Natl. Acad. Sci. USA 100, 7075–7080. https://doi.org/10.1073/pnas.0832308100 (2003).
20. Witte, M., Jaspers, S., Wenck, H., Rübhausen, M. & Fischer, F. Noise reduction and quantification of fiber orientations in greyscale
images. PLoS ONE 1–21, https://doi.org/10.1371/journal.pone.0227534 (2020).
21. Witte, M., Jaspers, S., Wenck, H., Rübhausen, M. & Fischer, F. General method for classification of fiber families in fiber-reinforced
materials: application to in - vivo human skin images. Sci. Rep. 1–11, https://doi.org/10.1038/s41598-020-67632-z (2020).
22. Glier, T. E. et al. Electrical and network properties of flexible silver-nanowire composite electrodes under mechanical strain.
Nanoscale 12, 23831–23837. https://doi.org/10.1039/D0NR05734G (2020).
23. Bayan, C., Levitt, J. M., Miller, E., Kaplan, D. & Georgakoudi, I. Fully automated, quantitative, noninvasive assessment of collagen
fiber content and organization in thick collagen gels. J. Appl. Phys. 105, 1–11. https://doi.org/10.1063/1.3116626 (2009).
24. Fung, Y. C. & Skalak, R. Biomechanics: Mechanical properties of living tissues. J. Biomech. Eng. 10(1115/1), 3138285 (1981).
25. Quinn, K. P. & Winkelstein, B. A. Preconditioning is correlated with altered collagen fiber alignment in ligament. J. Biomech. Eng.
133, 064506. https://doi.org/10.1115/1.4004205 (2011).
26. Ottenio, M., Tran, D., Ní Annaidh, A., Gilchrist, M. D. & Bruyère, K. Strain rate and anisotropy effects on the tensile failure char-
acteristics of human skin. J. Mech. Behav. Biomed. Mater. 41, 241–250. https://doi.org/10.1016/j.jmbbm.2014.10.006 (2015).
27. Corr, D. T., Gallant-Behm, C. L., Shrive, N. G. & Hart, D. A. Biomechanical behavior of scar tissue and uninjured skin in a porcine
model. Wound Repair Regener. 17, 250–259. https://doi.org/10.1111/j.1524-475X.2009.00463.x (2009).
28. Corr, D. T. & Hart, D. A. Biomechanics of scar tissue and uninjured skin. Adv. Wound Care 2, 37–43. https://doi.org/10.1089/
wound.2011.0321 (2013).
29. Groves, R. B., Coulman, S. A., Birchall, J. C. & Evans, S. L. An anisotropic, hyperelastic model for skin: Experimental measure-
ments, finite element modelling and identification of parameters for human and murine skin. J. Mech. Behav. Biomed. Mater. 18,
167–180. https://doi.org/10.1016/j.jmbbm.2012.10.021 (2013).
30. Lim, J., Hong, J., Chen, W. W. & Weerasooriya, T. Mechanical response of pig skin under dynamic tensile loading. Int. J. Impact
Eng. 38, 130–135. https://doi.org/10.1016/j.ijimpeng.2010.09.003 (2011).
31. Bückle, R. et al. 5D-intravital tomography as a novel tool for non-invasive in-vivo analysis of human skin. Adv. Biomed. Clin.
Diagn. Syst. VIIIhttps://doi.org/10.1117/12.841861 (2010).
32. Schindelin, J. et al. Fiji: An open-source platform for biological-image analysis. https://doi.org/10.1038/nmeth.2019 (2012).
Acknowledgements
We acknowledge financial support from Beiersdorf AG.
Author contributions
M.W., F.F. and M.R. conceived the experiment. M.W. established the setup, wrote the software, and conducted
the experiments. M.W., F.F. and M.R. analyzed the results. M.W., F.F. and M.R. wrote the manuscript. S.J. and
H.W. reviewed the manuscript.
Competing interests
The authors declare no competing interests.
Additional information
Supplementary Information The online version contains supplementary material available at https://doi.org/
10.1038/s41598-021-86907-7.
Correspondence and requests for materials should be addressed to F.F.
Reprints and permissions information is available at www.nature.com/reprints.
Publisher’s note Springer Nature remains neutral with regard to jurisdictional claims in published maps and
institutional affiliations.
Open Access This article is licensed under a Creative Commons Attribution 4.0 International
License, which permits use, sharing, adaptation, distribution and reproduction in any medium or
format, as long as you give appropriate credit to the original author(s) and the source, provide a link to the
Creative Commons licence, and indicate if changes were made. The images or other third party material in this
article are included in the article’s Creative Commons licence, unless indicated otherwise in a credit line to the
material. If material is not included in the article’s Creative Commons licence and your intended use is not
permitted by statutory regulation or exceeds the permitted use, you will need to obtain permission directly from
the copyright holder. To view a copy of this licence, visit http://creativecommons.org/licenses/by/4.0/.
© The Author(s) 2021
Scientific Reports | (2021) 11:7565 | https://doi.org/10.1038/s41598-021-86907-7 8
Vol:.(1234567890)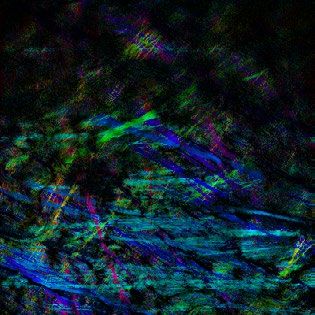
You can also read