Adaptive dynamic range shift (ADRIFT) quantitative phase imaging - Nature
←
→
Page content transcription
If your browser does not render page correctly, please read the page content below
Toda et al. Light: Science & Applications (2021)10:1                                                                                        Official journal of the CIOMP 2047-7538
                                    https://doi.org/10.1038/s41377-020-00435-z                                                                                                                       www.nature.com/lsa

                                     ARTICLE                                                                                                                                                    Open Access

                                    Adaptive dynamic range shift (ADRIFT) quantitative
                                    phase imaging
                                    Keiichiro Toda1, Miu Tamamitsu1 and Takuro Ideguchi                                           1,2,3

                                      Abstract
                                      Quantitative phase imaging (QPI) with its high-contrast images of optical phase delay (OPD) maps is often used for
                                      label-free single-cell analysis. Contrary to other imaging methods, sensitivity improvement has not been intensively
                                      explored because conventional QPI is sensitive enough to observe the surface roughness of a substrate that restricts
                                      the minimum measurable OPD. However, emerging QPI techniques that utilize, for example, differential image analysis
                                      of consecutive temporal frames, such as mid-infrared photothermal QPI, mitigate the minimum OPD limit by
                                      decoupling the static OPD contribution and allow measurement of much smaller OPDs. Here, we propose and
                                      demonstrate supersensitive QPI with an expanded dynamic range. It is enabled by adaptive dynamic range shift
                                      through a combination of wavefront shaping and dark-field QPI techniques. As a proof-of-concept demonstration, we
                                      show dynamic range expansion (sensitivity improvement) of QPI by a factor of 6.6 and its utility in improving the
                                      sensitivity of mid-infrared photothermal QPI. This technique can also be applied for wide-field scattering imaging of
                                      dynamically changing nanoscale objects inside and outside a biological cell without losing global cellular
                                      morphological image information.
                  1234567890():,;
1234567890():,;
                  1234567890():,;
1234567890():,;

                                    Introduction                                                                                          single-cell analysis. Since the minimum detectable OPD of
                                      Phase imaging1–19 provides morphological phase-                                                     conventional QPI (~10 mrad) is already small enough to
                                    contrast of transparent samples and is widely used in                                                 clearly observe the surface roughness of a glass slide that
                                    various fields, especially in biological science, because                                              limits the detectable sample-induced OPD, sensitivity
                                    morphological features of micrometre-scale specimens                                                  improvement of QPI, especially of the temporal OPD
                                    provide valuable information on complex biological phe-                                               sensitivity, has not been intensively explored. However,
                                    nomena. Quantitative phase imaging (QPI)1–6 is the most                                               recent developments in pump-probe-type perturbative
                                    powerful method for studying cellular morphology among                                                QPI techniques, such as mid-infrared (MIR) photo-
                                    various phase imaging methods, such as phase-contrast7                                                thermal QPI10–13, have shown that temporal differential
                                    and differential-interference-contrast8 imaging, because it                                           analysis of consecutively measured images can cancel out
                                    is able to accurately measure the optical phase delay                                                 the substrate background and reveal small OPD changes.
                                    (OPD) caused by a sample. This quantitative nature                                                    Thus, sensitivity improvement of QPI is highly demanded
                                    enables, for example, cellular dry mass and growth rate                                               in this context. In addition, wide-field scattering imaging
                                    analyses9, which have been recognized as new tools for                                                techniques using dark-field (DF)14,15 or interferometric
                                                                                                                                          scattering (iSCAT)16,17 have also used the concept of
                                                                                                                                          differential image analysis to observe dynamically
                                                                                                                                          changing small signals originating from fast-moving
                                                                                                                                          nanoscale scattering objects in a slowly moving micro-
                                    Correspondence: Takuro Ideguchi (ideguchi@ipst.s.u-tokyo.ac.jp)
                                    1
                                                                                                                                          scale environment. They have been mostly used for
                                     Department of Physics, The University of Tokyo, Tokyo 113-0033, Japan
                                    2                                                                                                     investigating simple biomimicking systems16,17 and, more
                                     Institute for Photon Science and Technology, The University of Tokyo,
                                    Tokyo 113-0033, Japan                                                                                 recently, applied to measure gold nanoparticles on cell
                                    Full list of author information is available at the end of the article

                                    © The Author(s) 2021
                                                        Open Access This article is licensed under a Creative Commons Attribution 4.0 International License, which permits use, sharing, adaptation, distribution and reproduction
                                                        in any medium or format, as long as you give appropriate credit to the original author(s) and the source, provide a link to the Creative Commons license, and indicate if
                                    changes were made. The images or other third party material in this article are included in the article’s Creative Commons license, unless indicated otherwise in a credit line to the material. If
                                    material is not included in the article’s Creative Commons license and your intended use is not permitted by statutory regulation or exceeds the permitted use, you will need to obtain
                                    permission directly from the copyright holder. To view a copy of this license, visit http://creativecommons.org/licenses/by/4.0/.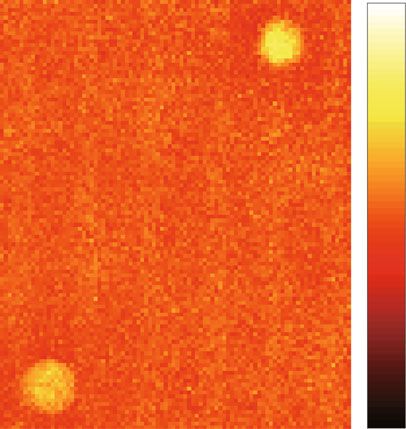
Toda et al. Light: Science & Applications (2021)10:1                                                                                                                    Page 2 of 10

membranes18,19. However, the limited dynamic range of                                                temporal sensitivity of the system6 (Fig. 1a). The sensi-
DF imaging causes decreased sensitivity in the presence of                                           tivity can be improved by increasing the photon flux of
large-OPD objects (>1 rad) such as cells. On the other                                               the scattered light reaching the image sensor because
hand, iSCAT is not a technique for quantitatively and                                                this light contains morphological information of the
comprehensively measuring a complex structure of spe-                                                sample. This is realized by dark-field (DF) imaging14,15,
cimens because it is only sensitive to the medium                                                    where the undesired strong unscattered light is rejected
boundaries. These features prevent simultaneous quanti-                                              with a spatial filter in the Fourier plane. Its dynamic
tative detection of the global cellular structure and small                                          range can be shifted to the smaller-OPD regime by
scattering signals. To measure the dynamic motion of                                                 increasing the illumination light to the level where the
small particles, such as exosomes, liposomes and viruses,                                            brightest spot caused by the largest OPD in the field of
inside and outside a living cell, we need to detect small                                            view (FOV) nearly saturates the image sensor. However,
signals on top of the large background from the cell with a                                          the sensitivity improvement cannot be significant when
high measurement dynamic range in the manner of QPI.                                                 the sample has a global structure that causes a large
  Conventional QPI techniques, however, are not made                                                 OPD (~1 rad) because the dynamic range is “pinned” to
to detect small OPDs because the image sensor is                                                     this value (Fig. 1a). Therefore, the DF imaging technique
dominantly exposed to strong unscattered light (also                                                 is also not applicable to observing small OPD changes
known as zeroth-order diffracted light), which brings                                                embedded in microscale large-OPD structures. For
no information about the sample morphology, and the                                                  example, single-cell imaging falls into this situation in
shot noise determines the dynamic range of the mea-                                                  any case. To date, all existing phase imaging techniques,
surement. With a commonly used image sensor, the                                                     not only DF imaging, fail to simultaneously measure
measurable OPD range is from ~10 mrad to ~1 rad in                                                   subtle OPD changes and large OPDs because the
shot-noise-dominant imaging conditions, limiting the                                                 dynamic range is pinned to the larger side. To address

         a                                                                       b                       QPI              PC-DF-QPI              PC-DF-QPI
                                                                                                                                               with strong light
                                     QPI            DF   ADRIFT-QPI
                                                                                         1st measurement                                       2nd measurement
                           1                                          Maximum
                                                            1st        OPD                       x
         OPD (rad)

                                                           meas.
                       0.1                                                        z
                                                                      Maximum
                                                                        OPD
                                                                      after PC                                                 SLM                     SLM
                      0.01
                                                            2nd
                                                           meas.                                         Lens                  Lens                    Lens
                     0.001

                                                                                                                                 DF mask                  DF mask
         c                     Variable ND filter                                                        Sensor                Sensor               Sensor
                                                             BS
                                                                                             1                        1
            Light                                                     SLM                            B                                             A-B’
                                                                                                                                                                    Maximum
                                                                                 OPD (rad)

           source                                                                                                                           0.1
                                                                                                                                                                      OPD
                                   BS Sample                                                                                                                        after PC
                                                                                             0                        0                    –0.1
                                        With mask: DF-DH
                                                                   DF mask                               x position
                                        Without mask: DH
                                                                                                                      1                        1
                                                                                                                          B’
                                                                                                                          B’                       A
                x
                       z                                               Image                                                               +
                                                                       sensor
                                                             BS                                                       0                        0
                                                                                                                           SLM input

 Fig. 1 Principle of ADRIFT-QPI. a Dynamic range of phase imaging: (left) conventional QPI, (centre) dark-field imaging, (right) ADRIFT-QPI. We
 assume a standard CMOS image sensor where a full well capacity of ~10,000 e−/pixel is used. b Principle of dynamic range expansion in ADRIFT-QPI.
 The left column shows the first measurement, where the large-OPD distribution of the sample (B) is measured by QPI with plane wave illumination.
 The centre column shows the situation of PC-DF-QPI where the DF mask blocks the unscattered light by phase cancellation with the SLM. The right
 column shows the second measurement, which is PC-DF-QPI with strong light illumination, allowing for dynamic-range-shifted highly sensitive
 measurement. The dynamic-range-expanded OPD distribution of the sample (A) can be computationally reconstructed by adding the PC-DF-QPI
 measurement result (A–B′) to the SLM input OPD map (B′). c Optical implementation of ADRIFT-QPI. In this work, off-axis DH is used as a QPI
 technique. DH and DF-DH are switchable in a single setup by insertion/removal of the DF mask. The phase-only SLM is placed in the sample
 conjugate plane for wavefront shaping, while the DF mask is placed in the Fourier plane for spatially filtering the unscattered light. The illumination
 light intensity on the sample can be changed with a neutral density (ND) filter placed in front of the sample. BS: beamsplitter
Toda et al. Light: Science & Applications (2021)10:1                                                         Page 3 of 10

this challenge, it is necessary to expand the dynamic        Optical layout of ADRIFT-DH
range of the OPD measurement.                                  The optical implementation of the system is presented
  Here, we propose and demonstrate a method to expand        in Fig. 1c. In this work, we implement off-axis digital
the dynamic range of phase imaging, which we call            holography (DH) as a QPI technique (therefore, we
adaptive dynamic range shift quantitative phase imaging      replace -QPI by -DH below). Other QPI techniques can
(ADRIFT-QPI). It works by separately measuring the           also be applied to this concept in general2,4. DH and DF-
large- and small-OPD distributions of a sample and           DH are switchable in a single setup by insertion/removal
seamlessly connecting them (Fig. 1a). In addition to         of a DF mask placed in the Fourier plane. A phase-only
measuring large OPDs with the conventional QPI, we           SLM is put in the sample conjugate plane for phase
measure small OPDs with a new technique called phase-        cancellation23. When measuring a sample whose large-
cancelling dark-field quantitative phase imaging (PC-DF-      OPD structure does not move during the measurement,
QPI), which is enabled by a wavefront shaping technique      the SLM input OPD does not need to be refreshed for
in the dark-field QPI (DF-QPI) configuration. Our proof-       every measurement, meaning that there is no need to
of-concept experiments demonstrate dynamic range             switch the system between DH and DF-DH. Off-axis
expansion (sensitivity improvement) of QPI measurement       reference light is illuminated on the image sensor so that
by a factor of 6.6, which corresponds to a 44 times speed    the complex field can be measured. The reference light
improvement, and show significant sensitivity improve-        also works as a local oscillator for heterodyne detection to
ment of MIR photothermal QPI. The concept of this            amplify the signal and guarantee shot-noise-limited
technique promises remarkable advancement of label-free      measurements, which is especially important in PC-DF-
imaging with its high sensitivity.                           DH measurements where the object light is significantly
                                                             reduced. Note that, to the best of our knowledge, this
Results                                                      work is the first demonstration of QPI in the DF config-
Principle of ADRIFT-QPI                                      uration (DF-QPI). The specifications of the optical system
   The working principle of the dynamic range expansion      are given in the Materials and methods and Supplemen-
is illustrated in Fig. 1b. In the first measurement, the      tary Information 1.
large-OPD distribution is measured by conventional
QPI with plane wave illumination. Then, the large-OPD        OPD sensitivity of ADRIFT-DH
distribution is optically cancelled by wavefront shaping        We theoretically discuss the temporal OPD sensitivity
with a phase-only spatial light modulator (SLM)20–22         of PC-DF-DH, which determines that of ADRIFT-DH.
such that the light reverts to a quasi-plane wave that can   For simplicity, we assume a case where a transparent
be focused around a single spot in the Fourier plane         sample is illuminated by a plane wave with uniform
where a single dot spatial mask (DF mask) selectively        amplitude distribution U0. The complex amplitude of the
rejects the focused light. The DF spatial mask allows        light from the sample arm in the DH configuration at the
only a small amount of light, which deviates from the        image sensor can be written as U0 eiθmn , where θmn denotes
plane wave, to reach the image sensor so that the illu-      the OPD map introduced by the sample (m and n are
mination photon flux on the sample can be increased           indices of the image sensor pixels along the x and y
without saturating the sensor. Thus, in the second           directions, respectively). The intensity at the image sensor
measurement performed by PC-DF-QPI with stronger             in DF imaging with a DC-cut spatial mask placed in the
                                                             Fourier plane can be approximated as jU0 ðeiθmn  1Þj2
                                                                                                                 PC
illumination light, the dynamic range of the measure-
ment is shifted to the smaller-OPD regime. The sensi-        when the amount of unscattered light does not largely
tivity of PC-DF-QPI determines that of ADRIFT-QPI.           change with and without the sample. If the maximum
Note that to maintain the phase quantitativeness, we         OPD in the FOV after phase cancellation is sufficiently
implement a technique to perform QPI in the DF con-
                                                                      max ≪ 1), then the maximum DF intensity found
                                                             small (θPC
figuration (DF-QPI). Finally, a dynamic-range-expanded        in the FOV may be described as
OPD image of the sample is computationally recon-
structed by adding the measured PC-DF-QPI image to
                                                                 jU0 ðeiθmn  1Þj2 ¼ 2U02 1  cosθPC
                                                                         PC
                                                                                                         2 PC2       ð1Þ
the SLM input OPD map. To guarantee high sensitivity,                                             max  U0 θ max

it is necessary to precisely calibrate the response of the
SLM with respect to the input numerical value so that           Therefore, in PC-DF-DH, we can increase the amount
                                                                                                                      2
the SLM phase ambiguity becomes lower than that              of illumination light on the sample by a factor of 1=θPC
                                                                                                                    max
offered by the sensitivity of PC-DF-QPI. Note that the       because the DH intensity provided by the sample arm is
                                                                       2                              2
OPD image obtained in the first measurement cannot             U0 eiθmn ¼ U02 for any sample. The 1=θPC
                                                                                                    max times stronger
be used for the computational reconstruction due to the      illumination light enhances the detected scattered-light
digitization noise of the SLM (i.e., B ≠ B′ in Fig. 1b).     intensity, which brings object information, by a factor of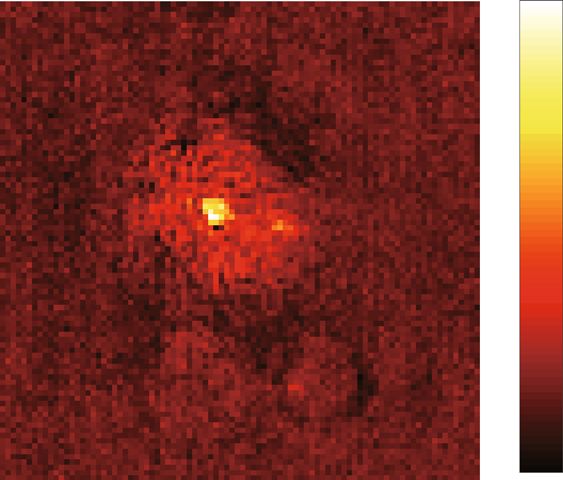
Toda et al. Light: Science & Applications (2021)10:1                                                                                                                  Page 4 of 10

      2
1=θPC
    max . In a holographic measurement, the signal appears                             conventional DH. The slight global deviation in the two
in the interferometric term between the sample and                                     images is likely a high-pass filtering effect caused by the
reference arm light fields. Since we do not change the                                  finite size of the DF mask. This effect can be mitigated by
amount of light in the reference arm in PC-DF-DH, the                                  using a smaller DF mask. The DF-DH image is recon-
signal associated with the scattered-light component is                                structed by using an image of the sample-specific scat-
enhanced by 1=θPC  max . This allows for a dynamic range shift                         tered light measured by DF-DH and that of the
to the smaller-OPD regime with a  1=θPC      max times higher                         unscattered light without the sample measured by DH
signal-to-noise ratio. In addition, there is another, albeit                           (see Supplementary Information 4 for more details).
minor, factor of sensitivity improvement: shot-noise                                     We next confirm that a smaller maximum OPD value in
reduction by the phase cancellation itself. By cancelling                              the FOV allows us to increase the illumination intensity
the OPD distribution due to the sample, the amount of                                  on the sample. A virtual object with arbitrary OPD value
light from the sample arm can be reduced to half before                                (0.16, 0.23, 0.29, 0.40, 0.55 and 0.68 rad) is created with
cancellation, at most. This factor can reduce the shot                                 the SLM (indicated by the arrow in Fig. 2c) and measured
noise by a factor of between 1 and 1.4, which depends on                               with DF-DH by adjusting the illumination intensity on the
the amount of cancelled OPD, in addition to the above-                                 sample to use the full dynamic range of the image sensor.
mentioned improvement factor of 1=θPC          max from the                            The illumination intensity ratio of DF-DH to DH as a
stronger illumination. Details are discussed in Supple-                                function of the maximum OPD is plotted in Fig. 2d. The
mentary Information 2.2.                                                               measured data are in good agreement with the theoretical
                                                                                       values, 1=θ2max , derived from Eq. (1).
Experimental validation of DF-DH                                                         Finally, we evaluate how the noise (temporal standard
  We provide experimental validation of DF-DH, which is                                deviation of OPD) of DF-DH depends on the intensity of
used as a QPI technique in ADRIFT-DH. Figure 2a, b                                     the light illuminating the sample. The noise is evaluated
confirm the QPI capability of DF-DH, where the OPD                                      by taking the standard deviation of 20 continuously
distribution of a 5 μm silica microbead measured by                                    measured temporal data points acquired at 10 Hz and
DF-DH shows good agreement with that obtained with                                     averaging over 80 × 80 pixels (~40 μm × 40 μm) in Fig. 2c.

          a       DH OPD              rad                          DF-DH OPD           rad
                                                                                                    b 1.2
                                       1                                                 1                                                                      DH
                                                                                                                                                                DF-DH
                                                                                                     OPD (rad)

                                        0.5                                             0.5                      0.8

                                        0                                               0                        0.4
                                        –0.5                                            –0.5
                                                                                                                  0
              10 μm                     –1           10 μm                              –1
                                                                                                                                           –5          0      5
                                                                                                                                                Position (μm)

          c                             rad     d                                                                 e
                                        0.7                              102
                                                Illumination intensity

                                                                                                                  OPD noise (mrad)
                                                   ratio (DF-DH/DH)

                                                                                               1/θmax2
                                        0.5                                                                                          5                OPD noise of DH

                                        0.3
                                                                         101                                                         3
                                        0.1
          10 μm                                                                                                                      1
                                        –0.1
                                                                          1
                                                                          0.1    0.3 0.5 0.7 0.9                                     100              101              102
          Maximum OPD object                                                    Maximum OPD (rad)                                          Illumination intensity ratio
                                                                                                                                                  (DF-DH/DH)
 Fig. 2 Experimental validation of DF-DH. a OPD images measured by DH (left) and DF-DH (right). b Cross-sectional profiles along the white dotted
 lines in (a). The blue and orange curves represent the results obtained by DH and DF-DH, respectively. c OPD image measured by DF-DH without the
 sample. An artificial object (indicated by the arrow) with the maximum OPD in the FOV (0.68 rad) is generated with the SLM. The area is used for the
 sensitivity evaluation. d Illumination intensity ratio of DF-DH and DH versus the maximum OPD value in the FOV. The data show good agreement
 with the theoretical curve (solid line). e OPD noise (standard deviation of temporal OPD) versus illumination intensity ratio of DF-DH and DH. The blue
 dotted line indicates the OPD noise of DH and is shown as a reference. The data show good agreement with the theoretical curve (solid line)
 described in Supplementary Information 2.3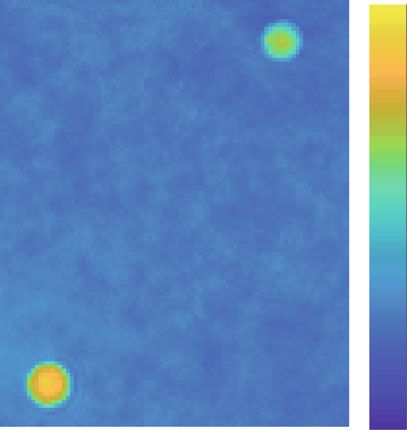
Toda et al. Light: Science & Applications (2021)10:1                                                                              Page 5 of 10

As Fig. 2e shows, the evaluated data are in good agree-                          that the phase cancellation concept works. Figure 3b
ment with the theoretical curve (see Supplementary                               shows DF intensity images of the silica microbead pro-
Information 2.3 for more details), and the noise is                              vided by the sample arm before and after phase cancel-
decreased to 0.9 mrad with a 31 times higher illumination                        lation. Figure 3c shows an intensity image of the sample
intensity. As a reference, the noise of the DH measure-                          arm in DH as a reference. In Fig. 3b, c, the maximum
ment is also shown in Fig. 2e. It remains at 5.7 mrad for                        image sensor count is reduced from ~1100 to ~30, a
any sample because the illumination light is maintained at                       factor of ~35, by switching the system from DH to PC-
the same amount. This is because the OPD produced by a                           DF-DH. The comparison clearly shows that the amount
transparent object appears as a spatial shift of the inter-                      of light the image sensor is exposed to is significantly
ference fringes rather than as a change in the optical                           reduced by PC-DF-DH. This enables us to increase the
intensity.                                                                       illumination light on the sample and improve the OPD
                                                                                 sensitivity.
Experimental validation of phase cancellation
  As discussed above, the amount of dynamic range shift                          Dynamic-range-expanded MIR photothermal QPI of
to the smaller-OPD regime is determined by the max-                              microbeads
imum OPD value after phase cancellation. We validate                               To illustrate the advantage of ADRIFT-QPI, we apply
the phase cancellation method by measuring a large-                              this technique to MIR photothermal QPI10–13. MIR
OPD object (5 μm silica microbead), as shown in Fig. 3.                          photothermal QPI is a recently developed molecular
Figure 3a shows OPD images measured by DH before                                 vibrational imaging method, where the refractive index
and after phase cancellation. The OPD value of the                               change of the sample caused by the absorption of MIR
microbead (~1 rad) is well cancelled to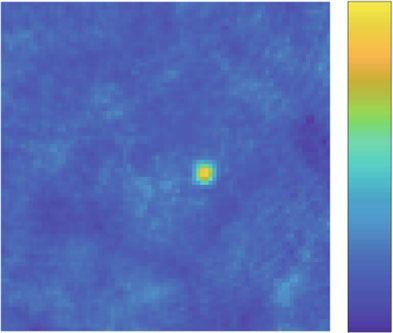
Toda et al. Light: Science & Applications (2021)10:1                                                                                       Page 6 of 10

        a             DH                                ADRIFT-DH                        c
                                         rad                                   rad

                                                                                                                     DH
                                          1.2

                                                                                          OPD change (mrad)
                                                                                 1.2                                 ADRIFT-DH
                                                                                                               20

                                          0.6                                                                  10
         OPD

                                                                                 0.6
                                                                                                               0
                                          0                                      0
                                                                                                              –10
                            10 μm                                  10 μm
                                                                                                              –20
                                          –0.6                                   –0.6                               –20      –10       0    10
        b                                mrad
                                                                                                                          Position (μm)
                                                                               mrad
                                          20                                    20

                                          10                                     10
         OPD change

                                          0                                      0

                                          –10                                    –10
                            10 μm                                  10 μm
                                          –20                                    –20

 Fig. 4 Dynamic-range-expanded MIR photothermal QPI of silica microbeads. a OPD images measured by DH (left) and ADRIFT-DH (right) in the
 MIR OFF state. b Images of the photothermal OPD changes due to absorption of the MIR pump light measured by DH (left) and ADRIFT-DH (right).
 c Cross-sectional profiles along the white dotted lines in (b). The blue and orange plots represent the results obtained by DH and ADRIFT-DH,
 respectively

probe light. In this experiment, silica microbeads                       average 44 images. The small OPD change of a few mrad
immersed in refractive-index-matching oil are used as a                  can be clearly visualized in ADRIFT-DH, which is
sample. The MIR pump pulsed laser is tuned to the                        otherwise buried in the optical shot noise in DH. This
wavenumber of 1045 cm−1, which is resonant with the                      demonstration clearly shows the advantage of the
O–Si–O stretching mode of silica. Figure 4a shows                        expanded dynamic range: the capability of visualizing
the pump-OFF-state OPD images obtained by conven-                        the original large-OPD (>1 rad) distribution of the sample
tional DH and ADRIFT-DH. We can see the same OPD                         concurrently with the small OPD changes (~mrad).
images, including the background surface roughness of
the glass plate. The slight deviation between the images                 Dynamic-range-expanded MIR photothermal QPI of a live
comes from the high-pass filtering effect of the DF mask                  biological cell
used in ADRIFT-DH discussed in the above section (see                       As a more practical demonstration, we show dynamic-
Supplementary Information 5 for more details). Figure 4b                 range-expanded MIR photothermal QPI of a live biolo-
shows the OPD change (pump ON-OFF) due to absorp-                        gical cell. The MIR pump light is tuned to 1550 cm−1,
tion of the MIR pump light, and Fig. 4c shows a cross-                   which is resonant with the peptide bond amide II band
section of the microbead images. In the ADRIFT-DH                        mainly found in proteins. Figure 5a shows the pump-OFF-
measurement, the probe light illumination on the sample                  state OPD images obtained by DH and ADRIFT-DH. We
is 38 times higher than that in the DH measurement, as                   decrease the maximum OPD value in the FOV to ~0.1 rad
the maximum OPD value is decreased to ~0.1 rad by                        by phase cancellation and increase the probe illumination
phase cancellation. This reduces the minimum detectable                  light by a factor of 17, which is limited by the laser power
OPD change by a factor of 6.6, which is obtained as a ratio              in this particular case. The illumination light can be fur-
of the noise floor of ADRIFT-DH and that of DH. The                       ther increased with a proper light source to make full use
noise values are obtained by calculating the spatial stan-               of the sensor dynamic range. The increased illumination
dard deviation for part of the FOV where no sample exists                light reduces the minimum detectable OPD change by a
in the differential OPD image between the pump ON and                    factor of 3.7, which corresponds to decreasing the aver-
OFF states (i.e., Fig. 4b). Note that to achieve the same                aging number by a factor of 14 compared to conventional
sensitivity improvement in conventional DH, we have to                   DH. Figure 5b shows the OPD change between the ON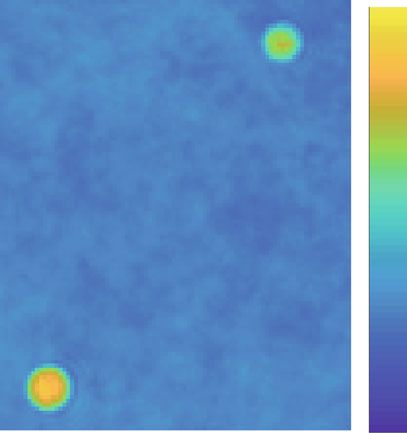
Toda et al. Light: Science & Applications (2021)10:1 Page 7 of 10
a DH rad ADRIFT-DH rad
2.5 2.5
1.5 1.5
OPD
0.5 0.5
10 μm 10 μm
–0.5 –0.5
b mrad mrad
11 11
OPD change
7 7
3 3
10 μm –1 10 μm –1
MIR spot
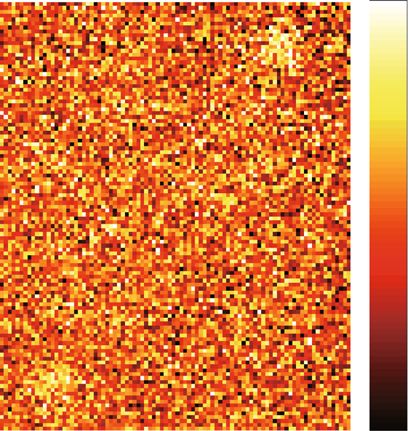
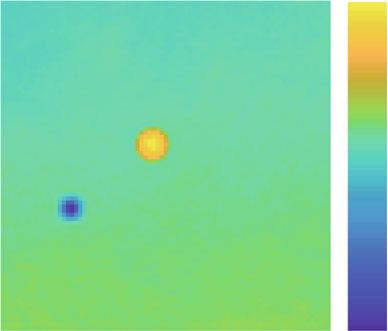
Fig. 5 Dynamic-range-expanded MIR photothermal QPI of a live COS7 cell. a OPD images measured by DH (left) and ADRIFT-DH (right) in the
MIR OFF state. The white, blue and green arrows show the existence of the nucleoli, nucleus and two particles, respectively. b Images of the
photothermal OPD changes due to absorption of the MIR pump light measured by DH (left) and ADRIFT-DH (right). The area in the green dotted
circle indicates the illumination spot of the MIR pump light. The structures indicated by the white (nucleoli), blue (nucleus) and green (particles)
arrows in (a) also give stronger signals in the photothermal images shown in (b), which is visualized clearly with ADRIFT-DH but not with DH
and OFF states due to absorption of the MIR pump light. that in other regions of the FOV), but the improved
Only ADRIFT-DH clearly visualizes the signal localiza- sensitivity is still limited by the sensor saturation capacity.
tion, especially at the nucleus, nucleoli and some particles When a transparent sample, such as a biological cell,
indicated by the arrows in Fig. 5a, which could represent is observed by this technique, the OPD sensitivity
the richness of proteins13. improvement due to over-exposure (or, equivalently,
stronger illumination) can be effective only in limited
Discussion regions of the hologram (i.e., in “valleys” of the inter-
The conceptual essence of ADRIFT-QPI is not only the ferometric pattern of the hologram), while other regions
use of stronger illumination but also the implementation saturate, preventing dramatic OPD dynamic range
of the “DF configuration” and “phase cancellation”, which expansion. Meanwhile, this technique could achieve fur-
enables “adaptive” dynamic range expansion to be ther OPD sensitivity improvement if combined with DF-
achieved throughout the entire FOV irrespective of the DH. However, the sensitivity improvement factor at each
sample OPD distribution. This advantage differentiates pixel in the FOV depends on the OPD value of the object
ADRIFT-QPI from other existing techniques that also that exists there. In the DF configuration, a larger-OPD
enable acquisition of high-dynamic-range OPD images object appears as a brighter spot at the sensor, which
with DH, where only the exposure condition (or equiva- allows the use of over-exposure (or equivalently, stronger
lently, the illumination intensity) is varied. Specifically, a illumination) without sensor saturation at pixels where
technique to obtain a high-SNR hologram synthesized only small-OPD objects exist. Note that this can increase
from multiple holograms recorded with different expo- the OPD sensitivity at these specific locations but not at
sure conditions (i.e., over- and under-exposure) exists24. other pixels where larger-OPD objects exist because
This technique improves the OPD sensitivity only at dark sensor saturation occurs there. Therefore, significant
pixels (i.e., pixels where the light intensity is lower than sensitivity improvement cannot be achieved at locations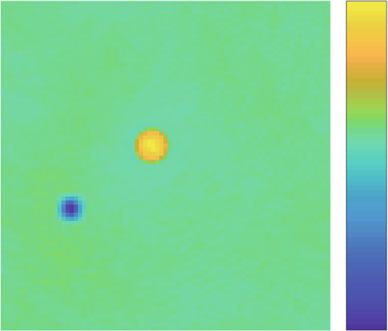
Toda et al. Light: Science & Applications (2021)10:1                                                           Page 8 of 10

where large-OPD objects, such as biological cells, exist.        It is important to consider photodamage to biological
On the other hand, our ADRIFT-QPI, which works                samples because the illumination intensity of ADRIFT-
through a combination of the “DF configuration” and            QPI may be increased by dozens of times compared to
“phase cancellation”, allows for “adaptive” dynamic range     conventional QPI. However, the illumination intensity
expansion regardless of the OPD distribution of the           used in QPI is generally much lower than that used in
sample, which allows for detection of small OPD changes       other live-cell imaging techniques such as fluorescence
on top of large-OPD objects. The “phase cancellation”         and Raman imaging. Therefore, increasing the illumina-
mostly cancels the OPD distribution of the sample and         tion light with our ADRIFT-QPI may not result in a sig-
reduces the brightness of the large-OPD objects in the DF     nificant drawback compared to other imaging modalities.
image. This allows us to significantly increase the illu-      For example, in our work, the illumination intensity
mination light (or equivalently, to perform over-exposure)    ~1 nW/μm2, which is 2 and 6–8 orders of magnitude
at these pixels without sensor saturation. Consequently,      lower than that used in fluorescence25 and Raman26
adaptive OPD sensitivity enhancement can be achieved          imaging, respectively. We should also note that scattering
throughout the entire FOV irrespective of the sample          (i.e., not absorption) measurements basically lead to less
OPD distribution.                                             photodamage than fluorescence imaging even under the
  The amount of dynamic range shift (expansion) can be        same illumination intensity. Even if we use a higher-speed
limited by two factors. One is the maximum OPD after          image sensor with a kHz frame rate, which requires a 2
phase cancellation, and the other is the amount of            orders of magnitude larger amount of light illumination,
increased light the sample is exposed to. In our experi-      the intensity is still 4–6 orders of magnitude lower than
ment, the OPD was cancelled down to 0.1 rad, which            that used in Raman imaging. Furthermore, the current
allows us to increase the illumination light by a factor of   optical system has room for improvement in terms of
100, but in reality, it was limited to 38 because of the      optical throughput. For example, by placing the SLM
imperfection of the DF filtering due to wavefront dis-         before the sample, an ~5 times reduction in the illumi-
tortion of the illumination light of the system, which can    nation intensity can be achieved.
be mitigated with careful implementation of the system.          The required specifications of an image sensor suitable
The OPD can be further cancelled by improving the             for ADRIFT-QPI are described as follows. Since active
alignment of the SLM with respect to the magnified             illumination can be used to nearly saturate the image
image of the sample. Theoretically, an 8-bit SLM allows       sensor in QPI, the dynamic range is determined by the
for OPD cancellation down to 0.025 rad such that ~1000        optical shot noise. Therefore, the sensor read-out noise is
times larger illumination, hence ~33 times higher sen-        not very important as long as it is low enough to be
sitivity, is achievable. A larger-bit SLM would even          ignored compared to the optical shot noise. This means
improve it, although the SLM noise would eventually be        that a low-read-out-noise sensor such as an sCMOS
the limitation.                                               sensor is not required. Indeed, we use a typical CMOS
  In our demonstration of ADRIFT-DH, it is necessary          image sensor with a 10,000 e−/pixel full well capacity and
to switch the system from DH to DF-DH, which limits           10 e−/pixel read-out noise. On the other hand, the sensor
the temporal resolution. However, we believe that there       full well capacity is important in improving the shot-
are several strategies to overcome this limitation and        noise-limited SNR. An image sensor with ultrahigh full
perform higher-speed imaging. First, an electrical            well capacity27 (e.g., Q-2HFW from Adimec) can be used
switching device, such as a digital micromirror device,       to further improve the sensitivity of ADRIFT-QPI.
could be used to achieve fast switching between DH and        Although the illumination intensity further increases with
DF-DH at a kHz rate. Second, we can avoid the                 the use of this special sensor, it is 3–5 orders of magnitude
switching itself by the following two methods. In one, we     lower than that used in Raman imaging and reasonable for
can separately implement DH and DF-DH with multiple           live-cell imaging.
image sensors. In the other, we measure all the neces-           The dynamic range can be better shifted in PC-DF-DH
sary images by DF-DH if the reconstruction algorithm          by implementing amplitude cancellation in addition to
and calculation speed can be optimized (i.e., there is no     phase cancellation (see Supplementary Information 3 for
need to use DH in the first measurement). Third, the           more details). This is especially useful for measuring non-
SLM input OPD values do not need to be refreshed for          transparent and/or defocused samples (e.g., thick or
every measurement because the large-OPD structures of         overlapped samples) because the amplitude distribution
a cell, which we want to cancel out, do not move fast.        causes inefficient DF rejection.
We can capture the quick movement of small particles             In this work, we used ADRIFT-QPI to improve MIR
inside the cell without refreshing the SLM pattern            photothermal QPI, but it can also be used for other appli-
because these OPD changes are small enough to be              cations. For example, there are some situations where the
measured only by DF-DH.                                       substrate static roughness can be decoupled from the signal,
Toda et al. Light: Science & Applications (2021)10:1                                                             Page 9 of 10

such as in flow cytometry28, optical tweezer applications29,      arms, respectively. A transmission grating with 100 line-
optical diffraction tomography30–32, and detection of            pairs/mm (66–341, Edmund Optics) placed in the sample
dynamic OPD changes6,9,12. In addition, due to the cap-          conjugate plane and two lenses (AC508-100-A, Thorlabs)
ability to adaptively shift the dynamic range regardless of      create off-axis reference light. The laser intensity fluctua-
the sample condition, ADRIFT-QPI has the potential to be         tion (1–2% in our case) is numerically compensated by
as sensitive as the state-of-the-art wide-field scattering        recording a part of the light with another camera
imaging techniques, such as iSCAT, which is used for small       (acA2440-75 μm, Basler) so that shot-noise-limited detec-
particle measurement with extremely high sensitivity, even       tion is achieved. We mitigate background OPD fluctuations
in the presence of highly scattering objects. We note that       caused by convection of the ambient air by enclosing the
ADRIFT-QPI can be understood as a forward scattering             system in a box. The image sensor is operated at 10 or
counterpart of backscattering-based iSCAT. Therefore, it         20 Hz with an exposure time of 60 or 30 ms for the
could provide a new opportunity to study the behaviour of        experiments shown in Figs. 2–5, respectively. The number
small particles inside and outside cells without losing cel-     of pixels is reduced from 1024 × 1024 (raw interferogram)
lular morphological information. The MIR photothermal            to 152 × 152 (complex-field reconstruction) through
QPI technique can also be implemented in the same system         the phase retrieval process described in Supplementary
to add molecular contrast.                                       Information 2.1. The reconstructed image has a diffraction-
                                                                 limited pixel size of ~500 nm. The visible illumination
Materials and methods                                            power at the sample plane can be increased up to
Light source                                                     ~100 μW.
  The visible light source is based on second harmonic
generation (SHG) of a 10-ns, 1000-Hz, 1064-nm pulsed             Phase cancellation
Q-switched laser (NL204-1K, Ekspla) with a nonlinear               The phase cancellation requires the following calibra-
crystal LBO (Eksma Optics). The spatial mode of the              tion for estimating the voltages to be loaded on each pixel
SHG beam is cleaned by a single-mode optical fibre                of the SLM (consisting of N pixels) from the OPD image
(P3-405B-FC-5, Thorlabs). The spectral bandwidth is              measured with DH (consisting of M pixels), where the
~2 nm after the fibre, which reduces the coherent                 number of pixels generally does not match between the
noise. We note that a CW laser can be used for many              two images, with N > M. We generate a set of calibration
applications of this technique, although a nanosecond            images that links the N-pixel SLM image and M-pixel
pulsed laser is required as the probe light for MIR              OPD image for each of the 256 (8 bit) phase gradients of
photothermal QPI.                                                the SLM. This can be made by inputting a uniform voltage
                                                                 to all N pixels of the SLM and measuring the corre-
ADRIFT-DH system                                                 sponding M-pixel OPD image by DH. Then, by using the
  A complete description of the optical system is provided       set of calibration images, we translate the measured
in Supplementary Information 1. Linearly polarized light is      M-pixel OPD image to the N-pixel SLM input voltage
created by a polarizer, and its polarization direction is        image for phase cancellation. In case the phase cancella-
precisely adjusted by a half-wave plate to the orientation of    tion does not sufficiently work, we can iteratively run the
the liquid crystals in the SLM. The light is split into two by   cancellation procedure with feedback on the uncancelled
a beamsplitter (BS061, Thorlabs). In the sample arm, the         remaining OPD distribution.
intensity of the illumination light can be adjusted with a
neutral density (ND) filter (NDC-50C-2-A, Thorlabs)               Samples
placed before the sample. The sample image is magnified             Porous silica microbeads [43-00-503, Sicastar (micro-
by a factor of 44 at the image sensor (acA2440-75 μm,            mod Partikeltechnologies GmBH)] immersed in index-
Basler) with an objective lens with an NA of 0.6                 matching oil (refractive index 1.50 at 587.56 nm, Shi-
(LUCPLFLN40X, Olympus) and relay lenses (AC508-100-              madzu) are used as the sample for the experiments shown
A and AC508-200-A, Thorlabs). The image sensor                   in Figs. 2–4. The COS7 cells (Riken) for the experiment
(acA2440-75 μm, Basler) has a full well capacity of              shown in Fig. 5 are cultured in Dulbecco’s modified
~10,000 e−/pixel. A phase-only SLM [1920 × 1152 XY               Eagle’s medium (DMEM) with 10% foetal bovine serum
Phase Series Spatial Light Modulator (Meadowlark Optics)]        supplemented with penicillin–streptomycin, L-glutamine,
is placed in the sample conjugate plane. A circular mask         sodium pyruvate and nonessential amino acids at 37 °C in
deposited on a glass substrate (50 or 100 μm in diameter,        5% CO2. For live-cell imaging, the cells are cultured in a
TOPRO) is put in the Fourier plane as a DF mask. In the          35-mm glass-bottomed dish (AGC Techno Glass), and
reference arm, a delay line and a beam expander (A397TM-         the medium is replaced by phenol red-free culture med-
A and AC254-075-A, Thorlabs) adjust the differences in           ium containing HEPES buffer (2 mL) before imaging. All
the optical path length and beam diameter between the two        solutions are from Thermo Fisher Scientific.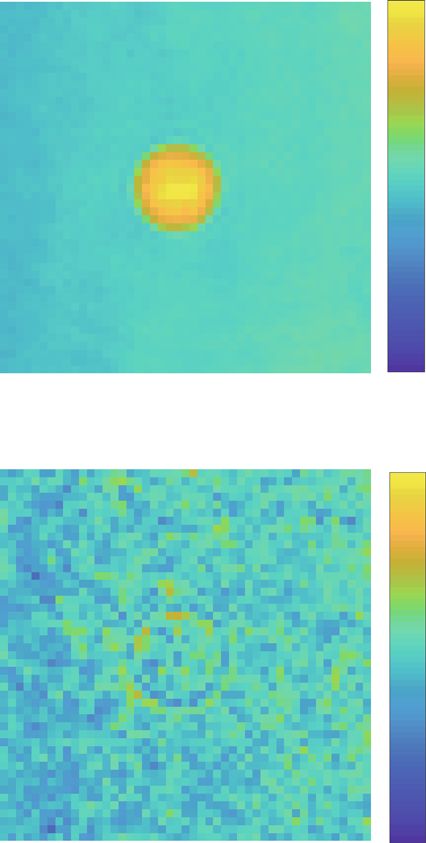
Toda et al. Light: Science & Applications (2021)10:1                                                                                                    Page 10 of 10

MIR photothermal QPI of microbeads                                                     4. Park, Y., Depeursinge, C. & Popescu, G. Quantitative phase imaging in bio-
  MIR pulses with a duration of 5 μs lasing at 1045 cm−1                                  medicine. Nat. Photonics 12, 578–589 (2018).
                                                                                       5. Bhaduri, B. et al. Diffraction phase microscopy: principles and applications in
provided by a quantum cascade laser (QD9500CM1,                                           materials and life sciences. Adv. Opt. Photonics 6, 57–119 (2014).
Thorlabs) are used as the pump light. A ZnSe lens                                      6. Popescu, G. et al. Diffraction phase microscopy for quantifying cell structure
(LA7733-G, Thorlabs) with a focal length of 20 mm is                                      and dynamics. Opt. Lett. 31, 775–777 (2006).
                                                                                       7. Zernike, F. Phase contrast, a new method for the microscopic observation of
used to loosely focus the MIR light onto the sample with                                  transparent objects. Physica 9, 686–698 (1942).
an excitation-field diameter of ~75 μm. The MIR ON-                                     8. Allen, R. D., Allen, S. N. & Travis, J. L. Video-enhanced contrast, differential
OFF modulation rate is 5 Hz. The MIR pulse energy at the                                  interference contrast (AVEC-DIC) microscopy: a new method capable of
                                                                                          analyzing microtubule-related motility in the reticulopodial network of allo-
sample plane is ~50 nJ. The diameter of the DF mask is                                    gromia laticollaris. Cell Motil. 1, 291–302 (1981).
100 μm.                                                                                9. Popescu, G. et al. Optical imaging of cell mass and growth dynamics. Am. J.
                                                                                          Physiol.-Cell Physiol. 295, C538–C544 (2008).
                                                                                      10. Tamamitsu, M. et al. Quantitative phase imaging with molecular vibrational
MIR photothermal QPI of a COS7 cell                                                       sensitivity. Opt. Lett. 44, 3729–3732 (2019).
  MIR pulses with a duration of 1 μs lasing at 1550 cm−1                              11. Toda, K. et al. Molecular contrast on phase-contrast microscope. Sci. Rep. 9,
provided by a quantum cascade laser [DO418, Hedgehog                                      9957 (2019).
                                                                                      12. Zhang, D. L. et al. Bond-selective transient phase imaging via sensing of the
(Daylight Solutions)] are used as the pump light. A ZnSe                                  infrared photothermal effect. Light.: Sci. Appl. 8, 116 (2019).
lens (LA7733-G, Thorlabs) with a focal length of 20 mm is                             13. Tamamitsu, M. et al. Label-free biochemical quantitative phase imaging with
used to loosely focus the MIR light onto the sample with                                  mid-infrared photothermal effect. Optica 7, 359–366 (2020).
                                                                                      14. Horio, T. & Hotani, H. Visualization of the dynamic instability of individual
excitation-field elliptical major and minor axes of ~70 and                                microtubules by dark-field microscopy. Nature 321, 605–607 (1986).
~30 μm, respectively. The MIR pulse energy at the sample                              15. Verpillat, F. et al. Dark-field digital holographic microscopy for 3D-tracking of
plane is ~100 nJ. The diameter of the DF mask is 50 μm.                                   gold nanoparticles. Opt. Express 19, 26044–26055 (2011).
                                                                                      16. Taylor, R. W. & Sandoghdar, V. In Label-Free Super-Resolution Microscopy (ed.
                                                                                          Astratov, V.) 25–65 (Springer, Cham, 2019).
Acknowledgements
                                                                                      17. Young, G. & Kukura, P. Interferometric scattering microscopy. Annu. Rev. Phys.
We thank Haruyuki Sakurai for giving us feedback about the manuscript. We
                                                                                          Chem. 70, 301–322 (2019).
are grateful to Masaharu Takarada and Kohki Okabe for offering biological cells.
                                                                                      18. Taylor, R. W. et al. Interferometric scattering microscopy reveals microsecond
This work was financially supported by JST PRESTO (JPMJPR17G2).
                                                                                          nanoscopic protein motion on a live cell membrane. Nat. Photonics 13,
                                                                                          480–487 (2019).
Author details                                                                        19. De Wit, G. et al. Revealing compartmentalized diffusion in living cells
1
 Department of Physics, The University of Tokyo, Tokyo 113-0033, Japan.                   with interferometric scattering microscopy. Biophysical J. 114,
2
 Institute for Photon Science and Technology, The University of Tokyo,                    2945–2950 (2018).
Tokyo 113-0033, Japan. 3PRESTO, Japan Science and Technology Agency,                  20. Yu, H. et al. Recent advances in wavefront shaping techniques for biomedical
Saitama 332-0012, Japan                                                                   applications. Curr. Appl. Phys. 15, 632–641 (2015).
                                                                                      21. Horstmeyer, R., Ruan, H. W. & Yang, C. Guidestar-assisted wavefront-shaping
Author contributions                                                                      methods for focusing light into biological tissue. Nat. Photonics 9, 563–571
K.T. conceived the concept, designed and constructed the systems, performed               (2015).
the experiments and analysed the data. M.T. contributed to the design of the          22. Maurer, C. et al. What spatial light modulators can do for optical microscopy.
systems and the experiments and data interpretation. T.I. supervised the entire           Laser Photonics Rev. 5, 81–101 (2011).
work. All authors wrote the manuscript.                                               23. Juffmann, T. et al. Local optimization of wave-fronts for optimal sensitivity
                                                                                          PHase imaging (LowPhi). Opt. Commun. 454, 124484 (2020).
Data availability                                                                     24. Yonesaka, R. et al. High dynamic range digital holography and its
The data provided in the manuscript and supplementary information are                     demonstration by off-axis configuration. IEEE Trans. Ind. Inform. 12,
available from T.I. upon request.                                                         1658–1663 (2016).
                                                                                      25. Kner, P. et al. Super-resolution video microscopy of live cells by structured
Conflict of interest                                                                       illumination. Nat. Methods 6, 339–342 (2009).
The authors declare that they have no conflict of interest.                            26. Shipp, D. W., Sinjab, F. & Notingher, I. Raman spectroscopy: techni-
                                                                                          ques and applications in the life sciences. Adv. Opt. Photonics 9,
Supplementary information is available for this paper at https://doi.org/                 315–428 (2017).
10.1038/s41377-020-00435-z.                                                           27. Hosseini, P. et al. Pushing phase and amplitude sensitivity limits in interfero-
                                                                                          metric microscopy. Opt. Lett. 41, 1656–1659 (2016).
                                                                                      28. Merola, F. et al. Tomographic flow cytometry by digital holography. Light.: Sci.
Received: 28 April 2020 Revised: 9 November 2020 Accepted: 14 November                    Appl. 6, e16241 (2017).
2020                                                                                  29. Cardenas, N. & Mohanty, S. K. Optical tweezers assisted quantitative phase
                                                                                          imaging led to thickness mapping of red blood cells. Appl. Phys. Lett. 103,
                                                                                          013703 (2013).
                                                                                      30. Sung, Y. et al. Optical diffraction tomography for high resolution live cell
References                                                                                imaging. Opt. Express 17, 266–277 (2009).
 1. Cuche, E., Bevilacqua, F. & Depeursinge, C. Digital holography for quantitative   31. Kim, Y. et al. Common-Path diffraction optical tomography for investigation of
     phase-contrast imaging. Opt. Lett. 24, 291–293 (1999).                               three-dimensional structures and dynamics of biological cells. Opt. Express 22,
 2. Kim, M. K. Principles and techniques of digital holographic microscopy. SPIE          10398–10407 (2014).
     Rev. 1, 018005 (2010).                                                           32. Kim, T. et al. White-light diffraction tomography of unlabelled live cells. Nat.
 3. Cotte, Y. et al. Marker-free phase nanoscopy. Nat. Photonics 7, 113–117 (2013).       Photonics 8, 256–263 (2014).
You can also read