Detection of Kidney Stones in Ultrasound Images Using Median Filter Compared with Rank Filter
←
→
Page content transcription
If your browser does not render page correctly, please read the page content below
Detection of Kidney Stones in Ultrasound Images Using Median Filter Compared
                                with Rank Filter

                                   Annameti Rohith1; S. Premkumar2*
     1
       Research Scholar, Department of Electronics and Communication Engineering, Saveetha School of
Engineering, Saveetha Institute of Medical and Technical Sciences, Saveetha University, Chennai, Tamil Nadu,
                                                    India.
                                       1
                                         annametirohith123@gmail.com
2*
   Project Guide, Department of Electronics and Communication Engineering, Saveetha School of Engineering,
    Saveetha Institute of Medical and Technical Sciences, Saveetha University, Chennai, Tamil Nadu, India.
                                          2*
                                             premkumar@saveetha.com

 Abstract
 Aim: To detect the kidney stones in ultrasound images using median filters to improve the detection
 rate in terms of accuracy and sensitivity. Materials and Methods: The accuracy and sensitivity of
 median filter (n=114) was compared with rank filter (n=114). The median filter is used to detect the
 kidney stone in ultrasound images. 114 is the sample size taken with the p-value 0.8 and has been
 used to improve detection rate of kidney stones in terms of accuracy and sensitivity using Matlab
 simulation tool. Results: According to the results obtained Median filter has accuracy (86.4%) and
 rank filter has accuracy (82.2%) and also sensitivity of median filter (87.7%) and sensitivity of rank
 filter is (82.5%). Median filter has a significantly higher accuracy (p=0.018) and sensitivity
 (p=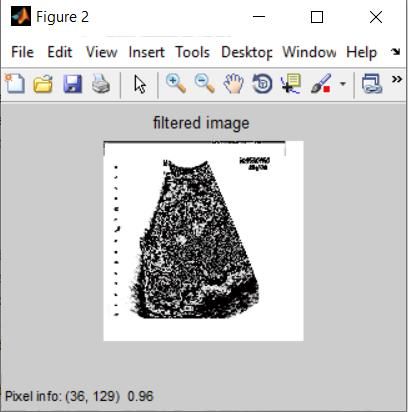
shaped organ and present on each side of the spine (Akkasaligar and Biradar 2016). The main
application of detection is used in brain tumor detection and thyroid segmentation. The applications
of image processing are used in Image sharpening and restoration, Medical field, Color Processing,
Pattern Recognition. The disadvantage of ultrasound images is that they have low contrast and
speckle noise. It is a challenging task for detection of kidney stones. Speckle noise is an inherent
property of medical ultrasound imaging, and it generally tends to reduce the image resolution and
contrast, thereby reducing the diagnostic value of the imaging modality (Karthick 2019). The
proposed algorithm is median filter, it works by moving through the image pixel by pixel replacing
each value with the median values of neighboring pixels. It is particularly effective at removing noise
while preserving edges. The median filter is calculated by initial sorting all the picture element prices
from the window in numerical order then exchanging the picture. Ultrasound imaging is a process in
which high frequency sound waves are used to monitor or to capture the internal organs in the body.
Through this technique we can find the damaged parts inside the body. Hence ultrasound imaging is
used to detect the stones in the kidney (Raja et al. 2007).

                       Fig. 1 - Stones in kidney (Akkasaligar, Biradar, and Kumbar 2017)

        In the last 5 years there were 16000 articles in google scholar and IEEE xplore on kidney
stone detection using different types of filters. Digital image processing is used to find the images
which have low contrast and speckle noise.(Ranjitha 2019) . Speckle noise and shadows present in
ultrasound images makes the identification of kidney stones very complex(Rahman and Uddin 2013).
ANN based classification reduces diagnosis time and increases the efficiency with accuracy(Ebrahimi

ISSN: 2237-0722                                                                                     1097
Vol. 11 No. 4 (2021)
Received: 16.05.2021 – Accepted: 08.06.2021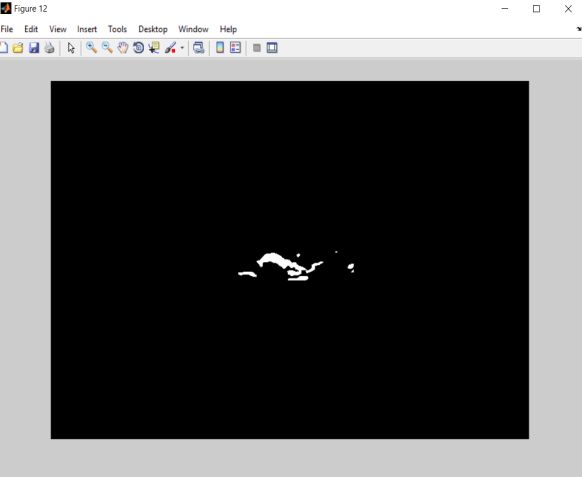
et al. 2015). The preprocessed image is formed with level set segmentation to detect the stone region.
(Rathi, Gladis Pushpa, and Palani 2011). Based on the overall analysis, detection of kidney stones in
ultrasound images using ANN classification has better to detect the stone in the kidney.(Viswanath
and Gunasundari 2016).
         Previously our team has a rich experience in working on various research projects across
multiple disciplines (Sathish and Karthick 2020; Varghese, Ramesh, and Veeraiyan 2019; S. R.
Samuel, Acharya, and Rao 2020; Venu, Raju, and Subramani 2019; M. S. Samuel et al. 2019; Venu,
Subramani, and Raju 2019; Mehta et al. 2019; Sharma et al. 2019; Malli Sureshbabu et al. 2019;
Krishnaswamy et al. 2020; Muthukrishnan et al. 2020; Gheena and Ezhilarasan 2019; Vignesh et al.
2019; Ke et al. 2019; Vijayakumar Jain et al. 2019; Jose, Ajitha, and Subbaiyan 2020). Now the
growing trend in this area motivated us to pursue this project.
         The detection of kidney stones is a highly challenging task as they have low contrast and
speckle noise. This challenge is overcome by using suitable imaging techniques and filters.
Ultrasound images normally consist of speckle noise which cannot be removed by normal filters. So
the median filtering algorithm is proposed, the median filter removes the speckle noise. The
preprocessed image is achieved with a median filter to remove noise and to detect the stone region.
Majority of people with kidney stone disease do not notice the disease as it damages organs slowly
before showing symptoms. Different types of kidney stones namely renal calculi, struvite stones,
staghorn stones were analyzed.(Hafizah and Supriyanto 2011). In order to get rid of the painful
disorder the kidney stone is diagnosed through ultrasound images and then removed through a
surgical process like breaking up of stone into smaller pieces which then pass through the urinary
tract.

2. Materials and Methods

         Study setting of proposed work is done in our university. The number of groups identified for
the study is 2. The group 1 is median filter and group 2 is rank filter. Matlab 2014a tool kit will be
used to write the code and simulate. Using matlab accuracy and sensitivity has been calculated for the
required algorithm and then results have been compared. Sample size per group is 114 (Kane, Phar,
and BCPS n.d.). Median filter and rank filter are explained below. SPSS software has been used to
compare the results and to find the graph. The pre-test analysis has done with p-value with 0.8 (g-
power 80%).

ISSN: 2237-0722                                                                                   1098
Vol. 11 No. 4 (2021)
Received: 16.05.2021 – Accepted: 08.06.2021
3. Median Filter
Accuracy and sensitivity of the median filter are analyzed by varying different ultrasound
images in the MATLAB simulation tool. Matlab(2014a) will be used for simulation with required
add-ons installed, these are predefined functions in the matlab for the image processing. Open matlab
software and open new m.file. Write the code for the median filter and save the file in the desired
location. Store the input images in the location using the median filter algorithm. Then extract kidney
images and find the stone in the ultrasound image. After processing the code the output image will be
displayed in the command window and repeat the experiment for different kidney ultrasound images
and get the output and find the detection rate using the formula. Kidney stone ultrasound images are
taken as input images which are independent variables. Accuracy and sensitivity will be as output
variables. By comparing the results a better algorithm has been decided. Detection rate of the
algorithms will be calculated using the formula.
Detection rate = (No. of output images/Total input images)*100
The Median filter removes the speckle noise in an ultrasound image. Median filter is used in
digital image processing to remove noise. It is an innovative method in which filtering is done using a
median filter to detect stones in the kidney. Median filtering algorithm uses a neighborhood area as a
filtering window, which changes the size of the filtering window according to certain setting
conditions in the filtering process as shown in Fig. 2.
Fig. 2 - Median filter (ALhussieny 2017)
The median filter is an efficient methodology that may, to some extent, distinguish out of vary
isolation from legitimate image options like edges and features. Specifically the median filter replaces
a pixel by the median, instead of the average of all pixels in a neighborhood Ѱ.
ISSN: 2237-0722 1099
Vol. 11 No. 4 (2021)
Received: 16.05.2021 – Accepted: 08.06.2021The median filter is a non linear signal processing technology based on statistics. The median
value of the digital image will be given in the place of noisy value. The pixels of the mask are ranked
in the order of the gray levels and the median of the group is stored to replace the noisy value.
median[A(x) + B(x)] ≠ median [A(x)] + median [B(x)]
First start the process in the matlab tool. Collect the ultrasound images or collect different
datasets of kidney images for detection of stone as shown in block diagram of Fig. 3. Use the median
filter. The median filter removes noise in an ultrasound image using salt & pepper. So that it can
detect the stone. Next step is image processing. The image processing does the improvement of the
image data that suppresses unwilling distortions or enhances some image features. So finally the
morphing is used for edge detection of the image.
Fig. 3 - Block Diagram of Kidney Stone Detection
4. Rank Filter
Accuracy and sensitivity of the rank filter are analyzed by varying different ultrasound images
in the MATLAB simulation tool. Matlab (2014a) will be used for simulation with required add-ons
installed, these are predefined functions in the matlab for the image processing. Open matlab software
and open new m.file. Write the code for the rank filter and save the file in the desired location. Store
the input images in the location using the rank filter algorithm. Then extract kidney images and find
the stone in the ultrasound image. After processing the code the output image will be displayed in the
command window and repeat the experiment for different kidney ultrasound images and get the
output and find the detection rate using the formula. Kidney stone ultrasound images are taken as
input images which are independent variables. Accuracy and sensitivity will be as output variables.
By comparing the results a better algorithm has been decided. Detection rate of the algorithms will be
calculated using the formula.
Detection rate = (No. of output images/Total input images)*100
Rank filters are non linear filters that use the local gray level ordering to compute the filtered
value as shown in Fig. 4. Rank filters can be used for several purposes such as image quality
enhancement, image preprocessing, feature extraction and post processing.
ISSN: 2237-0722 1100
Vol. 11 No. 4 (2021)
Received: 16.05.2021 – Accepted: 08.06.2021Fig. 4 - Rank Filter (Heygster 1982)
For rank filters, the output images got maximum same as the median filter. Because both
filters remove noises in an ultrasound image. Rank filters operating on images assign the k th value of
the gray levels from the window consisting of M pixels arranged according to their value to the center
point of the window.(Wang et al. 2012). On implementing the planned rule there have been some
variations in precise position of the stone that might be corrected by variable the intensity adjustment
of every ultrasound image of the stone.
The method of image filtering depends on the relationship between noise and images and the
processing requirements (Malalla et al. 2015). Typically filtering methods include median filtering
and rank filtering, the median filter has achieved good results in image denoising recovery. The
median filter is a typical non linear filter based on sorting statistics to complete signal recovery. The
basic principle is to replace the value of the digital image or the center point of the digital sequence
with the median value of the neighborhood of the point. Filtering is an important step in image
processing(Sadeghi et al. 2012). Filtering is an effective method to reduce noise and improve image
quality. It is widely used in image processing. MATLAB is used to realize the filtering process,
which effectively improves the quality and efficiency of image processing (Cunitz et al. 2014). Image
with noise is taken as independent variables in this study, and based on this output images will be
shown in the command window with dependent variables accuracy and sensitivity. Detection rate will
be calculated with the help of output variables.
5. Results
Kidney stone detection using median filter in Matlab simulation tool and the output obtained
for stone detection is shown in above figures. With the help of present algorithms doctors can look
ISSN: 2237-0722 1101
Vol. 11 No. 4 (2021)
Received: 16.05.2021 – Accepted: 08.06.2021forward to appropriate treatment methods which can result in the removal of stone from kidneys in an
appropriate manner.
Table 1 shows the accuracy and sensitivity for different samples for Median filter and Rank
filter algorithm. These results were obtained by simulating the images in Matlab. In this 18 results for
sample images has been taken and were shown in the table. This can be useful in comparing the both
algorithms.
Table 1 - Samples taken from various datasets. From the Kaggle Dataset 114 samples were taken, All the dataset contains 2
classes (with kidney stones and without kidney stones) Tabulation explains the accuracy and sensitivity of median filter and
rank filter respectively
S.NO Median filter Rank filter
Parameter Accuracy Sensitivity Accuracy Sensitivity
1. 85.6 84.2 81.5 80.1
2. 89.5 88.2 82.3 81.2
3. 86.2 83.2 82.9 81.3
4. 87.2 84.2 84.1 83.6
5. 86.3 82.3 82.3 84.3
6. 91.3 85.2 85.3 82.3
7. 89.2 86.1 84.2 82.3
8. 91.5 88.5 86.2 84.3
9. 89.3 84.3 84.1 82.3
10. 88.5 86.2 82.3 80.6
11. 84.3 80.3 80.3 80.1
12. 87.2 84.2 84.2 81.3
13. 89.3 85.2 86.2 82.3
14. 84.2 81.3 81.6 80.4
15. 89.4 85.2 85.6 81.3
16. 88.9 84.1 84.2 82.3
17. 87.3 83.1 86.2 84.6
18. 90.6 84.3 84.2 81.2
Table 2 - Group statistics: Statistical analysis of median filter and rank filter. Mean accuracy value, standard deviation and
standard error mean for median filter and rank filter algorithms are obtained for 114 iterations. It is observed that the
median filter algorithm performed better than the rank filter.
Group No of samples mean Std. deviation Std. mean error
Median 114 86.4588 2.33704 .21888
Accuracy
Rank 114 82.2956 1.99661 .18700
Median 114 87.7553 2.79817 .26207
Sensitivity
Rank 114 82.5070 1.60313 .15015
ISSN: 2237-0722 1102
Vol. 11 No. 4 (2021)
Received: 16.05.2021 – Accepted: 08.06.2021Table 2 shows the number of samples taken and mean values of accuracy and sensitivity for
the 114 samples and standard deviation were obtained for 114 samples using SPSS software. In the
table standard error mean for the accuracy and sensitivity of median filter and rank filer.
Table 3 - Independent Sample test for significance and standard error determination. P value is less than 0.05 considered to
be statistically significant and 95% confidence intervals were calculated.
Levene's test for equality of variances T- test for equality of means
95% confidence
Mean Std.
sig(2- interval of the
F Sig t df differen error
tailed) difference
ce diff
lower upper
Equal
variances 5.712 .018 14.461 226Fig. 5 - Original Image
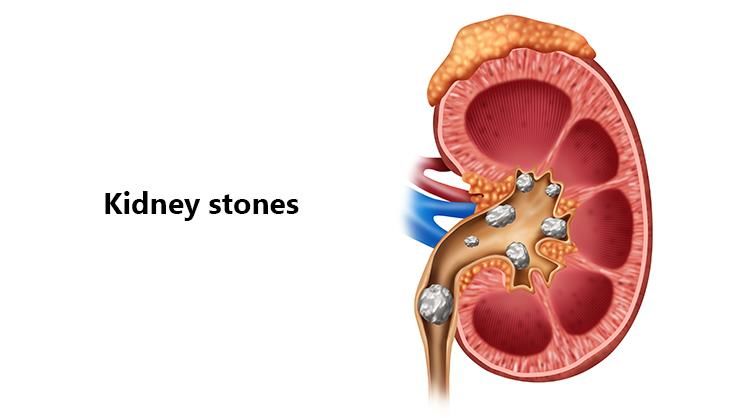
Fig. 6 - Removal of noise using median filter
Figure 7 shows that stone is detected using median filter, so with the help of this doctor can do
surgeries safely.
Fig. 7 - Stone is detected using median filter
ISSN: 2237-0722 1104
Vol. 11 No. 4 (2021)
Received: 16.05.2021 – Accepted: 08.06.2021Figure8 shows the accuracy graph which it took for 114 sample images for detection rate of
kidney in terms of accuracy and sensitivity and it shows the comparison of median filter and rank
filter.
Fig. 8 - Accuracy graph which shows the comparison of median filter and rank filter
Figure 9 shows the sensitivity graph which it took for 114 sample images for detection and it
shows the comparison of median filter and rank filter.
Fig. 9 - Sensitivity Graph which shows the comparison of median filter and rank filter
ISSN: 2237-0722 1105
Vol. 11 No. 4 (2021)
Received: 16.05.2021 – Accepted: 08.06.2021Figure 10 shows the bar chart for accuracy and sensitivity of median filter and rank filter
using SPSS tool.
Fig. 10 - Graph obtained using SPSS that compares sensitivity and accuracy of median filter and rank filter. Graph obtained
using SPSS that compares sensitivity and accuracy of median filter and rank filter and it shows that median filter has better
Accuracy and Sensitivity compared with rank filter. In the graph median filter and rank filter are compared in x-axis and
Mean of Accuracy and Sensitivity with +/- 1 SD
Using matlab tool kit simulation has done and got the results as below and have seen that
median filters have given significant results compared to rank filters. First it removes noise and it will
detect the stone using a median filter. In this study using IBM SPSS software analysis was done for
the project. The mean accuracy and sensitivity for has analysed by iterating 20 samples and group
statistics and independent sample test has done and results were analysed Using SPSS and obtained
the graphs.
6. Discussion
Median filter has accuracy better than rank filter 4.24% and also median filter has sensitivity
better than rank filter 5.25%. Hence median filters have significant results compared with rank filters.
The pre-test analysis has done with p-value with 0.8 (g-power 80%).
Image processing has become a typical technique for creating pictures more comprehensible
to the human eye. Images acquired are found to be corrupted in noise with noise in many cases. There
are many methods available to remove impulse noise in gray scale and color image(Wu and Sun,
n.d.). But only very little has been done for the removal of noise in color images. Of the many filters
presented, most of them are only for gray scale images. Image filtering techniques may be usually
ISSN: 2237-0722 1106
Vol. 11 No. 4 (2021)
Received: 16.05.2021 – Accepted: 08.06.2021classified as linear and nonlinear(Hafizah and Supriyanto 2011). Linear filters can be used to remove
certain types of noise. Linear filtering is the filtering in which the value of output pixels is a linear
combination of the values of the pixels in the input pixels neighborhood (Jain 2005). Linear filtering
is filtering in which the value of an output pixel is a linear combination of the values of the pixels in
the input pixel's neighbourhood(Gonzalez, Woods, and Masters 2009). Convolution is a
neighbourhood operation in which each output pixel. is the weighted sum of neighbouring input
pixels(Hansen and Yu 2000). The main disadvantage of convolution filters is, it is not good for all
types of noise. It is sensitive to variations in variations in orientation and scale.(Gonzalez, Woods,
and Masters 2009; Maragos 2005).
Our institution is passionate about high quality evidence based research and has excelled in
various fields (Vijayashree Priyadharsini 2019; Ezhilarasan, Apoorva, and Ashok Vardhan 2019;
Ramesh et al. 2018; Mathew et al. 2020; Sridharan et al. 2019; Pc, Marimuthu, and Devadoss 2018;
Ramadurai et al. 2019). We hope this study adds to this rich legacy.
Median filter and rank filter are used to find the detection of kidney stones in ultrasound
images.
It also has some disadvantages. The median filter removes both noise and the fine detail since
it can’t tell the difference between the two. Anything relatively small in size compared to the size of
the neighbourhood will have minimal effect on the value of the median, and will be filtered out. In
other words, the median filter can’t distinguish fine detail from noise. In this study the algorithm used
is a median filter to remove noise in an ultrasound image and to detect the kidney stone in the
ultrasound image, but if compared with another algorithm the median filter gets better results.
Accuracy of the image can be still improved using advanced filters
7. Conclusion
Based on the results and tabulations, the detection rate of the kidney stones in ultrasound
images using median filters is improved in terms of accuracy (86.4%) and sensitivity (87.7%)
compared with the accuracy (82.2%) and Sensitivity (82.5%) of rank filter.
8. Declarations
Conflict of Interest
No conflict of interest in this manuscript.
ISSN: 2237-0722 1107
Vol. 11 No. 4 (2021)
Received: 16.05.2021 – Accepted: 08.06.2021Authors Contribution
Author AR was involved in image collection, analysis of image and manuscript writing.
Author SP was involved in conceptualization, image validation, and critical review of manuscript.
Acknowledgement
The authors would like to express their gratitude towards Saveetha School of Engineering,
Saveetha Institute of Medical and Technical Sciences (Formerly known as Saveetha University) for
providing the necessary infrastructure to carry out this work successfully.
Funding: We thank the following organizations for providing financial support that enabled
us to complete the study.
1. Qbec Infosol Pvt. Ltd.,
2. Saveetha University
3. Saveetha Institute of Medical and Technical Sciences.
4. Saveetha School of Engineering.
References
Akkasaligar, Prema T., and Sunanda Biradar. 2016. “Diagnosis of Renal Calculus Disease in Medical
Ultrasound Images.” 2016 IEEE International Conference on Computational Intelligence and
Computing Research (ICCIC). https://doi.org/10.1109/iccic.2016.7919642.
Akkasaligar, Prema T., Sunanda Biradar, and Veena Kumbar. 2017. “Kidney Stone Detection in
Computed Tomography Images.” 2017 International Conference On Smart Technologies For Smart
Nation (SmartTechCon). https://doi.org/10.1109/smarttechcon.2017.8358395.
ALhussieny, Yahya Ali. 2017. “Using MATLAB to Get the Best Performance with Different Type
Median Filter on the Resolution Picture.” International Journal of Computing, Communication and
Instrumentation Engineering. https://doi.org/10.15242/ijccie.iae0317007.
Cunitz, Bryan, Michael Bailey, Barbrina Dunmire, Marla Paun, Oleg Sapozhnikov, John Kucewicz,
Ryan Hsi, Franklin Lee, Matthew Sorensen, and Jonathan Harper. 2014. “Improved Detection of
Kidney Stones Using an Optimized Doppler Imaging Sequence.” 2014 IEEE International
Ultrasonics Symposium. https://doi.org/10.1109/ultsym.2014.0112.
Ebrahimi, Saman, Institute of Computer Science, University of the Philippines Los Baños, Laguna,
Philippines, and Vladimir Y. Mariano. 2015. “Image Quality Improvement in Kidney Stone
Detection on Computed Tomography Images.” Journal of Image and Graphics.
https://doi.org/10.18178/joig.3.1.40-46.
Ezhilarasan, Devaraj, Velluru S. Apoorva, and Nandhigam Ashok Vardhan. 2019. “Syzygium
Cumini Extract Induced Reactive Oxygen Species-Mediated Apoptosis in Human Oral Squamous
ISSN: 2237-0722 1108
Vol. 11 No. 4 (2021)
Received: 16.05.2021 – Accepted: 08.06.2021Carcinoma Cells.” Journal of Oral Pathology & Medicine: Official Publication of the International Association of Oral Pathologists and the American Academy of Oral Pathology 48 (2): 115–21. Gheena, S., and D. Ezhilarasan. 2019. “Syringic Acid Triggers Reactive Oxygen Species-Mediated Cytotoxicity in HepG2 Cells.” Human & Experimental Toxicology 38 (6): 694–702. Gonzalez, Rafael C., Richard E. Woods, and Barry R. Masters. 2009. “Digital Image Processing, Third Edition.” Journal of Biomedical Optics. https://doi.org/10.1117/1.3115362. Hafizah, Wan Mahani, and Eko Supriyanto. 2011. “Comparative Evaluation of Ultrasound Kidney Image Enhancement Techniques.” International Journal of Computer Applications. https://doi.org/10.5120/2524-3432. Hansen, M., and Bin Yu. 2000. “Wavelet Thresholding via MDL for Natural Images.” IEEE Transactions on Information Theory. https://doi.org/10.1109/18.857790. Heygster, Georg. 1982. “Rank Filters in Digital Image Processing.” Computer Graphics and Image Processing. https://doi.org/10.1016/0146-664x(82)90105-8. Jain, Anil K. 2005. Fundamentals of Digital Image Processing. Jose, Jerry, Ajitha, and Haripriya Subbaiyan. 2020. “Different Treatment Modalities Followed by Dental Practitioners for Ellis Class 2 Fracture – A Questionnaire-Based Survey.” The Open Dentistry Journal 14 (1): 59–65. Kane, Sean P., Phar, and BCPS. n.d. “Sample Size Calculator.” Accessed March 25, 2021. https://clincalc.com/stats/samplesize.aspx. Karthick, N. 2019. “A Review on Brain Tumour Detection Using Magnetic Resonance Imaging.” International Journal for Research in Applied Science and Engineering Technology. https://doi.org/10.22214/ijraset.2019.10020. Ke, Yang, Mohammed Saleh Al Aboody, Wael Alturaiki, Suliman A. Alsagaby, Faiz Abdulaziz Alfaiz, Vishnu Priya Veeraraghavan, and Suresh Mickymaray. 2019. “Photosynthesized Gold Nanoparticles from Catharanthus Roseus Induces Caspase-Mediated Apoptosis in Cervical Cancer Cells (HeLa).” Artificial Cells, Nanomedicine, and Biotechnology 47 (1): 1938–46. Krishnaswamy, Haribabu, Sivaprakash Muthukrishnan, Sathish Thanikodi, Godwin Arockiaraj Antony, and Vijayan Venkatraman. 2020. “Investigation of Air Conditioning Temperature Variation by Modifying the Structure of Passenger Car Using Computational Fluid Dynamics.” Thermal Science 24 (1 Part B): 495–98. Malalla, Nuhad, Pengfei Sun, Ying Chen, Michael E. Lipkin, Glenn M. Preminger, and Jun Qin. 2015. “Preliminary Study on C-Arm Technique for Nephrolithiasis and Kidney Stones Detection.” 2015 IEEE International Conference on Bioinformatics and Biomedicine (BIBM). https://doi.org/10.1109/bibm.2015.7359960. Malli Sureshbabu, Nivedhitha, Kathiravan Selvarasu, Jayanth Kumar V, Mahalakshmi Nandakumar, and Deepak Selvam. 2019. “Concentrated Growth Factors as an Ingenious Biomaterial in Regeneration of Bony Defects after Periapical Surgery: A Report of Two Cases.” Case Reports in Dentistry 2019 (January): 7046203. Maragos, Petros. 2005. “Morphological Filtering for Image Enhancement and Feature Detection.” Handbook of Image and Video Processing. https://doi.org/10.1016/b978-012119792-6/50072-3. Mathew, M. G., S. R. Samuel, A. J. Soni, and K. B. Roopa. 2020. “Evaluation of Adhesion of Streptococcus Mutans, Plaque Accumulation on Zirconia and Stainless Steel Crowns, and ISSN: 2237-0722 1109 Vol. 11 No. 4 (2021) Received: 16.05.2021 – Accepted: 08.06.2021
Surrounding Gingival Inflammation in Primary ….”                 Clinical   Oral   Investigations.
https://link.springer.com/article/10.1007/s00784-020-03204-9.
Mehta, Meenu, Deeksha, Devesh Tewari, Gaurav Gupta, Rajendra Awasthi, Harjeet Singh, Parijat
Pandey, et al. 2019. “Oligonucleotide Therapy: An Emerging Focus Area for Drug Delivery in
Chronic Inflammatory Respiratory Diseases.” Chemico-Biological Interactions 308 (August): 206–
15.
Muthukrishnan, Sivaprakash, Haribabu Krishnaswamy, Sathish Thanikodi, Dinesh Sundaresan, and
Vijayan Venkatraman. 2020. “Support Vector Machine for Modelling and Simulation of Heat
Exchangers.” Thermal Science 24 (1 Part B): 499–503.
Pc, J., T. Marimuthu, and P. Devadoss. 2018. “Prevalence and Measurement of Anterior Loop of the
Mandibular Canal Using CBCT: A Cross Sectional Study.” Clinical Implant Dentistry and Related
Research. https://europepmc.org/article/med/29624863.
Rahman, Tanzila, and Mohammad Shorif Uddin. 2013. “Speckle Noise Reduction and Segmentation
of Kidney Regions from Ultrasound Image.” 2013 International Conference on Informatics,
Electronics and Vision (ICIEV). https://doi.org/10.1109/iciev.2013.6572601.
Raja, K. Bommanna, K. Bommanna Raja, M. Madheswaran, and K. Thyagarajah. 2007. “Analysis of
Ultrasound Kidney Images Using Content Descriptive Multiple Features for Disorder Identification
and ANN Based Classification.” 2007 International Conference on Computing: Theory and
Applications (ICCTA’07). https://doi.org/10.1109/iccta.2007.31.
Ramadurai, Neeraja, Deepa Gurunathan, A. Victor Samuel, Emg Subramanian, and Steven J. L.
Rodrigues. 2019. “Effectiveness of 2% Articaine as an Anesthetic Agent in Children: Randomized
Controlled Trial.” Clinical Oral Investigations 23 (9): 3543–50.
Ramesh, Asha, Sheeja Varghese, Nadathur D. Jayakumar, and Sankari Malaiappan. 2018.
“Comparative Estimation of Sulfiredoxin Levels between Chronic Periodontitis and Healthy Patients
- A Case-Control Study.” Journal of Periodontology 89 (10): 1241–48.
Ranjitha, M. 2019. “Segmentation of Ultrasound Abdominal Images to Extract Region of Interest.”
International Journal of Recent Technology and Engineering.
https://doi.org/10.35940/ijrte.b2469.078219.
Rathi, V. P. Gladis Pushpa, V. Gladis Pushpa, and S. Palani. 2011. “Detection and Characterization
of Brain Tumor Using Segmentation Based on HSOM, Wavelet Packet Feature Spaces and ANN.”
2011      3rd      International    Conference   on     Electronics     Computer     Technology.
https://doi.org/10.1109/icectech.2011.5942097.
Sadeghi, Mostafa, Masoud Shafiee, Faezeh Memarzadeh-zavareh, and Hossein Shafieirad. 2012. “A
New Method for the Diagnosis of Urinary Tract Stone in Radiographs with Image Processing.”
Proceedings of 2012 2nd International Conference on Computer Science and Network Technology.
https://doi.org/10.1109/iccsnt.2012.6526364.
Samuel, Melvin S., Jayanta Bhattacharya, Sankalp Raj, Needhidasan Santhanam, Hemant Singh, and
N. D. Pradeep Singh. 2019. “Efficient Removal of Chromium(VI) from Aqueous Solution Using
Chitosan Grafted Graphene Oxide (CS-GO) Nanocomposite.” International Journal of Biological
Macromolecules 121 (January): 285–92.
Samuel, Srinivasan Raj, Shashidhar Acharya, and Jeevika Chandrasekar Rao. 2020. “School
Interventions-Based Prevention of Early-Childhood Caries among 3-5-Year-Old Children from Very

ISSN: 2237-0722                                                                               1110
Vol. 11 No. 4 (2021)
Received: 16.05.2021 – Accepted: 08.06.2021
Low Socioeconomic Status: Two-Year Randomized Trial.” Journal of Public Health Dentistry 80
(1): 51–60.
Sathish, T., and S. Karthick. 2020. “Wear Behaviour Analysis on Aluminium Alloy 7050 with
Reinforced SiC through Taguchi Approach.” Journal of Japan Research Institute for Advanced
Copper-Base Materials and Technologies 9 (3): 3481–87.
Sharma, Parvarish, Meenu Mehta, Daljeet Singh Dhanjal, Simran Kaur, Gaurav Gupta, Harjeet
Singh, Lakshmi Thangavelu, et al. 2019. “Emerging Trends in the Novel Drug Delivery Approaches
for the Treatment of Lung Cancer.” Chemico-Biological Interactions 309 (August): 108720.
Sridharan, Gokul, Pratibha Ramani, Sangeeta Patankar, and Rajagopalan Vijayaraghavan. 2019.
“Evaluation of Salivary Metabolomics in Oral Leukoplakia and Oral Squamous Cell Carcinoma.”
Journal of Oral Pathology & Medicine: Official Publication of the International Association of Oral
Pathologists and the American Academy of Oral Pathology 48 (4): 299–306.
Varghese, Sheeja Saji, Asha Ramesh, and Deepak Nallaswamy Veeraiyan. 2019. “Blended Module-
Based Teaching in Biostatistics and Research Methodology: A Retrospective Study with
Postgraduate Dental Students.” Journal of Dental Education 83 (4): 445–50.
Venu, Harish, V. Dhana Raju, and Lingesan Subramani. 2019. “Combined Effect of Influence of
Nano Additives, Combustion Chamber Geometry and Injection Timing in a DI Diesel Engine Fuelled
with Ternary (diesel-Biodiesel-Ethanol) Blends.” Energy 174 (May): 386–406.
Venu, Harish, Lingesan Subramani, and V. Dhana Raju. 2019. “Emission Reduction in a DI Diesel
Engine Using Exhaust Gas Recirculation (EGR) of Palm Biodiesel Blended with TiO2 Nano
Additives.” Renewable Energy 140 (September): 245–63.
Vignesh, R., Ditto Sharmin, C. Vishnu Rekha, Sankar Annamalai, and Parisa Norouzi Baghkomeh.
2019. “Management of Complicated Crown-Root Fracture by Extra-Oral Fragment Reattachment and
Intentional Reimplantation with 2 Years Review.” Contemporary Clinical Dentistry 10 (2): 397–401.
Vijayakumar Jain, S., M. R. Muthusekhar, M. F. Baig, P. Senthilnathan, S. Loganathan, P. U. Abdul
Wahab, M. Madhulakshmi, and Yogaen Vohra. 2019. “Evaluation of Three-Dimensional Changes in
Pharyngeal Airway Following Isolated Lefort One Osteotomy for the Correction of Vertical
Maxillary Excess: A Prospective Study.” Journal of Maxillofacial and Oral Surgery 18 (1): 139–46.
Vijayashree Priyadharsini, Jayaseelan. 2019. “In Silico Validation of the Non-Antibiotic Drugs
Acetaminophen and Ibuprofen as Antibacterial Agents against Red Complex Pathogens.” Journal of
Periodontology 90 (12): 1441–48.
Viswanath, K., and R. Gunasundari. 2016. “VLSI Implementation and Analysis of Kidney Stone
Detection from Ultrasound Image by Level Set Segmentation and MLP-BP ANN Classification.”
Advances in Intelligent Systems and Computing. https://doi.org/10.1007/978-81-322-2656-7_19.
Wang, Jianxiong, Jiwen Liu, Yaohui Li, and Yulan Wang. 2012. “Improved Median Filtering
Denoising Algorithm and Analysis.” IET International Conference on Information Science and
Control Engineering 2012 (ICISCE 2012). https://doi.org/10.1049/cp.2012.2461.
Wu, Chia-Hsiang, and Yung-Nien Sun. n.d. “A Texture Analysis Approach for Kidney Boundary
Detection from Ultrasonic Images.” Proceedings of the First Joint BMES/EMBS Conference. 1999
IEEE Engineering in Medicine and Biology 21st Annual Conference and the 1999 Annual Fall
Meeting       of     the    Biomedical     Engineering    Society    (Cat.  No.99CH37015).
https://doi.org/10.1109/iembs.1999.804303.

ISSN: 2237-0722                                                                               1111
Vol. 11 No. 4 (2021)
Received: 16.05.2021 – Accepted: 08.06.2021
You can also read