Conformance Checking Challenge 2019: Analysis of Central Venous Catheter Installation with MEHRWERK ProcessMining
←
→
Page content transcription
If your browser does not render page correctly, please read the page content below
Conformance Checking Challenge 2019:
Analysis of Central Venous Catheter Installation
      with MEHRWERK ProcessMining

      Janna Meyer1,2 , Josua Reimold1,3 , and Constantin Wehmschulte1,4
        1
            Mehrwerk AG, Karlsruher Strasse 88, 76139 Karlsruhe, Germany
                          2
                             janna.meyer@mehrwerk-ag.de
                        3
                            josua.reimold@mehrwerk-ag.de
                   4
                     constantin.wehmschulte@mehrwerk-ag.de

      Abstract. In the discipline of process mining, the area of conformance
      checking promises large contributions to process analysis and business
      intelligence. The 1st Conformance Checking Challenge 2019 (CCC19)
      offers an opportunity to apply innovative techniques onto real-world pro-
      cess data. We analyze a process of central venous catheter installation
      with ultrasound for which data were collected as part of the multidisci-
      plinary research project ’Process-Oriented Medical Education (POME)’
      conducted by the School of Medicine and the School of Engineering of the
      Pontificia Universidad Catlica de Chile. As the data reflect the progress
      of students during a university course, we particularly analyze the t-
      wo process perspectives of the instructor and the participating students.
      Taking the students’ perspectives, we identify their mistakes to elaborate
      suggestions for improvement that contribute to their learning process.
      To support the instructor in his teaching, an aggregation of the overall
      process performance is derived to spot common mistakes in the group’s
      performance. Mistakes are analyzed in the overall context but also in
      their subprocess’s context to identify which part of the process seem-
      s to be difficult for students. The conformance checking results as well
      as the overall students’ performance are captured in easy-to-understand
      dashboards to provide feedback tailored to each stakeholder.

      Keywords: Conformance Checking · Process Mining · CCC2019 ·
      ICPM2019 · MEHRWERK ProcessMining (MPM).

1   Introduction

The 1st Conformance Checking Challenge 2019 (CCC19) invites us to analyze
a real medical training process regarding its conformance between the observed
(event log) and expected behavior (model) [1]. Hereby, we are capable to present
the contributions conformance checking techniques can already make to process
analysis. Furthermore, we can demonstrate the conformance checking function-
alities of our software MEHRWERK ProcessMining (MPM). To provide the
process owners with interpretable and understandable conformance results we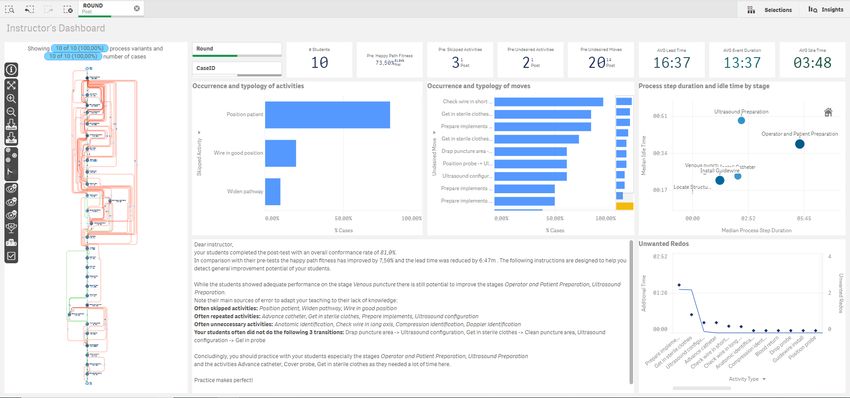
2       J.Meyer et al.

develop a report that covers a broad range of aspects for both stakeholders’ per-
spectives (students and instructor). We aim for holistic analysis and usefulness
for the purpose of a real-life process improvement.

1.1   Approach
To derive useful insights from the data we will follow the approach stated below:
 1. Data understanding: through the MPM Process Discovery Algorithm we get
    a first impression on the process data, on sub-processes, on event duration
    and on process lead- and process idle times.
 2. Data pre-processing: analyzing the time-related metrics, we detect outliers
    that will be corrected.
 3. Aligning the process instances with the process model: with MPM Confor-
    mance Checking Algorithm we compute the alignment of event log and pro-
    cess model.
 4. Analysis: to cover both the instructor’s and students’ perspectives, we con-
    struct dashboards on aggregated and detailed level that provide insights to
    the stakeholders. Using the dashboards as entry point, we dive deeper in the
    analysis with further visualizations.
 5. Interpreting results:
      – To support the instructor in his teaching, common mistakes and simi-
         larities in the group’s performance are spotted.
      – Taking the students’ perspectives, we identify their peculiar mistakes to
         elaborate suggestions for improvement that contribute to their learning
         process.
      – The improvement during the course is analyzed to show the instructor
         and the students where additional training was helpful and where more
         additional training is recommendable.
    The following paper is structured as follows: we briefly explain our under-
standing of conformance checking (section 1.2) and the tool MPM (section 2.1)
that we are using in this paper. Then we comprehend the process and the data
(see section 2.2) and preprocess them (section 2.3). In the last part one finds the
actual process analysis (section 3) and a conclusion (section 4).

1.2   Preliminaries - Conformance Checking
In the discipline of process mining, according to van Dongen, “conformance
checking is considered to be anything where observed behaviour needs to be
related to already modelled behaviour” [2]. In general, the technique can be
used to compute metrics that quantify the deviation between a log and a model.
Alignment-based conformance checking employs alignments to depict the rela-
tion between a process sequence in an event log and a process sequence of a
model [2]. For each real-life process variant, its’ sequence of activities (nodes in
a graph) and moves (transition from one activity to another, displayed as edge
in a graph) is compared to the process model’s sequences. Activities and moves
are: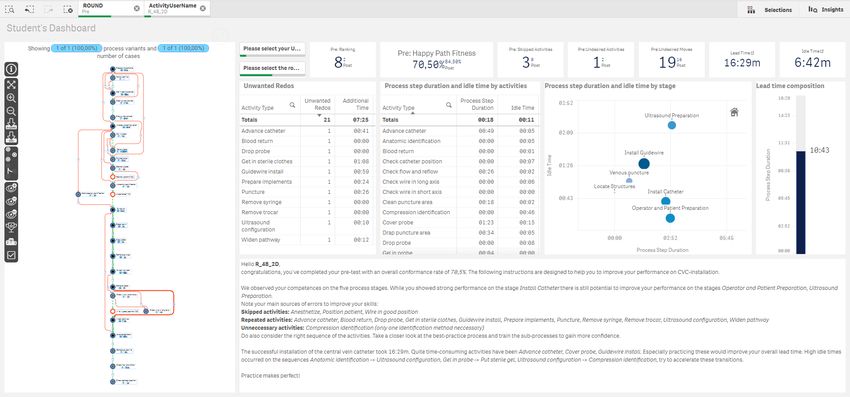
Analysis of Central Venous Catheter Installation with MPM          3

 – either synchronous, referring to the fact that the observed behaviour corre-
   sponds directly to a possible behaviour in the model,
 – or in log, which means that the observed behaviour can not be found in the
   model,
 – or in model showing that this part of modelled behaviour has not occurred
   in the event log.

    For better understandability we will refer to activity/move in log as unde-
sired activity/move, to activity/move in model as skipped activity/move and to
synchronous activity/move as correct activity/move. To clarify another concept
we use later, we shortly define the following: by lead time we refer to the time
from case start until case end, by process step duration we refer to the actual
time consumed to fulfill an activity and by idle time we refer to the time passing
by between the end of one and the start of the directly following activity, some
call this transition time. Consequently, process step duration and idle time sum
up to the lead time. As this paper’s purpose is to apply conformance checking
on real-life use cases, we will not go deeper in the explanations on conformance
checking, the interested reader can find more detailed explanation on the topic
and state-of-the-art algorithms in [3].

2     The Use-Case

2.1   Tool: MEHRWERK ProcessMining

MEHRWERK ProcessMining (MPM), deployed on the Qlik Sense R platform, is
designed to offer comprehensive analytics to the process analyst. MPM combines
self-service business intelligence, visual and associative analytics with the insights
achieved by process mining algorithms, so that even non-experts find answers
rapidly. Regarding conformance checking, MPM offers various functionalities:
with the MPM ProcessModeler the user is able to define a happy path via drag
and drop which will be displayed in the process visualization by coloring the
happy path green and deviating behavior red. As a process model is delivered
in this use-case, we will not apply this function, but if process models are not
provided, it allows to rapidly investigate process deviations on-demand in an
intuitive manner without scripting. Similarly easy to understand is the process
query offered by MPM where the analyst creates a process sequence including
wildcards that searches for matching process variants and displays them in the
process analyzer (see figure 6). Hence, it is done with ease to find and investigate
certain process behavior.
    To achieve further insights on process deviations, MPM offers an alignment-
based conformance checking approach that detects the closest start to end se-
quence in a model for each process variant. The algorithm evaluates activities
and moves in model or log as well as synchronous activities or moves. With
these information a fitness metric Happy Path Fitness indicating the most fit-
ting model path for each real-life process variant is computed. This fitness metric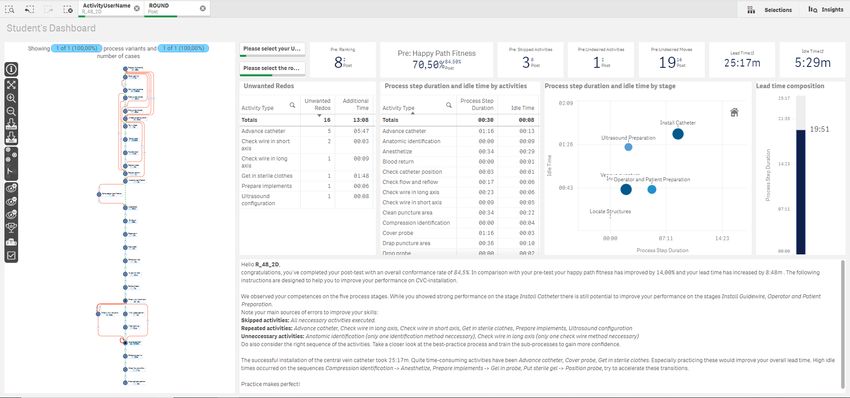
4       J.Meyer et al.

is displayed as a percentage and supports the analyst in rapidly identifying high-
ly deviating process variants, e.g. a process variant may have a fitness of 80% to
its aligned happy path. Our fitness metric calculation can be adapted to specific
process requirements. For the example process in this study, we decided that
a correct activity set of a process is more important than the correct order of
all activities. Therefore, skipping activities are more strongly sanctioned than
deviating from the correct order.

2.2   Process Data

This 1st Conformance Checking Challenge provides data of a real-life Central
Venous Catheter (CVC) installation training of medical students [4]. The CVC is
used for delivering liquids, fluids or medicines to patients. The should-be process
of the procedure can be found in the BPMN model shown in figure 1.

    Fig. 1: The BPMN model of Central Venous Catheter (CVC) installation

    The following presents the verbal description of the CVC installation accord-
ing to [4]: First, the implements are prepared, the hands are washed, and the
doctor gets in sterile clothes. The doctor cleans the puncture area and draps
the zone. Then he configures the ultrasound and puts gel in the probe. Then,
he covers the probe and puts the sterile gel. The doctor positions the probe
and positions the patient. The vein is identified using anatomic identification,
doppler identification, or compression identification. The patient is anesthetized
and punctured. The blood return is checked. If the blood return is not correct,
the doctor goes back to the puncture step. If the blood return is correct, the
probe is dropped, and the syringe is removed. The guidewire is installed, and
the trocar removed. Then the wire is checked using a check of the wire in the long
axis, or the short axis. Then, the doctor checks if the wire is in good position.
If the wire is not in the good position, the doctor goes back to the puncture
step. If the wire is in the good position, the pathway is widened, the catheter
is advanced, and the guidewire is removed. Finally, the doctor verifies the flow
and the reflow, and the catheter position is checked. The process is divided in
six sub-processes, as can be seen in figure 1: operator and patient preparation,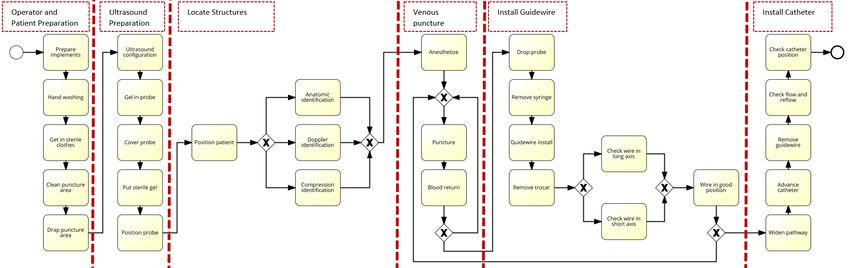
Analysis of Central Venous Catheter Installation with MPM         5

ultrasound preparation, locate structures, venous puncture, install guidewire and
install catheter. To train students, they are firstly taught by their instructors,
then they take a first preliminary test (pre-round) after which they can practice
on their own. A second final post assessment (post-round) is taken to show if
they have acquired the skills to install a CVC during the course. [1]
    Ten students have been filmed during the pre- and post-test, leading to 20
different process instances. The event log provided was created by tagging the
activities in the videos and then deriving their timestamps, hence, noise is present
in the data set. The event log consists of 697 events and, after performing process
discovery to get first insights in the process data, we detect 20 different process
variants for the 20 cases.

2.3   Data Pre-Processing

   (a) Cases by lead time in hours before preprocessing.   (b) Boxplot of lead time
                                                           distribution.

                      Fig. 2: Outlier detection by lead time.

    Visualizing the data and the cases’ lead time presented five outliers: in fig-
ure 2a we ordered the cases by lead time and found five cases with very high
values. These are statistically signifcant outliers because their lead times are
above the upper whisker in the boxplot shown in figure 2b. We then investi-
gated the log in detail and found the specific errors. These are listed in table
1. For case 1547683734202-video 1.c CVC the date of the activity timestamps
suddenly changed from 16.01. to 17.01. while the hour seems correct. For the
other four cases in table 1 the timestamps were shifted by one hour for the rest
of the process. The extra hour occurred always between two events, increasing
the idle time between them to an unreasonable duration. We decided to correct
the data, otherwise we would have lost 25% of the cases for analysis. We also
decided against interpolating the times, because the shift by 1 day or 1 hour
seemed reasonable to us, as the events were tagged manually in the videos. We
assume that this is part of the noise mentioned in the challenge’s description
and felt free to alter the timestamps of these five cases. To correct the data we
manually shifted the time back to the hour (or the day) of the previous events.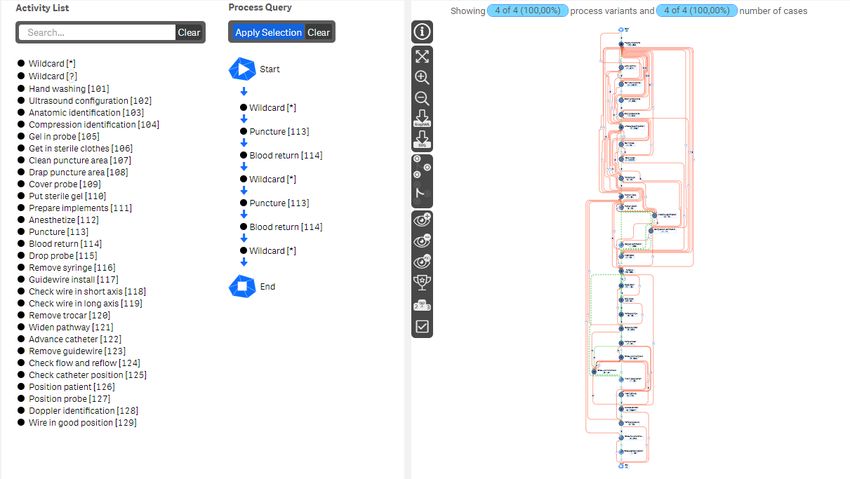
6 J.Meyer et al.
Table 1: Detected outliers and their manual correction
Case ID Activity End Succeding Succeding Correction
timestamp Activity start
timestamp
1547683734202- Position 1/16/2019 Ultrasound 1/17/2019 Date set back
video 1.c CVC probe 1:09:40 configura- 1:09:48 to 16th Jan.
tion
1539314415211- Drop 10/12/2018 Puncture 10/12/2018 Hour set back
video 2.1 CVC probe 2:16:41 3:17:00 to 2 for follow-
ing events
1539832275246- Clean 10/18/2018 Drap punc- 10/18/2018 Hour set back
video 4.8 CVC puncture 2:02:52 ture area 3:02:57 to 2...
area
1539316889981- Widen 10/12/2018 Advance 10/12/2018 Hour set back
video 3.1 CVC pathway 3:31:22 catheter 4:31:23 to 3...
1539734942389- Prepare 10/16/2018 Position 10/17/2018 Hour set back
video 3.2 CVC imple- 23:15:20 probe 0:15:28 to 23...
ments
3 Results
We were asked to analyze the process from different stakeholders’ perspectives.
Hence, we divided this chapter into two parts. At first, we will present the process
insights on an aggregated level which corresponds to the instructor’s perspective.
Then we will focus on one specific student who stood out from the others by
being the only one increasing instead of reducing his lead time while at the same
time improving strongly on his happy path fitness.
3.1 Instructor’s Perspective
The course’s instructor would be interested in detecting typical mistakes of his
students to focus the teaching process on the most critical process stages. To
give a concise entry point for the analysis from the instructor’s point of view we
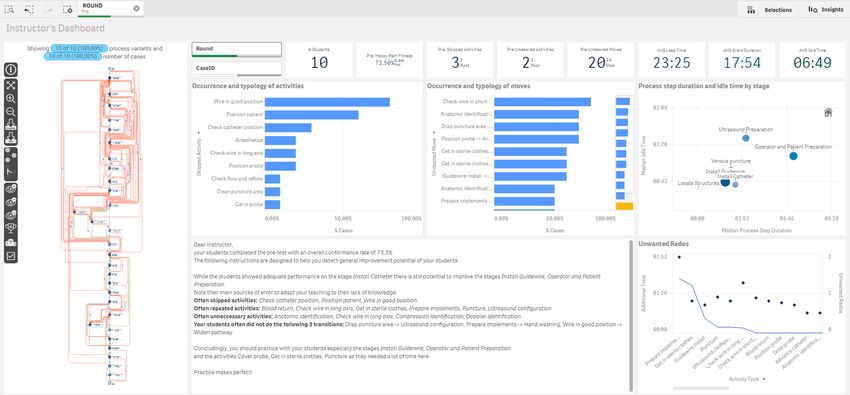
created a dashboard for him (see figure 3 and 9). We consider the lead time and
the correct execution of the process as crucial to successful CVC installation.
Therefore, the focus of the dashboard is on skipped activities, undesired moves,
reworked activities and the process times by stage. The KPIs at the top of the
dashboard capture the students performance and improvement from pre to post:
lead-, process- and idle time are represented as well as the happy path fitness and
the number of undesired/skipped activities/moves calculated for the pre- and the
post-round. At the left side, the processes are shown by the given round with
the process deviations colored in red. For a specific explanation of the process
visualization please see figure 14. The other four diagrams on the dashboard will
be explained and analyzed in the following report. The dashboard gives a short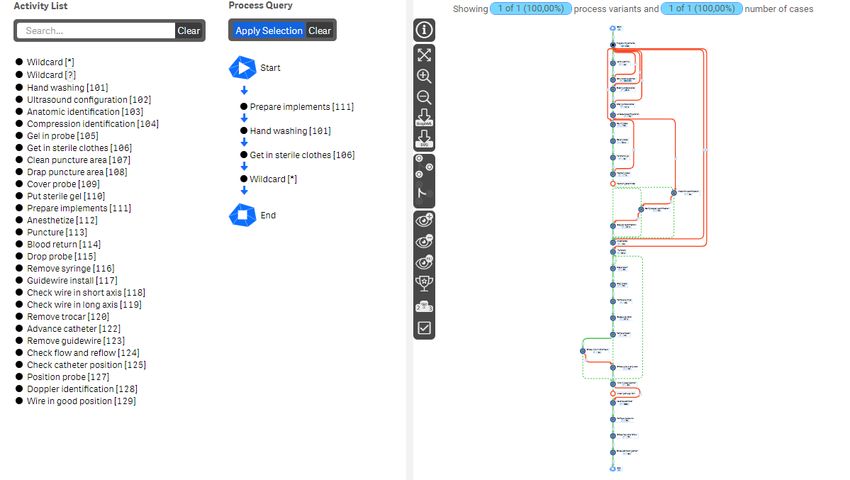
Analysis of Central Venous Catheter Installation with MPM         7

verbal summary at the bottom to present the most significant behavior and hint
on stages that need to be explained better.
    To give a report for the instructor we will, firstly, generate general insights
in common mistakes and probable reasons for high process lead times in the
pre-round. Then, we will derive recommendations for the instructor on where
to focus his teaching to prepare the students best for their final test. Having
the post-round process data, we will evaluate the improvements the students
achieved in the post-round and, finally, we give a short conclusion what can be
learned for the next course from the results.

Process diagnosis in the pre-round For the pre-round we can state that the
students have deviated strongly from the process model: there are a lot of red
lines (marking undesired moves) in the process visualization of figure 3, showing
clearly the large number of undesired moves. Having this first impression we will
start analyzing the process conformance and then use the achieved insights to
further analyze process times and reworked activities.

Process conformance: A large part of the red lines occurred in the stages oper-
ator and patient preparation, ultrasound configuration and locate structures. As
undesired moves are caused by either skipped or undesired activities or wrong
ordering of the process, we will at first focus the analysis on this topic. We see
in Occurrence and typology of activities in figure 3, the activities that often have
been skipped in the pre-round were wire in good position and position patient. It
might be, as these are rather invisible activities in a process, that they haven’t
been tagged correctly in the video. But, if these missing activities are not caused
by an event log generation error, the students should be made aware not to forget
these steps again. Furthermore, the instructor should notice that three of his s-
tudents have not checked the catheter position and two of them have forgotten to
anesthetize their patient. These are severe errors, that would cause large damage
in real CVC installations. Additionally, two students have not checked the wire,
two did not position their probe and one forgot to check the flow and reflow. It
seems, for these large list of skipped steps, as if some students do not memorize
the single process steps of the stages ultrasound configuration, install guidewire
or install catheter well and should work on these specific process stages.
    The top ten undesired moves performed by the students in the pre-round are,
all but one, part of the first three process stages (see the bar chart Occurrence
and typology of moves in figure 3). Only the move remove trocar - widen pathway
occurred in a later stage. We conclude from this that the students did not take the
preparation steps very seriously and/or miss a lot of routine in these basic process
steps. With an average of 20 undesired moves and two skipped activities the
students often deviated from the process sequence. The top undesired activities
are all part of the vein identification or the checking wire step (see figure 4a).
These probably occur because the students did not feel confident enough to trust
on one method.
8
                                                                                                                            J.Meyer et al.
Fig. 3: This dashboard is generated for the instructor to give an overview on the students’ performance in the pre-round.
Analysis of Central Venous Catheter Installation with MPM          9

          (a) Undesired (redundant) activities performed by the students.

      (b) Skipped moves (changed activity order) performed by the students.

Fig. 4: Deviating behaviour detected in the pre-round ordered by occurrence.

    For their lack of routine, the students often changed the ordering of activities.
Hence, in figure 4b we analyzed the top five of these changed activity sequences:
no student started the ultrasound configuration after draping the puncture area.
Just one understood to wash his hands after preparing the implements and one
went directly from knowing the wire’s good position to widening the pathway.
Eight students did neither realize the anesthetization after the anatomic identi-
fication nor did eight students reach the state wire in good position directly from
checking the short axis – probably they double checked in both situations.
    By looking at figure 3, we know that one third of the students did not finish
their process by checking the catheter position. It is interesting for the instructor
to understand, if these students have not installed the catheter successfully at all
or how they completed the process otherwise. By filtering on cases that do not
stop with the desired activity, we infer that one student finished by removing
the guidewire, one by checking the flow and reflow, and one by advancing the
catheter. The first student installed the catheter after some complications but
did not make sure that the catheter was positioned well. The second student
forgot to check the flow and reflow. The third student who stopped by advancing
the catheter was probably not successful as he repeated the process of catheter
installation and then broke up before removing the guidewire. Thus, we conclude
as before: the instructor should secure that his students pay more attention to
checking operations.
10 J.Meyer et al. Fig. 5: Process stages by idle time and event duration (in minutes). Size and color depend on the number of activities belonging to the stage. Darker and larger equals more activities. Fig. 6: MPM QueryBuilder - repetition of puncture to blood return. The MPM query function allows process queries via drag and drop. To show the instruc- tor how many students repeated the sequence puncture to blood return, the left query filters the visualization on the right. Four students in the pre-round were detected.
Analysis of Central Venous Catheter Installation with MPM        11

Process time and rework analysis: According to figure 5 the most time consum-
ing stage regarding the process step duration is Operator and patient preparation
with 6:11 minutes. The idle time is also high with 1:13 minutes. These rather
basic process steps consume an unconvenient amount of time as can be clearly
seen in figure 7a. The stage with the highest idle time of 2:03 minutes was ul-
trasound preparation, furthermore, the sum of event durations was pretty high
with 3:17 minutes. The high overall event duration was mainly caused due to the
average of 1:54 minutes needed to complete the event cover probe while the large
idle time is based on the move from cover probe to put in sterile gel. This can
be seen in the process visualization in figure 7b. Also, interesting in figure 7b is
the high number of occurence of the activity ultrasound configuration. Ten stu-
dents performed this activity 18 times, so a further analysis might be interesting:
in figure 8a we see that all, except for three students reworked the ultrasound
configuration at least one time which causes unneccessary extra time. The in-
structor might be interested in other repetitions as well, so we created figure 8b
that demonstrates all activity repetitions occurring in the pre-round. We notice
an overall high repetition for the activities prepare implements and get in sterile
clothes. How many students have repeated these and other activities can be seen
in table 2. To present how the instructor can rapidly find interesting process se-
quences, we analyzed processes carrying out a multiple puncture sequence with
the MPM QueryBuilder. As a result we can see in figure 6 that four students in
the pre-round had to re-do the venous puncture.

    Table 2: Number of students repeating activities in round pre and post
 Stage                     Repeated Activity          #Cases (pre) #Cases (post)
 Operator and patient prep Get in sterile clothes         8             9
 Operator and patient prep Prepare implements             8            10
 Ultrasound prep           Ultrasound configuration       7             5
 Install guidewire         Guidewire install              6             1
 Venous puncture           Blood return                   4             1
 Install guidewire         Drop probe                     5             1
 Venous puncture           Puncture                       5             1
 Install guidewire         Remove syringe                 5             1
 Install catheter          Advance catheter               4             1
 Install guidewire         Check wire in long axis        4             3
 Ultrasound prep           Position probe                 4             1
 Locate structures         Anatomic identification        3             1
 Install guidewire         Check wire in short axis       3             2
 Install guidewire         Remove trocar                  3             1
 Operator and patient prep Hand washing                   2             -
 Ultrasound prep           Put sterile gel                2             -
 Install catheter          Widen pathway                  2             -
 Venous puncture           Anesthetize                    1             -
 Locate structures         Compression identification     1             1
 Install catheter          Remove guidewire               1             -
12 J.Meyer et al.
Prepare implements[111]
Hand washing[101]
Get in sterile clothes[106]
27s 5s Clean puncture area[107]
0s Drap puncture area[108] 16s 47s
Ultrasound configuration
18 37s 38s
Prepare implements 0s 6s 32s
29 40s
Gel in probe
5s 9 4s
6s 4s
2s 10s 0s
Hand washing
12 21s 7s 1s
Cover probe
0s 17s 10 1:54m 1:45m
2s 2s 2s 6s
Get in sterile clothes 9s 27s 2s 17s
18 1:17m 4s 7s
Put sterile gel
5s 7s 15s 12 7s
Clean puncture area
17s 9 29s 11s 7s
1:35m 9s
17s 0s 6s 5s 0s
Position probe
14 0s 35s
Drap puncture area
7s 8s 10 34s
(a) Stage operator and patient prepara-
Ultrasound configuration[102]
(b) Stage ultrasound configuration.8s
Position patient[126]
32s
tion.
Gel in probe[105] 15sCompression identification[104] Doppler identification[128] Anatomic identification[103] 12s 15s
Fig. 7: The graphs show isolated stages of the pre-round process. The first num-
ber in the nodes
Cover is the frequency, while the second is the average process step
probe[109]
Anesthetize[112]
duration. The durations at the edges represent the idle times.
Put sterile gel[110]
Puncture[113]
Position probe[127]
Blood return[114]
Position patient[126]
Anatomic identification[103] Doppler identification[128] Compression identification[104] Drop probe[115]
Anesthetize[112]
Puncture[113]Analysis of Central Venous Catheter Installation with MPM 13
(a) Repetitions of ultrasound configuration and added process duration per student.
(b) Average repetitions for each activity and average added process duration.
Fig. 8: Repetitions and their additional process step duration.14
J.Meyer et al.
Fig. 9: The instructor’s dashboard for the post-round.Analysis of Central Venous Catheter Installation with MPM 15
Recommendations for the instructor: As the students completed the pre-round
with an average of 73.5% there is large potential for improving their performance.
Especially in the stages operator and patient preparation and install guidewire
the students deviated highly from the process model. Their main errors were
skipping the activities wire in good position, position patient and check catheter
position. Additionally, they did a lot of rework in the activities prepare imple-
ments, get in sterile clothes, blood return, and check wire in long axis. The latter
might be caused due to not trusting in their own skills or in only one checking
method. As critical, we perceive that 40% of the students did not hit the vein
in the first try and needed to return to venous puncture. Furthermore, students
seldomly went from draping the puncture area directly to configuring the ultra-
sound. When the wire was found to be in a good position the students did not
conclude with widen pathway but other process steps. Also, hand washing was
rarely performed after preparing the implements. Summing up, some students
did not well memorize the single process steps of the stages ultrasound con-
figuration, install guidewire or install catheter and should be trained on these
specific process stages. Furthermore, they miss routine in the basic process step-
s of the preparation phase. As practice makes perfect the instructor probably
could help them best by re-explaining the overall process, putting emphasis on
the importance of doing the required checks and by motivating them to practice
on their own to gain more confidence.
General improvements achieved in post-round The students improved
their average happy path fitness by 7.5%. This time instead of the stage installing
guidewire, ultrasound preparation was more difficult. Figure 10a demonstrates
the reduced number of undesired moves for all but three participants. Similar
analysis can be made for skipped activities or undesired activities leading to the
result that the skipped activities dropped for each student (see also unwanted re-
dos in figure 9) and the undesired activities increased for only two of them. The
skipped activities in the post-round have been position patient (eight students),
widen pathway (one student) and wire in good position (two students). The check
of the catheter’s position that was missing in the pre-round has not been skipped
again. This can be seen in figure 9.
The most often repeated activities are again get in sterile clothes, and prepare
implements. New to the list is ultrasound configuration. The number of cases
with repeating activities in general dropped strongly, as can be seen in table 2.
Unnecessarily performed process steps did not change from pre- to post-round.
This might be excused by the students being more confident doing double-checks
with different methods to get a good result on puncturing the vein. Indeed, good
results were achieved because every student finished his process successfully, only
one did not finish with check catheter position because he switched the order of
the last two activities.
Regarding the process times figure 10b shows that the case lead time dropped
for all but one student. The average lead time dropped by 6:47 minutes. A
good overview on the statements we made is given in figure 11. It is noticeable16 J.Meyer et al.
that only two students were able to perform their process without skipping
an activity (as skipping activities in this kind of delicate process is dangerous,
we colored entries red for every student who skipped at least one). Comparing
the bubble charts of the pre- and post-dashboard in figure 3 and 9, one will
notice, that the idle time has reduced for all stages. While the process step
duration for ultrasound preparation and operator and patient preparation has
nearly not changed, the other stages, especially venous puncture, became faster.
The student, R 48 2D who did not improve his lead time from pre to post, has
improved his process conformance dramatically, so he might be a good example
for more detailed analysis. Therefore, in the next section Student’s Perspective
we will describe the insights R 48 2D can get from the conformance checking.
(a) Evolution of number of process steps.
(b) Lead time evolution in hours.
Fig. 10: Process evolution from pre to post for each student for different metrics.
All in all, the instructor was able to help his students improving. The core
parts of the process, namely the stages venous puncture, installing guidewire and
installing catheter have improved highly. Nevertheless, the preparation stages
could still be improved as those are quite red in the process visualization shown
in figure 9. In fact, by utilizing the MPM QueryBuilder mentioned in chapter 2.1Analysis of Central Venous Catheter Installation with MPM 17 we searched for students who begun the process according to the process model and found only one single student in the post-round. This result is displayed in figure 12. Even if this part of the process is not the most critical, some routine might speed up the process and boost the student’s self confidence. Fig. 11: Summary on the performance improvement from pre- to post-round. Fig. 12: MPM QueryBuilder result - students’ conformance with the start se- quence of the CVC installation process.
18
                                                              J.Meyer et al.
Fig. 13: The student R 48 2D’s dashboard for the pre-round.
Analysis of Central Venous Catheter Installation with MPM 19
3.2 Student’s perspective
As a student, one would be interested in discovering errors and specific improve-
ment potentials. Therefore, we designed a dashboard (see figure 13 and 15) that
serves as starting point for deeper analysis by giving an overview on missing
activities, undesired moves or activities, as well as the re-dos and the extra time
caused by them. For each activity and stage, the process step duration and the
idle time is presented which allows the student to rapidly find out where he lost
most time in the process. At the top of the dashboard are some KPIs to capture
the student’s performance and improvement from pre to post: a ranking shows
the student’s position within the course; lead-, process- and idle time are repre-
sented as well as the happy path fitness and the number of undesired/skipped
activities/moves is calculated for the pre- and the post-round. A message is de-
rived for the student where errors and hints of improvement are listed. At the
left, the process performed by the student is shown and process deviations are
marked clearly. For a specific explanation of the process visualization please see
figure 14.
The report we will give in the following is created for student R 48 2D’s
performance and can be seen as an example for every other student. The analysis
will be divided into two parts: the diagnosis on detailed process deviations in
the pre-round including improvement proposals and the diagnosis of actually
achieved improvements in the post-round.
Diagnosis of detailed process deviation in the pre-round In the pre-
round student R 48 2D was eighth of his course due to his process path fitness
of 70.5% (see figure 13). It is noticeable that he skipped three activities, quite
a high number in a delicate process as the CVC installation. The bubble chart
Process step duration and idle time by stage of figure 13 shows that the student
spent a lot of time especially on the ultrasound preparation with a high idle
time of 2:20 minutes and a high process step duration of 2:57 minutes. To ana-
lyze the deviations and process times we will have a closer look on the process
visualization.
Deviation from process model and lead time analysis: The process map in figure
14a shows that the student R 48 2D deviates strongly from the process mod-
el. Only two moves in the first part of the process from perpare implements to
puncture can be characterized as correct which is partly caused by the high num-
ber of rework the student did. For example, the preparation of implements and
putting sterile clothes on is done twice (see table unwanted re-dos in figure 13
and the event counter of figure 14a). Comparing to the process model, the stu-
dent started the CVC installation wrong by not beginning with the preparation
of implements but by putting repeatedly sterile clothes on and washing hands.
Additional to these less severe issues, the student committed two mayor errors
in this first part of the process by not positioning his patient and not anesthetiz-
ing him. This is shown by the two skipped activities (redly marked) in figure
14a. Likewise, demonstrated by the process graph, is the strong deviation of the20 J.Meyer et al.
stages ultrasound configuration and locate structures. This can be seen easily in
the high number of red lines, namely undesired moves. For example, the ultra-
sound configuration should happen before covering the probe and putting gel in
it, but the student changed the ordering of events, which might be the reason for
ultrasound configuration being repeated after doing anatomic identification. We
suppose that mixing up the process order led to the student needing 47 seconds
when transitioning from the event gel in probe to putting the sterile gel which
is an undesired move. He spent even more time on returning from the anatomic
identification of the vein to the second ultrasound configuration which is, as well,
an undesired move. It cost him 1:13 minutes to start this activity again, which
might be a sign of uncertainty.
As can be seen in figure 14a, the part of the process from puncturing the
vein until the guidewire install was done according to the process model and
unproblematic with respect to process and idle times. Then, the student made
an error moving from guidewire install directly to remove trocar, without doing
checks of the wire. As he did not confirm the wire’s good position, he commits
the next error by directly widening the pathway and advancing the catheter,
whereby he realized that the wire’s position was bad and he had to turn back to
puncture the vein again. Circling back in the process took the student an extra
21 seconds. In the next try, he did check the wires position twice, but he did
this deviating from the process model by doing it before removing the trocar.
This undesired move took him 31 seconds which is double compared to the idle
time of 16 seconds experts showed according to the paper [5]5 . The second try
of advancing the catheter was successful and the student followed the process
model correctly until the process’ end. It has to be stated that advancing the
catheter took student R 48 2D in average 49 seconds which is 26 seconds longer
than the time consumed by experts [5].
Recommendations for improvement: Summarizing the insights we derived by the
conformance checking, student R 48 2D should definitely practice the ultrasound
configuration. He could also work on his preparation routine, to not loose e.g.
valuable time on such basic process steps. All in all, the student seemed very
insecure in the pre-round, as he forgot most important things like anesthetizing
the patient or checking the wires position. As it is most important for doctors to
work under extremely high pressure, the student should memorize the whole pro-
cess better. Thus, he would not need to overthink each step and would perform
the CVC installation more routinely.
5
Experts event durations and idle times can be found in paper [5]’s figure 4.Analysis of Central Venous Catheter Installation with MPM 21
Start
Start 1
1
Prepare implements
Prepare implements 2 50s
2 22s
Hand washing
Hand washing 1 19s 0s
1 - 0s
2s 1s
2s 8s 2s -
Get in sterile clothes
3s 2 1:06m
Get in sterile clothes
2 38s
Clean puncture area
4s 3s 37s 1 34s
Clean puncture area
1 18s 5s
10s
5s Drap puncture area
1 36s
Drap puncture area
0s 1 34s Ultrasound configuration
2 22s
Ultrasound configuration
2 34s Gel in probe
1 2s
Gel in probe
15s 1 4s 3s 1s
Cover probe
0s 1 1:16m 22s
Cover probe
1 1:23m 47s 0s 9s 5s 7s
Put sterile gel
Put sterile gel 1 18s
1 22s 1:13m 46s
29s
Position probe
1 0s
Position probe
1 0s
Position patient[126] 5s
Anatomic identification Position patient
1 0s 1 1s
Anatomic identification
1 0s
4s
Compression identification Compression identification
Anesthetize[112]
1 0s 1 0s
42s 29s
Puncture Anesthetize
1 34s
2 22s
20s
1s
Puncture
Blood return 1 43s
2 0s
1s
8s
Blood return
Drop probe 1 0s
2 0s
2s
9s
Drop probe
1 0s
Remove syringe
2 0s
3s
7s Remove syringe
1 0s
Guidewire install
2 45s
7s
21s 2s Guidewire install
1 41s
Remove trocar
2 0s 0s 2s
Check wire in short axis Remove trocar
1 0s 1 7s
3s
31s 6s
Check wire in short axis
Check wire in long axis 3 3s
1 0s 9s
1s 6s 2s
Wire in good position[129]
Wire in good position Check wire in long axis
1 0s 2 23s
Widen pathway
2 15s
8s 10s
5s Widen pathway
1 24s 5s
Advance catheter
2 49s 9s
18s
1s Advance catheter
6 1:19m
Remove guidewire
1 3s
1s
2s Remove guidewire
1 20s
Check flow and reflow
1 26s 6s
Check flow and reflow
7s 1 17s
Check catheter position
1 0s 1s
Check catheter position
0s 1 3s
End 0s
1
End
1
(a) Round PRE. (b) Round POST.
Fig. 14: Process visualization of pre- and post-round for student R 48 2D.
Centered activities and their order represent the aligned happy path. Activities outside
this centered path are undesired. Green lines represent correct moves. Dotted green lines
show skipped moves. Red activities are skipped and red lines depict undesired moves.
The activity labels have two metrics, the number of occurrences and the event duration.
Edges are labeled with their idle time.22
J.Meyer et al.
Fig. 15: This dashboard is the summary for the post-round of student R 48 2D.Analysis of Central Venous Catheter Installation with MPM 23
Detailed improvements achieved in post-round The post-round process
can be seen in figure 14b. The student R 48 2D is still unsure about a good
process order of activities in the stage operator preparation. For example, he still
didn’t start with prepare implements and he was even slower in putting sterile
clothes on than in the pre-round (figure 14b). Cleaning and draping the puncture
area also cost him 21 seconds more than in the pre-round. Probably, the student
was pretty nervous on his final test. We deduct this from the fact that in the
pre-round he performed better due to less pressure.
This time, the stage of ultrasound preparation is done with less process de-
viations and 40 seconds less idle time (comparing the bubble charts in figure
13 and 15). The sequence prepare impelements - ultrasound configuration - pre-
pare implements - gel in probe might be noise due to the manual tagging. If
it was, this process sequence without prepare implements would be okay. The
ultrasound configuration again is done twice, we suppose, the student double
checked his tool to avoid errors. He should learn to trust his skills so he needs to
do it only once. Nevertheless, he configured the ultrasound in average 12 seconds
faster than in the pre-round (see event duration in figure 14b). This time he has
not forgotten to position his patient but he did it before the ultrasound con-
figuration which is not optimal because this way the patient has the chance to
move and change his position right before the vene’s position is checked and the
anasthetizing is started. Furthermore, the student showed a large improvement
by not forgetting to anesthetize the patient. The student was still doing extra
work by identifying the vene’s position twice. It seems as if the student was still
not confident about his skills to identify the vene with one method.
The stage installing guidewire was done only once in the post-round and with
less idle time than before, so here we see an improvement. Contrarily, the process
step duration was higher (bubble chart in figure 15). Regarding the process
deviation, the sub-process is conformant to the process model until the student
reached the point of checking the wire’s position (see figure 14b). Here, he did
three checks (short, long, short axis). In the stage installing catheter the student
advances the catheter four times, which accumulates to 5:20 minutes, a pretty
long time and significantly worse than in his pre-round. Then he checked the
wire in long and short axis again to get back to advancing the catheter two times
more which costs him another 2:20 minutes. The high processing time of advance
catheter is the reason why in figure 15 the stage install catheter is positioned
at the very right in the bubble chart. Due to this decline in performance under
the more stressful situation of having a final test, we state that, likewise, to
identifying the vein, the actual process of installing the catheter is highly stressful
for the student as he needs to reassure himself several times.
This example shows clearly that being close to the process model, as the
student is with his 84.5% of happy path fitness, does not automatically imply
that he is now capable of performing well on a real-life CVC installation. Imag-
ining the scenario, that the vein was collapsed, for example, due to great loss
of blood pressure caused by injuries, would the student have reacted fast and
confident enough to install the catheter and save the patient? In our opinion, the24 J.Meyer et al.
most critical parts of the installation of a central vein catheter are identifying
the vein, puncturing it correctly and installing the catheter smoothly. So, we
would recommend the student to practice the mentioned crucial steps as often
as possible, preferably in situations with increased psychological pressure.
4 Conclusion
The 1st Conformance Checking Challenge 2019 (CCC19) gave us the opportu-
nity to apply innovative techniques onto real-world process data. We analyzed
a process of central venous catheter installation with ultrasound, carried out t-
wo times by ten students. To give process-oriented feedback to the stakeholders,
we created dashboards and further analytics using MEHRWERK ProcessMining
that focus on process deviations regarding changed ordering of activities, extra
work or skipped process steps. Furthermore, we analyzed rework and processing
times, as velocity is a crucial factor in lifesaving CVC installation. We were able
to give tailored feedback to both stakeholders: we indicate process improvement
potentials for the students and recommend the topics on which the instructor
should focus in his classes. We detected that some students did not well memorize
the order of process steps of the stages ultrasound preparation, install guidewire
or install catheter. Therefore, we recommend the instructor to focus his classes
on these topics. In general, the students miss routine in the basic process steps
of the preparation phase. It would be good for the students to gain as much
routine as neccessary, so they do not overthink each step. We also come to the
conclusion that being close to the process model does not automatically imply
that students are capable of performing well on a real-life CVC installation, as
the factor time is important as well. Hence, on the special topic of CVC installa-
tion analysis, we would recommend to include the expert’s process times directly
in the conformance checking algorithm to give even more useful feedback.
Generally, we think that conformance checking has high potential to achieve
process-oriented feedback to stakeholders, but we are aware of the fact that actu-
al techniques are not sufficiently expressive regarding diagnosis. A large amount
of manual analysis work is needed to extract understandable results from the al-
gorithms. Future work should comprise expanding the repertoire of conformance
checking algorithms, probably, there exist techniques that provide more intuitive
results. This research area is still young, so we expect fast development in this
topic.
References
1. Conformance Checking Challenge 2019. In: Process Mining Conference
2019. https://icpmconference.org/icpm-2019/contests-challenges/
1st-conformance-checking-challenge-2019-ccc19/
2. van Dongen B.F. (2019) Efficiently Computing Alignments. In: Daniel F., Sheng
Q., Motahari H. (eds) Business Process Management Workshops. BPM 2018.
Lecture Notes in Business Information Processing, vol 342. Springer, Cham.
https://doi.org/https://doi.org/10.1007/978-3-030-11641-5 4Analysis of Central Venous Catheter Installation with MPM 25 3. van der Aalst W. (2016) Conformance Checking. In: Process Mining. Springer, Berlin, Heidelberg. https://doi.org/https://doi.org/10.1007/978-3-662-49851-4 8. 4. Munoz-Gama, J., de la Fuente, R., Seplveda, M., Fuentes, R., Conformance Check- ing Challenge 2019. 4TU.Centre for Research Data. https://doi.org/10.4121/ uuid:c923af09-ce93-44c3-ace0-c5508cf103ad 5. Lira, R., Salas-Morales, J., de la Fuente, R., Fuentes, R., Sepulveda, M., Arias, M., Herskovic, V., Munoz-Gama, J,. (2019) Tailored Process Feedback Through Process Mining for Surgical Procedures in Medical Training: The Central Venous Catheter Case. In: BPM 2018 International Workshops, Sydney, NSW, Australia, Septem- ber 9-14, 2018, Revised Papers. https://doi.org/https://doi.org/10.1007/978-3-030- 11641-5 13.
You can also read