Article - Journal of Emerging Investigators
←
→
Page content transcription
If your browser does not render page correctly, please read the page content below
Article

Analysis of technology usage of teens: correlating
social media, technology use, participation in sports,
and popularity
Vedat Can Düzgezen, Banu Acarlar, and Özgür Öner
Aci High School, Istanbul, Turkey

SUMMARY                                                         problem. According to Erik Erikson, teenage years encompass
This study tests the correlation between technology             an important developmental stage of life, as teenagers are in
usage and teens’ social lives. The addition of student          search of their unique identities. However, the portrayal of
popularity and the effects of extracurricular activities        themselves on the internet causes teens to get confused about
on technology usage were also examined. A group                 their emerging new identity (4). With the extended amount of
of 50 students was surveyed (25 males and 25                    internet use, teens start to create an online personality for
females; 25 middle schoolers and 25 high schoolers).            themselves. Research done by the Girl Scouts specifies that
                                                                74% of girls agree that other girls use social media to make
The survey primarily asked the students to rate the
                                                                themselves look “cooler” than they are, and 42% say that this
social environment in their school, find the ratio
                                                                statement describes them (5). According to the Pew Research
of their in-school to out of school friends, vote for
                                                                Center, only 25% of teens spend time with their friends
the three most popular students in their grade, and             after school on a daily basis, and 5% do not meet with their
identify their technology usage from one to five (1             friends outside of school (6). According to the Unified Theory
representing not dependent at all and 5 representing            of Adoption and Use of Technology (UTAUT), although it is
extremely addicted). A negative correlation was found           evident that both genders use technology and social media
between participation in extracurricular activities             intensively, males and females do not use it in the same way
and technology usage (p=0.032), which means that                (7). The intention of this research project is to determine
students who participated in extracurricular activities         the difference between males’ usage and females’ usage of
used statistically significantly less technology                technology as well as trying to correlate technology usage and
than the ones who do not. There was no significant              popularity of students at school. In addition, a lot of middle and
difference between the technology usage of middle               high school students spend time after school on sports teams
and high school students. One major finding was                 and activity clubs. Another factor this study will investigate
that boys used technology mainly for gaming and                 is whether extracurricular activities after school with which
entertainment (p=0.039), whereas girls mainly used              students are occupied with impact their internet usage. Also,
it for social media (p=0.016). Most interestingly, the          this research aims to find the correlation between the thoughts
survey showed that the students who were voted to be            of students about their social life in school and their social
                                                                media usage. All in all, there are many factors to technology
more popular by others had higher social media usage
                                                                usage among teens, and this study aspires to create a better
on average than those who were not. Unexpectedly,
                                                                understanding of the complex social dynamics in school. To
a common answer received in the popularity ranking
                                                                clarify, since no intervention is taking place, it is hard to directly
question was the denial of any presence of popularity           infer causal relationships. There may be variables that are not
in the specified grade. The denying students received           considered in the study, resulting in an illusion of a correlative
significantly fewer “popularity votes” than others.             relationship.
The final results added to an increased understanding               For one of the expected results, whether or not internet
of the relationship between technology usage and                usage is affected by extracurricular activities and sports
teens’ social lives.                                            seems clear. We hypothesize that the results would suggest
                                                                that spending time playing sports and participating in
INTRODUCTION                                                    extracurricular activities would decrease technology usage.
    Today’s teenagers spend a lot of time on the internet and   Since previous studies have proven the beneficial effects of
social media, with 95% of the teens reporting that they have    physical exercise and sport participation on self-control (8),
access to or own a smartphone with internet connection          although we don’t currently have data to support this model,
and 45% of them saying that they are “constantly online” (1).   one possibility is that that exercising contributes to solving
As a result, experts have identified this problem as internet   internet addiction. One can resist the urge of going through
addiction. According to Young and Rogers, people become         the reward and excitement packed social media sites with
addicted to the internet in the same way that they become       the discipline exercising regularly brings. On the other hand,
addicted to drugs, alcohol, and—most similarly—gambling,        preventing boredom by filling free time with extracurricular
which result in academic, social, and occupational impairment   activities also stops the wanting of using the internet. Whether
(2). In addition, previous studies have found a statistically   or not this expected result is correct in our case will be tested
significant correlation between the usage of the internet       through the surveys and data collected from the phones of
and depression (3). In the teens’ case, this unveils a bigger   teenagers. Testing an expected result may also help check the

Journal of Emerging Investigators • www.emerginginvestigators.org                                       27 MARCH 2020 | VOL 3 | 1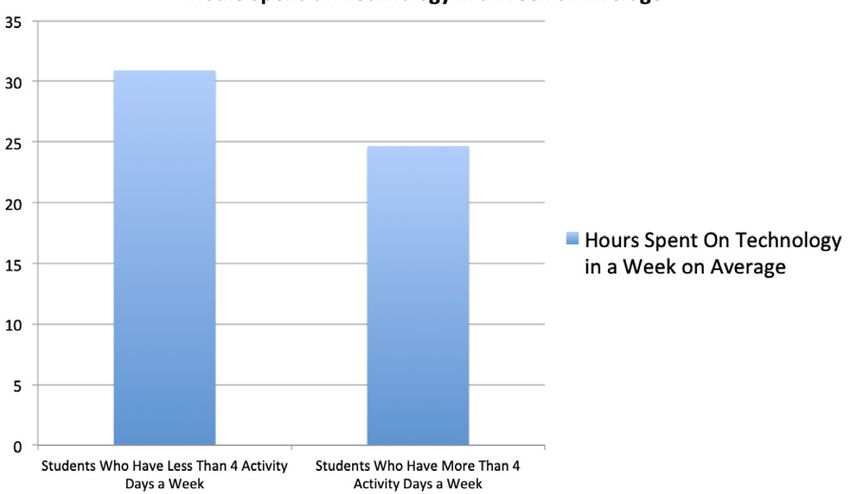
data and the selected subject group.
One hypothesis questions whether there is a correlation
between the thoughts of students about social life in school and
their social media usage. The 8th and 9th grade students at
the surveyed high school spend time socializing in and outside
of school. The school surveyed Aci High School, which has
one 20-minute, one 50-minute, and several 5-minute breaks
between classes. Students have around two hours of free
time at school that they can spend socializing. The question
in the survey regarding this hypothesis required the students
to rate the social environment during these breaks, which are
defined to be the immediate physical surroundings, social
relationships, and cultural milieus within which defined groups
of people function and interact (9). According to Moawad
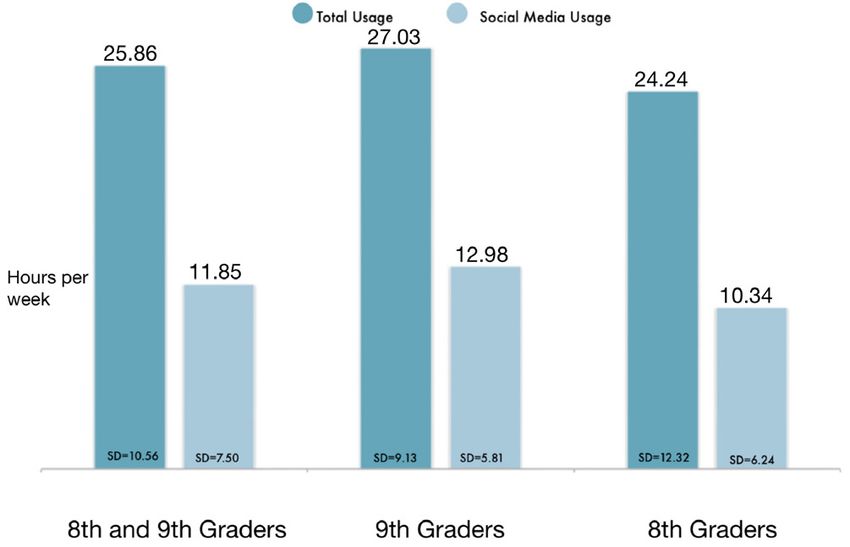
and Ebrahem adolescents’ extensive use of electronic Figure 1: The technology usage averages of 8th , and 9th
communication to interact with their peers may impair their graders. The total technology usage average is 25.86 hours per
relations with their parents, siblings, and other family members week (SD=10.56) and 11.85 hr/wk (SD=7.50) for total social media
(10). This suggests that adolescents are using technology to usage. 9th graders had an average total technology usage of 27.03
profoundly interact and communicate with friends. According hr/wk (SD=9.13) and social media usage of 12.98 hr/wk (SD=5.81).
to Denworth (11), friendship takes time to develop. The more 8th graders had an average total technology usage of 24.24 hr/wk
time two people spend together, the more likely they are to (SD=12.32) and social media usage of 10.34 hr/wk (SD=6.24).
become friends. Since many adolescents use technology to
with the maximum being 29.91 hr/wk. The 9th graders led this
communicate with their peers, one would expect that the more
category with an average of 12.98 hr/wk, while the 8th graders
technology they use the better their friendship with others
fell back with an average of 10.34 hr/wk. On average, the
would be, since they would spend more time not necessarily
surveyed teens spent 45.55% of their time on social media.
together physically but with each other online. This may signify
The 9th graders spent on average nearly 5% more time on
that students who stay in touch after school are more likely
social media than the 8th graders with 47.97% versus 42.21%.
to develop stronger friendship bonds than those who do not.
Out of the 50 students studied, 28% specified that they either
According to Laugeson (12), the lack of social connections
did not do sports outside of school or did not participate in any
and friendship greatly predicts juvenile delinquency, hate
clubs. Only 4% said that they neither participated in clubs nor
towards school, and mental health problems, which can affect
sports teams outside of school. The average rating on a scale
someone’s liking or disliking of the social environment at
of 0-5 that the students gave to the “social environment” was
school. Thus, the data may unveil that those who have weaker
3.97. According to the survey, the kids classified themselves
friendship bonds or less usage of social media/communication
as above average technology users by putting up an average
applications may rate the social environment at school as
of 3.87 to the question: If 5 is extremely addicted to technology
being worse than those who have stronger friendship bonds
and 0 not at all, what would you classify yourself as? Even
or higher usages. Tying it all together, we hypothesized that
the students who were clearly under the average technology
someone with high social media and technology usage for
usage claimed that they were above average internet users. On
communication would rate the social environment at school
average, the surveyed students had obtained 66.14% of their
higher than those who use technology primarily for playing
friends from school, displaying the importance of the school
games and entertainment purposes.
environment in friendship, with the majority of the friends of
We found that students who took elective courses after
surveyed students being in the same school with them. One
school had a lower technology usage with 24.66 hours per
interesting question on the survey (Appendix A) was the last
week compared to 30.89. Another major finding was the
one: If you are comfortable, name 3 people from your grade
usage difference between the sexes with females on average
that you would consider as the most “popular” (defined as
spending 54.86% of their technology usage on social media
someone or something is liked, enjoyed, or supported by many
compared to males with 37.62%. Similarly, the findings
people) (30). During the surveying process, a considerable
suggested that male students spent more time on gaming than
amount of people stated that their grades neither used the
females with 50.52% of the total technology usage, compared
term “popular” nor had “popular” kids. This seemed to be a
to females’ 24.67%.
controversial topic among teens since many students did not
feel comfortable answering this question. Most of them replied
RESULTS
with the exact words: “Our grade does not have such a thing as
We asked how the technology usage could be correlated
popularity”. Upon creating a table from the registered votes,
to social life in teenagers with the help of a survey of male and
it was clear that the people who received “popularity votes”
female middle and high school students.
were not hesitant on voting for others. Those who received 0
The data collected revealed that the average technology
votes, without exception, stated that popularity did not exist;
usage (hours per week) for the 8th and 9th graders was 25.86
however, not all people who denied the existence of popularity
hr/wk (hours per week) (Figure 1). The 9th graders had an
received 0 votes. It appears that most of the students who are
average of around three hours more than the 8th graders with
deemed unpopular deny that the term “popularity” is widely
27.03 hr/wk versus 24.25 hr/wk. The maximum time spent
accepted in their grades.
on a phone was 46 hr/wk. The average amount of time spent
In the intergroup analysis, the rates of social media usage
on social media by the 8th and 9th graders was 11.85 hr/wk,
Journal of Emerging Investigators • www.emerginginvestigators.org 27 MARCH 2020 | VOL 3 | 2striking that especially non-student-athletes were also more
interested in technology than the student athletes. Because
the values for the rate of friends in school (p=0.06) and social
environment ratings (p=0.07) were close to the critical value
(p=0.05), we notice that they are close to being statistically
significant. This means that there might be a real difference
of in-school friends of students who participate in sports and
students who do not; however, this data failed to demonstrate
a statistically significant correlation. Similarly, these tests and
data cannot prove any causation between the two variables
and should be approached with scepticism.
According to the correlation test, the “Game and
Entertainment Ratio Compared to Total Usage, and the Social
Media Ratio Compared to Total Usage” variable had a high
Figure 2: Social media and gaming usages of males and
females. On average males spent 37.62% of their technology usage inverse correlation with an r-value of r=0.67 (p=0.04) for
in social media and 50.52% in gaming. Whereas females spent females and r=0.73 (p=0.03) for males. This suggests that,
54.86% of their technology usage in social media and 24.27% in with statistical significance, the students who do not spend
gaming. their free time on social media spent time on games and
entertainment, and vice versa. This was obtained by analyzing
between the sexes were examined first. Descriptive statistics social media and gaming application usages of individuals.
of the variables created according to gender are given in the Although the data signifies an inverse correlation, we could
graph below (Figure 2). We showed that there was a significant not specify whether the variables have a causal relationship.
difference between the social media usage rates of male and When analyzed in female students, there was a weak
female students. Especially when the average was examined, positive correlation between “Social Media Ratio Compared
we saw that the female students spent 54.86% (SD=13.65) to Total Usage” and “Social Environment Score” variables
of their free time in social media compared to the 37.62% r=0.33 (p=0.02). In other words, the social environment score
(SD=21.25) spent by the male students. Similarly, when the of female students increased slightly as social media usage
time devoted to games and entertainment was examined, increased.
we saw that male students spent 50.52% (SD=16.04) of their To summarize, the data supported both the hypothesis
free time on games and entertainment compared to female and the expected results. From the analysis, we could see
students with 24.67% (SD=17.89) (t-test, p=0.03). that, in fact, spending time playing sports and participating
The threshold for statistically significant p-values for the in extracurricular activities decreased technology usage.
t-test was taken as alpha=0.05. When the t-test results were However, we could not obtain a causative relationship from
examined, a significant difference was found between the the data since, again, no variable was manipulated. We can
rate of social media use to all technology usage, social media only infer that, in this specific group, the usage of technology
usage, in-school friend rates, and game and entertainment was lower for individuals who spent time doing sports and
ratio for males and females (t-test, p=0.01). This means that extracurricular activities. For the hypothesis concerning
statistically, male (25.17 hours per week, SD=11.08) students the relationship between social media usage and social
used social media less than female (28.70 hk/wk, SD=11.28) environment ratings of students, results from the correlation
students. Similarly, there seemed to be a significant difference test showed that there was a correlation between the two data.
in the percentage of in-school friends between females and Although this suggests that individuals who have higher social
males, with females reportedly having more in-school friends media usage ranked the social environment at school higher,
than males (t-test, p=0.03). The higher number of in-school we cannot say that one causes another. Another aim of this
friends of females may be because of their higher use of social research was to pinpoint the differences in the technology
media and communication applications than males. Further usage of males and females. From the t-test results, we see
research would be necessary to investigate this result.
When we examined the students who take elective courses
(including playing sports) and those who do not, the average
technology usage values between the two groups appeared
to be close to each other. Figure 3 shows the significant
differences between these two groups when we take a critical
value of 0.05 for the t-test. For this reason, we can say that
there is a significant difference in technology usage amounts
between those who take elective courses and those who do
not.
When the data above (Figure 3) of students who are
engaged in sports activities and those who do not were
examined, we could show that the students who play sports
spent less time on social media than the students who do Figure 3: Technology usages of students who have more than
not play sports (30.89 hr/wk, SD=17.40, compared to 24.66, four activity days a week and those who do not. The average
SD=13.24). Similarly, there was a difference in the scores total usage for the students who have more than four activity days a
obtained according to the answers to the questions. It is week was 30.89 and 24.66 for those who do not.
Journal of Emerging Investigators • www.emerginginvestigators.org 27 MARCH 2020 | VOL 3 | 3that males and females use technology differently. Females around 20% of all adolescents get diagnosed with depression
use technology mainly to go through social media while males (13). Comparing prior research and this experiment’s
mainly use technology for entertainment and games. The findings, social media usage may be one of the causes.
results did not suggest a significant difference between the The overwhelming use of social media usage among teens
technology usages of middle and high school students. and the manipulation of physical appearance may cause
teens to create a false sense of being. With the extended
DISCUSSION use of the internet, teens today create an online personality
When an intergroup analysis was made between the for themselves, which is usually different from their real-life
males and females who participated in the study, there was identity. Research done by the Girl Scouts specifies that
a noticeable statistical difference between the technology 74% of girls agree that other girls use social media to make
usages of the two groups. We calculated that the females themselves look “cooler” than they are, and 42% say that this
spent 54.86% of their total technology usage on social media, statement describes them (5). Teens may create or believe in
compared to 37.62% of usage in males. Similarly, with a higher standards of beauty given the extreme usage of social
p-value equalling 0.03, males spent more time on mobile media and body manipulation techniques, and get depressed
games than females did. Thus, we can infer that females on when they cannot reach the increased standards. The creation
average tend to spend their time on social media while males of a “better” or “cooler” personality online may cause them
prefer gaming on mobile applications. With this information, to devalue their real-life identity. This may be found in any
we can see that females and males tend to use their time on age range as Yang and Brown found the use of an altered
their mobile phones differently, helping us understand the Facebook self-representation to obtain a contemporary higher
general usage. self-esteem in transition to college (32).
We found that there was a statistically significant difference Prior to this study, there have been many arguments about
in the technology usage of students who participated in the effects of social media usage in an adolescent’s well-being
extracurricular activities and those who did not. Additionally, and emotional status. Many studies, such as that of Kross,
we showed that students who participated in extracurricular have found that Facebook use predicted a negative shift in
activities spent less time on their technological devices. both life satisfaction and how people feel moment-to-moment
Although this semblance is only a correlation, not causation, it (14). Contrarily, many studies, such as Orben’s “Social Media’s
could increase our understanding of the subject. For example, Enduring Effect on Adolescent Life Satisfaction,” have found
understanding that participating in clubs and sports teams that social media use is not, in and of itself, a strong predictor
correlates with decreased internet usage, could help parents of life satisfaction among the adolescents (30). Both of these
who are concerned about their children’s social media usage to contrasting studies have been criticized due to their methods
help their children by encouraging them to participate in those of measuring well-being, thus not resolving the debate.
kinds of activities. One interesting finding similar to this one is Although the results of this study do not definitely prove
the social environment ratings and in-school friend numbers anything or end the discussion, they support Orben’s findings
of students who participated in sports. Student athletes, with a with a significant difference in the numbers of in-school friends
value trending towards significance (t-test, p=0.06), both rated and social environment evaluation scores of students with
their social environment higher than non-student-athletes and high and low social media usages. An external cause may
reported that they had more in-school friends than those who make social media usage and the user’s well-being appear
did not do sports. This could also help parents understand negatively correlative, thus causing the debate. As long as the
the social dynamics of schools, even if the results are not absence of a perfect well-being metric and ability to survey
completely statistically significant, which could help children a large proportion of the users continues, so will the debate.
who have problems socializing or making friends at school find A term that is worth researching is the term popularity. The
common ground with others or overcome their problem. fact that around 20 students gave the exact response (“There
There are several factors that affect one’s technology is no such thing as popularity in our term”) seems to be more
usage that cannot be accounted for. This research aimed than a mere coincidence. The purpose of searching for the
to find correlations rather than causations, since every most “popular” students was to be able to draw a correlation
individual is unique. Although there are several factors that between the popularity of a student and their social media
affect an individual’s internet usage, correlations can greatly usage or social environment point (the rating that helps us
help in understanding the general picture. Since personality, calculate how favourable a school’s social environment is from
socializing preferences, friend groups, and family influences the perspective of the students). However, interestingly there
differ in every individual, it is hard to estimate whether was no correlation. What stood out was that the popular kids
someone’s preferences would change when the variables in (the kids who received votes from others) did not refuse to
this study were to change (sex, age, technology usage, and vote for others, yet the ones with fewer than five votes refused
activity and application preferences). Another setback of the to write down any names. We hypothesize that the ones who
study is that the measurement methods were not standardized are not deemed popular by their peers do not want to admit
or taken from psychology literature. Future studies may develop their unpopularity by stating that there is no such thing as
or validate the findings of this study by using measures set by popularity. However, this hypothesis would need more time
a standardized source such as the the DCT-IA by the DSM-5 and data to be resolved with clear reasoning.
(The Diagnostic and Statistical Manual of Mental Disorders,
Fifth Edition)(31). METHODS
Several prior studies were conducted on the correlation To test the hypothesis concerning the relationship between
between social media usage and clinical depression (3). This technology usage and the social lives of teenagers, 8th and
topic is worth further discussion, since it is estimated that 9th graders of a private high school were surveyed. Every
Journal of Emerging Investigators • www.emerginginvestigators.org 27 MARCH 2020 | VOL 3 | 4student was asked to give consent for their data to be used of the USA, June 2010, www.girlscouts.org/en/about-girl-
anonymously in our research project. The survey requested scouts/research/publications.html.
the amount of time each student spent on their phone, 6. Lenhart, Amanda. “Teens, Technology, and Friendships.”
going through apps classified as social media, games and Pew Research Center, 1 Oct. 2015, www.pewresearch.
entertainment, and creativity and productivity. org/staff/amanda-lenhart/.
Some apps were more popularly used than others in their 7. Goswami, Ananya, and Sraboni Dutta. “Gender Differences
categories. According to the survey, Instagram, Snapchat, in Technology Usage—A Literature Review.” Open Journal
WhatsApp, Facebook, Twitter, and TikTok were the most used of Business and Management, vol. 04, no. 01, 2016, pp.
social media apps (unordered). YouTube, 9Gag, Netflix, Hulu, 51–59., doi:10.4236/ojbm.2016.41006.
PUBG Mobile, Fortnite Mobile, Growtopia, Minecraft, and Sims 8. Park, Jae-Ahm, et al. “Effect of Sports Participation on
were the most popular applications under the category “Games Internet Addiction Mediated by Self-Control: A Case
and Entertainment”. Finally, the Apple Notes, Notability, Safari, of Korean Adolescents.” Kasetsart Journal of Social
Puffin, PowerPoint, Word, Google Drive, Google Docs, and Sciences, vol. 37, no. 3, 2016, pp. 164–169., doi:10.1016/j.
Google Slides were the most used apps under the category kjss.2016.08.003.
“Creativity and Productivity” (28, 29). 9. Pathak, Elizabeth B, and Michele Casper. “A Definition
The amount of time each student spent on these apps was of ‘Social Environment.’” American Journal of Public
received via the new screen time feature that calculates the Health, vol. 91, no. 3, Apr. 2001, p. 465., doi:10.2105/
time spent on each app. The data taken from the screen time AJPH.91.3.465a.
feature were matched to a number representing the students’ 10. Moawad, Gehan E. “The Relationship between the Use of
names for privacy. After the data were processed, a survey Technology and Parent Adolescents Social Relationship.”
was made using the questions listed in the appendix. Journal of Education and Practice, vol. 24, no. 4, 2003,
The students were asked about what extracurricular clubs doi:10.1016/s0197-4572(03)00224-6.
they were participating in and how much time they spent 11. Laugeson, Elizabeth. “The Science of Making Friends:
attending it. They were also questioned about how much time Helping Socially Challenged Teens and Adults.”
they usually spent during each week on sports. The students The Help Group, UCLA Autism Research Alliance,
were asked to rate the social environment at school, estimate 21tb7c2uredpvu4mah6gyjmt-wpengine.netdna-ssl.com/
the number of friends attending the same school, and describe assets/3B Laugeson - The Science of Making Friends.pdf.
their technology usage as above or below average without 12. Borchard, Therese J. “Why Are So Many Teens Depressed?”
knowing the data. The survey was complemented by the World of Psychology, 8 July 2018, psychcentral.com/blog/
values taken from the screen time feature on personal devices. why-are-so-many-teens-depressed/.
The results of the survey were analysed using the SPSS 13. Kross, Ethan, et al. “Facebook Use Predicts Declines in
Program; t-tests and correlation tests were performed to Subjective Well-Being in Young Adults.” PLoS ONE, vol. 8,
obtain statistically significant (p-value = 0.05) different mean no. 8, 2013, doi:10.1371/journal.pone.0069841.
values and correlations from the data. 14. Arisoy, Ozden. “Internet Bagimliligi.” Turkiye Klinikleri
Psikiyatri - Özel Konular, Turkiye Klinikleri, 1 Jan.
Received: October 22, 2019 1970, www.turkiyeklinikleri.com/article/tr-internet-
Accepted: February 12, 2020 bagimliligi-54344.html.
Published: March 27, 2020 15. Ciairano, Silvia, et al. “Parenting and Adolescent Well-
Being in Two European Countries.” Adolescence, U.S.
REFERENCES National Library of Medicine, 2008, www.ncbi.nlm.nih.gov/
1. Anderson, Monica, and Jingjing Jiang. “Teens, Social Media pubmed/18447083.
& Technology 2018.” Pew Research Center: Internet, 16. Correa, Teresa. “Who Interacts on the Web?: The
Science & Tech, Pew Research Center, 31 Dec. 2019, Intersection of Users’ Personality and Social Media Use.”
www.pewresearch.org/internet/2018/05/31/teens-social- American Psychological Association, APA Psych Net,
media-technology-2018/. 2010, psycnet.apa.org/record/2009-24129-014.
2. Young, Kimberly S., and Robert C. Rogers. “The 17. Currie, Melissa. “Parenting in the Technology Generation:
Relationship Between Depression and Internet Addiction.” Exploring the Impact of Technology on Adolescents and
CyberPsychology & Behavior, vol. 1, no. 1, 1998, pp. 25– Their Parents.” UQ ESpace, The University of Queensland,
28., doi:10.1089/cpb.1998.1.25. 10 July 2014, espace.library.uq.edu.au/view/UQ:360600.
3. Üneri, Özden Şükran, and Canan Tanıdır. “Evaluation of 18. Akcay, Behiye. “THE RELATIONSHIP BETWEEN
Internet Addiction in a Group of High School Students: TECHNOLOGY AND ETHICS; FROM SOCIETY TO
a Cross-Sectional Study / Bir Grup Lise Öğrencisinde SCHOOLS .” Turkish Online Journal of Distance Education,
Internet Bağımlılığı Değerlendirmesi: Kesitsel Bir vol. 9, no. 4, Oct. 2008. Istanbul University , ISSN: 1302-
Çalışma.” Dusunen Adam: The Journal of Psychiatry and 6488.
Neurological Sciences, 2011, pp. 265–272., doi:10.5350/ 19. Halabi, Jehado. “Attitudes of Saudi Nursing Students
dajpn2011240402. toward Nursing Research.” Saudi Journal for Health
4. Poole, Sarah, and John Snarey. “Erikson’s Stages Sciences, vol. 5, no. 3, 2016, p. 118., DOI:10.4103/2278-
of the Life Cycle.” Erikson’s Stages of the Life 0521.195813.
Cycle, SpringerLink, 1 Jan. 1970, link.springer.com/ 20. Jones, Sydney, and Susannah Fox. “Generations Online
referenceworkentry/10.1007/978-0-387-79061-9_1024. in 2009.” Pew Research Center: Internet, Science & Tech,
5. “Who’s That Girl? Image and Social Media.” Girl Scouts Pew Research Center, 31 Dec. 2019, www.pewresearch.
org/internet/2009/01/28/generations-online-in-2009/.
Journal of Emerging Investigators • www.emerginginvestigators.org 27 MARCH 2020 | VOL 3 | 521. Kuss, Daria J., and Mark D. Griffiths. “Internet Addiction: A Real Addiction?” Internet Addiction in Psychotherapy, 2015, pp. 54–104., doi:10.1057/9781137465078_4. 22. Morrison, Catriona M., and Helen Gore. “The Relationship between Excessive Internet Use and Depression: A Questionnaire-Based Study of 1,319 Young People and Adults.” Psychopathology, vol. 43, no. 2, 23 Jan. 2010, pp. 121–126. NCBI, DOI:10.1159/000277001. 23. Ofcom. Children and Parents: Media Use and Attitudes Report. Ofcom UK, 23 Oct. 2012, www.ofcom.org.uk/__ data/assets/pdf_file/0020/56324/main.pdf. 24. Moawad, Gehan N, and Gawhara G Ebrahem. “The Relationship between Use of Technology and ParentAdolescents Social Relationship.” Journal of Education and Practice , vol. 7, no. 4, 2016, ISSN:2222- 288X . 25. Whang, Leo Sang-Min, et al. “Internet Over-Users Psychological Profiles: A Behavior Sampling Analysis on Internet Addiction.” CyberPsychology & Behavior, vol. 6, no. 2, 2003, pp. 143–150., DOI:10.1089/109493103321640338. 26. Yang, Shu Ching, and Chieh-Ju Tung. “Comparison of Internet Addicts and Non-Addicts in Taiwanese High School.” Computers in Human Behavior, vol. 23, no. 1, 2007, pp. 79–96., doi:10.1016/j.chb.2004.03.037. 27. “List of Most-Played Mobile Games by Player Count.” Wikipedia, Wikimedia Foundation, 20 Mar. 2020, en.wikipedia.org/wiki/List_of_most-played_mobile_ games_by_player_count. 28. Clement, J. “Top U.S. Mobile Social Apps by Users 2019.” Statista, 10 Mar. 2020, www.statista.com/statistics/248074/ most-popular-us-social-networking-apps-ranked-by- audience/. 29. Orben, Amy, et al. “Social Media’s Enduring Effect on Adolescent Life Satisfaction.” Proceedings of the National Academy of Sciences, vol. 116, no. 21, June 2019, pp. 10226–10228., DOI:10.1073/pnas.1902058116. 30. “POPULARITY: Meaning in the Cambridge English Dictionary.” Cambridge Dictionary, dictionary.cambridge. org/dictionary/english/popularity. 31. Tu, Dongbo, et al. “A New Measurement of Internet Addiction Using Diagnostic Classification Models.” Frontiers in Psychology, vol. 8, Oct. 2017, DOI:10.3389/ fpsyg.2017.01768. 32. Yang, Chia-Chen, and B. Bradford Brown. “Online Self- Presentation on Facebook and Self Development During the College Transition.” Journal of Youth and Adolescence, vol. 45, no. 2, Mar. 2015, pp. 402–416., DOI:10.1007/ s10964-015-0385-y. Copyright: © 2020 Düzgezen, Acarlar, and Öner. All JEI articles are distributed under the attribution non-commercial, no derivative license (http://creativecommons.org/licenses/ by-nc-nd/3.0/). This means that anyone is free to share, copy and distribute an unaltered article for non-commercial purposes provided the original author and source is credited. Journal of Emerging Investigators • www.emerginginvestigators.org 27 MARCH 2020 | VOL 3 | 6
You can also read