Modelling Urban Sustainability - Spiekermann & Wegener
←
→
Page content transcription
If your browser does not render page correctly, please read the page content below

Modelling Urban Sustainability

                        Klaus Spiekermann and Michael Wegener
               Spiekermann & Wegener Urban and Regional Research (S&W)
                    Lindemannstrasse 10, D-44137 Dortmund, Germany
                         E-mail: ks/mw@spiekermann-wegener.de

Abstract
The objective of the EU research project PROPOLIS (Planning and Research of Policies for
Land Use and Transport for Increasing Urban Sustainability) is to assess urban strategies and
to demonstrate their long-term effect in European cities. To reach this goal, a comprehensive
framework of methodologies including integrated land use, transport and environmental mod-
els as well as indicator, evaluation and presentation systems has been developed.
Sustainable development is viewed as comprising the environmental, socio-cultural and eco-
nomic dimension. Thirty-five key indicators were defined to measure the three dimensions of
sustainability, such as air pollution, consumption of natural resources, quality of open space,
population exposure to air pollution and noise, equity and opportunities and economic bene-
fits from transport and land use.
Indicator values are derived from state-of-the-art urban land use and transport models. A
number of additional modules, including a justice evaluation module, an economic evaluation
module and a GIS-based raster module, were developed and integrated to provide further in-
dicator values. Both multicriteria and cost-benefit analysis methods are used to consistently
evaluate the impacts of the policies. The environmental and social dimensions of sustain-
ability are measured using multicriteria analysis for the evaluation of the indicators, whereas
cost-benefit analysis is used for the economic dimension. The modelling and evaluation sys-
tem is currently being implemented in seven European urban regions: Bilbao (Spain), Brus-
sels (Belgium), Dortmund (Germany), Helsinki (Finland), Inverness (Scotland), Naples (Italy)
and Vicenza (Italy).
A large number of policies are being tested with the modelling and evaluation system in the
seven urban regions. Policies investigated are land use policies, transport infrastructure poli-
cies, transport regulation and pricing policies and combinations of these. Besides a common
set of policies examined in all seven urban regions, also city-specific local policies are being
assessed in each urban region.
The first part of the paper introduces the methodology and the model system developed. The
second part presents first results of the policy testing and evaluation. The paper concludes
with reflections on how successful strategies to enhance the long-term sustainability of urban
regions can be developed.

International Journal of Urban Sciences 7(1), 2003, 47-64.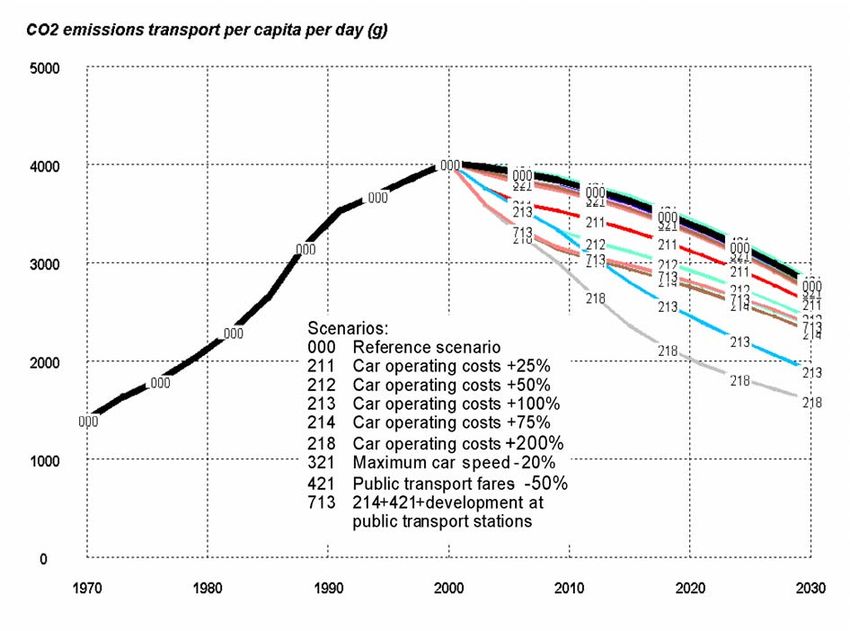
1. Introduction
The notion of each generation's duty to its successors is at the heart of the concept of sustain-
able development and was captured by the Brundtland Commission (WCED, 1987) in its re-
port 'Our Common Future', which defined sustainable development as "development that
meets the needs of the present generation without compromising the ability of future genera-
tions to meet their own needs." Many definitions have followed that of the Brundtland Com-
mission. For example, Daly (1991) defines sustainable development as one that satisfies three
basic conditions: (1) its rates of use of renewable resource do not exceed their rates of regen-
eration; (2) its rates of use of non-renewable resources do not exceed the rate at which sus-
tainable renewable substitutes are developed; and (3) its rates of pollution do not exceed the
assimilative capacity of the environment.
However, many definitions of sustainability are broader in concept and seek to extend the
definition beyond environmental considerations and include issues of social equity and jus-
tice. Different weight is often also given to the importance of economic growth. For instance,
the 'Charter of European Cities and Towns Towards Sustainability' states that the main basis
for sustainable development is "to achieve social justice, sustainable economies, and envi-
ronmental sustainability. Social justice will necessarily have to be based on economic
sustainability and equity, which require environmental sustainability" (ICLEI, 1994).
In the sustainability discussion, often a distinction is drawn between major environmental
threats to human life on the planet earth on the one hand and local concerns, which are more
amenable to trade-offs on the other. In this discussion, cities and urban regions play an im-
portant role. Cities contribute to a large extent to global environmental problems, but at the
same time people living in cities are confronted with environmental damage, pollution, health
and social and economic problems.
Consequently, goals to make cities more sustainable have been formulated (e.g. European
Environment Agency, 1995):

- minimising the consumption of space and natural resources,

- rationalising and efficiently managing urban flows,

- protecting the health of the urban population,

- ensuring equal access to resources and services,

- maintaining cultural and social diversity.
Also, different policies, including transport, land use, regulatory, investment, fiscal and pric-
ing policies to improve the urban situation have been designed and partly implemented. How-
ever, actual urban developments show that these policies have not been able to stop the de-
crease of sustainability of our cities. Even to maintain the existing level of sustainability will
probably require the introduction of more radical policy measures. But such policies will not
be implemented if their effects cannot be clearly demonstrated. Policies might have very dif-
ferent effects. Besides direct environmental, social or economic impacts many policy options
may have negative side effects. Some policy options may work against each other, whereas
some may reinforce each other. Some policy options may improve the situation in part of the
region, whereas in other parts the situation may get worse. Hence, the design of policies to
improve urban sustainability is anything else than a straightforward task. Because the direct
and indirect, the short-term and long-term effects have to be identified and measured in a
transparent way, this calls for advanced methods of policy impact assessment and policy
evaluation.

                                                2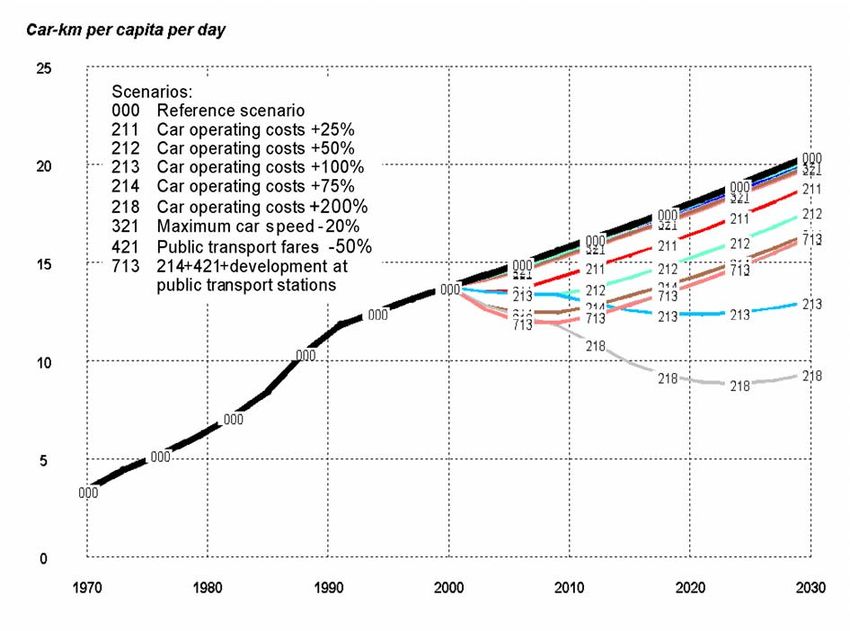
To develop and implement such a system is the objective of the EU research project PROPO-
LIS (Planning and Research of Policies for Land Use and Transport for Increasing Urban
Sustainability). The goal is to assess urban strategies and to demonstrate their long-term effect
in European cities with respect to sustainability. To reach this goal, a comprehensive frame-
work of methodologies including integrated land use, transport and environmental modelling
as well as indicator, evaluation and presentation systems have been developed.
PROPOLIS is part of the Key Action 'City of Tomorrow and Cultural Heritage' of the 5th
Framework Programme for Research and Technology Development of the European Union.
Project partners are IRPUD and S&W (Dortmund), LT (Helsinki), ME&P (Cambridge),
MECSA (Bilbao), STRATEC (Brussels), TRT (Milan) and UCL (London).
The first part of this paper introduces the methodology and the model system developed. The
second part presents typical results of the policy testing and evaluation. The paper concludes
with reflections on how successful strategies to enhance the long-term sustainability of urban
regions can be developed.

2. Indicators of Urban Sustainability
As definitions of sustainability have broadened in scope over time, the number of possible
indicators has grown to an extent where virtually all aspects of life are covered. Consequently,
a vast number of sustainability indicator systems are in use today.
In PROPOLIS, sustainable development is viewed as comprising the environmental, socio-
cultural and economic dimension. For the three components, key indicators have been identi-
fied by using a set of criteria:
- Relevance. The indicator should be relevant for describing important aspects of
  sustainability.
- Representativeness. In order to keep the indicator system manageable, not each suitable
  indicator can be included, the focus is on key indicators representing different domains of
  sustainability.
- Policy sensitiveness. Only indicators that are sensitive to the policies investigated are of
  interest.
- Predictability. There exist a large number of indicators suitable for monitoring but, as the
  objective is to model future policy impacts, it is essential that the indicator values can be
  forecast into the future by the model system.
The resulting PROPOLIS indicator system is presented in Table 1. To allow a structured
evaluation, the three sustainability components are subdivided into themes. Then appropriate
indicators are related to these themes.
Nine themes and thirty-five key indicators have been defined to measure the three dimensions
of sustainability, such as greenhouse gas emissions, air pollution, consumption of natural re-
sources, quality of open space, population exposure to air pollution and noise, equity and op-
portunities and economic benefits from transport. The present indicator list lacks indicators
related to land use, such as greenhouse gas emissions, air pollution, noise, energy use or eco-
nomic benefits. Some of these indicators are tested in individual case study cities, but it was
outside the scope of PROPOLIS to implement these indicators in all case study cities.

                                               3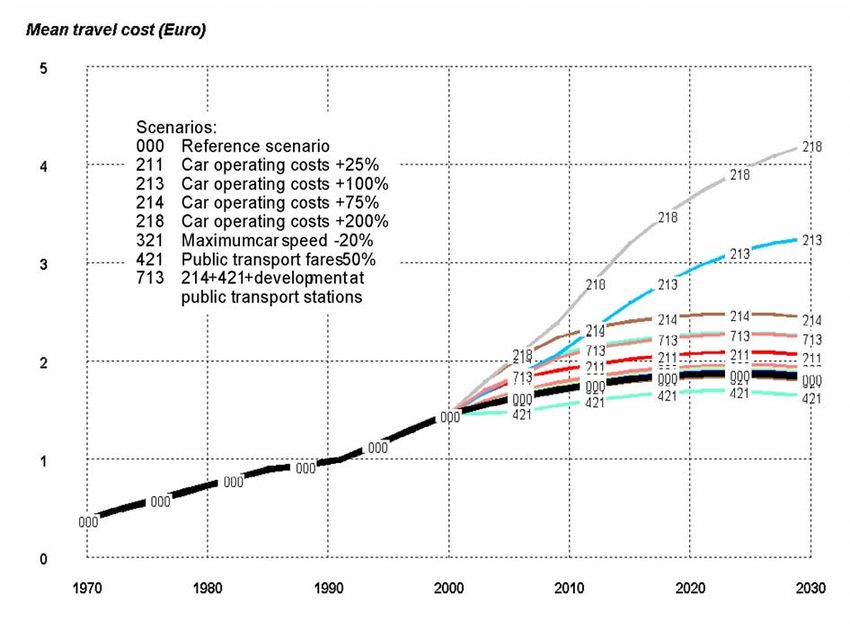
Table 1 PROPOLIS indicator system

                Theme                   Indicator

                Global climate change   Greenhouse gases from transport

                                        Acidifying gases from transport
                Air pollution
                                        Volatile organic compounds from transport

Environmental                           Consumption of mineral oil products, transport
indicators      Consumption of
                natural resources       Land coverage
                                        Need for additional new construction

                                        Fragmentation of open space
                Environmental quality
                                        Quality of open space

                                        Exposure to PM from transport in the living environment
                                        Exposure to NO2 from transport in the living environment
                Health                  Exposure to traffic noise
                                        Traffic deaths
                                        Traffic injuries

                                        Justice of distribution of economic benefits
                                        Justice of exposure to PM
                Equity                  Justice of exposure to NO2
                                        Justice of exposure to noise
Social                                  Segregation
indicators
                                        Housing standard
                                        Vitality of city centre
                Opportunities
                                        Vitality of surrounding region
                                        Productivity gain from land use

                                        Total time spent in traffic
                                        Level of service of public transport and slow modes
                Accessibility
                and traffic             Accessibility to city centre
                                        Accessibility to services
                                        Accessibility to open space

                                        Transport investment costs
                                        Transport user benefits
                                        Transport operator benefits
Economic        Total net benefit       Government benefits from transport
indicators      from transport          Transport external accident costs
                                        Transport external emissions costs
                                        Transport external greenhouse gases costs
                                        Transport external noise costs

                                                4
3. PROPOLIS Methodology
This chapter presents the main components of the PROPOLIS model system and shows how
the policy testing and evaluation process is organised.
3.1 The PROPOLIS Model System
For a systematic evaluation of policies with respect to their long-term impacts on urban
sustainability, a model system was designed in which different models and tools are inte-
grated. Figure 1 illustrates the main components and data flows of the model system from in-
put through behaviour and impact modelling to output in the form of indicators and their
evaluation and presentation.
Figure 1 PROPOLIS model system
The input data include policy packages, GIS databases and model databases. Policy packages
to be tested are transformed to 'model language' by changing some of the model parameters or
model data. GIS databases contain georeferenced data of zone boundaries, transport networks,
land use categories etc. in a geographic information system (GIS). All land-use transport
models used are fully GIS-integrated, i.e. each model zone or model network link is repre-
sented in the GIS database.
5In the modelling part the land-use transport models are the driving engines of the system.
They have been previously calibrated to correspond to the observed behaviour in the test cit-
ies. The land-use transport models simulate the effects of policies on zonal activities, such as
population or employment, and on mobility patterns, such as modal shares and link flows.
The indicator modules receive the outputs of the land-use transport models and calculate the
sustainability indicators.
The output part consists of sustainability indicator values which are further processed in the
sustainability evaluation module. Other important information that helps to understand the
behaviour of the system but is not used in the evaluation is stored as background variables.
Examples for background variables are zonal population and employment, modal shares, car-
km travelled etc. A web-based presentation tool shows the results of each policy in a standard
form for comparisons between policies and between cities.
The Land-Use Transport Models
The PROPOLIS model system is implemented in seven European urban regions: Bilbao
(Spain), Brussels (Belgium), Dortmund (Germany), Helsinki (Finland), Inverness (United
Kingdom), Naples (Italy) and Vicenza (Italy). For each region an operational land-use trans-
port model existed before the project. Table 2 presents the seven urban regions, their land-use
transport models and their zoning systems. Figure 2 shows their location.
Table 2 Case city regions and land-use transport models
Case city Bilbao Brussels Dortmund Helsinki Inverness Naples Vicenza
Area (km²) 2,217 4,332 2,014 764 4,152 1,171 2,722
Population (1,000) 1,140 2,841 2,516 946 132 3,099 787
Density (inh/km²) 514 656 1,249 1,238 32 2,647 289
Average household 3.2 2.7 2.1 2.1 2.8 3.1 2.7
size
Unemployment rate 25.0 % 11.0 % 12.6 % 6.0 % 8.1 % 27.8 % 2.8 %
Income/inh/month
(Euro) 750 713 1,570 1,100 n.a. 695 1,079
Cars/1,000 inh 418 461 492 345 332 526 591
Land-use transport
model MEPLAN TRANUS IRPUD MEPLAN TRANUS MEPLAN MEPLAN
Land use zones 111 139 246 173 153 179 102
Transport zones 111 139 246 173 153 39 27
6The seven case study regions differ in
many respects. Their sizes range from
130,000 to over three million inhabi-
tants. Some have experienced strong
growth while others are old declining
cities, sometimes in the process of
restructuring. Some have high, some
very low unemployment rates. In-
come per person and car ownership
differ considerably. The spatial struc-
tures range from highly compact and
centralised to dispersed or polycentric
patterns. With different conditions of
transport supply, the modal shares
vary significantly, however, car travel
is always dominant.
The models applied belong to three
different types of urban land-use
transport model: the MEPLAN model
Figure 2 PROPOLIS case study regions
(Hunt, 1994; Martino and Maffii,
1999; Williams, 1994) is implement-
ed in four urban regions, the TRANUS model (de la Barra, 1989) in two and the IRPUD
model (Wegener, 1996; 1998; 1999) in one. The models simulate the effects of policies on the
location behaviour of households and firms and on the resulting mobility patterns in the case
study regions. Common base year of the models is 1996, the final forecast year is 2021.
Output of the land-use transport models is provided in a common data format for a pre-
defined set of variables. Because the models are implemented in very different ways, har-
monisation of the model outputs is necessary. The harmonisation is performed by aggregation
to the 'lowest common denominator'. This means that the land-use transport models work with
as much detail as they were implemented and that subsequent stages of the model system
work with less detail but with a common set of variables in order to allow comparisons be-
tween cities. Socio-economic groups are aggregated to three types, employment sectors to
four types, land and floorspace to three types, trips to five types, transport modes to five types
and transport links to ten types.
The Indicator Modules
The indicator modules calculate the sustainability indicators. They post-process the output of
the land-use transport models. Four indicator modules are implemented in the system: the
Raster Module, the Economic Indicator Module, the Justice Indicator Module and the Other
Sustainability Indicator Module. The output of the indicator modules are values of the
sustainability indicators listed in Table 1.
The Raster Module calculates indicators for which a disaggregate treatment of space is re-
quired. The land-use transport models are not directly capable of capturing important aspects
of urban sustainability because their zone-based spatial resolution is too coarse to represent
other environmental phenomena than total resource use, total energy consumption or total
CO2 emissions. In particular emission-concentration algorithms such as air dispersion, noise
propagation, but also land coverage, landscape fragmentation or the exposure of population to
pollutants and noise, require a much higher spatial resolution than large zones. In all cases,
the information needed is configurational. This implies that not only the attributes of the
components of the modelled system such as quantity or cost are of interest but also their
7physical micro locations. This is where the Raster Module comes into play. It maintains the
zonal organisation of the aggregate land-use transport model but complements it by a disag-
gregate representation of space in 100 x 100 m raster cells for the calculation of local envi-
ronmental and social impacts of policies (Spiekermann, 1999; 2003; Spiekermann and Wege-
ner, 1999; 2000). The Raster Module calculates most environmental indicators, the exposure
indicators and an indicator of accessibility to open space. In addition the Raster Module feeds
the Economic Indicator Module with information on emission and noise exposure and the
Justice Indicator Module with information on exposure of different socio-economic groups to
air pollution and noise.
The Economic Indicator Module performs a cost benefit analysis of the transport sector. Sin-
gle indicators address transport investment costs, user, operator and governmental benefits as
well as external costs of transport. In addition the module provides an indicator describing the
efficiency of the urban system measured on the basis of variables, such as the size of the city,
the speed at which people and goods are moved in the city and the sprawl of jobs and home
following Prud'homme and Chang-Woon (1999).
The Justice Indicator Module addresses equity implications of the investigated policies. It
translates the percent of people of different socio-economic groups who are exposed to air
pollution and traffic noise into equity indicators. Four different theories of justice are incorpo-
rated in the module: the equal-shares principle, the utilitarian principle, the egalitarian princi-
ple and the Rawlsian difference principle.
The Other Sustainability Indicator Module calculates a small set of indicators which is not
covered by the previous modules but may of general interest for understanding the behaviour
of the urban system, such as zonal population and employment, modal shares and car-km
travelled.
The Evaluation and Presentation Modules
Finally, the indicators are evaluated by a multicriteria evaluation tool and are analysed and
presented in a harmonised way for comparisons between policies and between cities.
The multicriteria evaluation tool USE-IT determines the sustainability of policies with respect
to environmental, social and economic sustainability. It calculates the contribution of each
indicator to sustainability and aggregates them to the sustainability themes and components
defined in Table 1.
Value functions are used to transform the indicator values to a scale from zero to one by tak-
ing existing target values into account. Indicators are given weights for aggregation to indices.
The weights are the outcome of an internal expert survey performed to determine a common
set of weights for all case study cities. In addition, local value systems are explored to deter-
mine weights in the local contexts. Indices are formed as weighted averages of the evaluated
indicators. Aggregation is performed separately for the environmental, social and economic
components of sustainability. A single index aggregating the three components is not calcu-
lated to avoid double-counting, because some aspects are considered in more than one com-
ponent, i.e. are treated from different viewpoints.
An Internet-based Analysis and Presentation Tool presents the results of the policy testing for
all cities in a standardised format. The tool analyses and displays sustainability indicators and
background variables for comparison between policies and between cities. The Internet tool is
designed to be used by planners and policy makers in the case study regions to make it easier
for them to understand the impacts of policy decisions and so aid them in the process of se-
lecting the most appropriate policy measures.
83.2 Implementation and Policy Testing
The PROPOLIS model system is currently being implemented in the seven European urban
regions. Figure 3 shows how the system is used to define strategies that increase urban
sustainability. The model system is the core of the policy analysis. First single policies are
defined and introduced into the system. Policies include land use, transport, pricing and regu-
latory and investment policies. The evaluation of policies and the comparison between poli-
cies and between cities may lead to a reformulation of policies ('Replanning'). Replanning in-
cludes the refinement of policies, e.g. finding an optimal level of a pricing policy, but also
experimenting with policy combinations to improve the results. The final output of the sys-
tematic policy tests are general and city-specific recommendations which policies or combi-
nations of policies are likely to contribute most to sustainable development.
There are various points in the system at which planners and policy makers in the case study
regions may intervene and introduce their ideas and values into the modelling and evaluation
process. They may contribute to the formulation of the assumptions about external develop-
ments for the models, such as assumptions about the likely overall economic development of
the region or about migration flows across the regions' borders. Or they may want to test the
impacts of alternative assumptions about external developments. An important task of the lo-
cal partners is to contribute to the formulation of strategies and policies common for all case
study cities or specific to their regions. Finally, the local experts are asked to indicate their
values, i.e. enter their own weights into the evaluation system.
Figure 3 Policy testing process
94. Typical Results
The PROPOLIS project is still ongoing and will be completed in mid-2003. Policy testing and
analysis has started but has not yet been completed. In this section typical preliminary results
of the modelling work for the Dortmund case study region are presented. The first part will
discuss typical output indicator of the land-use transport model, the second will focus on
some key sustainability indicators calculated with the tools introduced in Section 3.1.
The Dortmund case study region is the urban region of Dortmund consisting of the city of
Dortmund and its 25 surrounding municipalities. The region is subdivided into 246 statistical
areas or zones. However, as it was explained in Section 3.1, the spatial resolution of 246
zones is not sufficient for the simulation of environmental impacts, such as air quality and
traffic noise. Therefore the zone-based and link-based results of the land-use transport model
are disaggregated to raster cells by the Raster Module (see Section 3.1). Raster cells of 100 x
100 m size are used to model environmental impacts. In total, about 207,000 raster cells cover
the study area. The same spatial reference system will be used in a microsimulation model
currently developed for the Dortmund region (see Möckel et al., this issue).
4.1 Land-Use Transport Model Indicators
Figures 4 to 6 show selected results of altogether 22 policy scenarios modelled in PROPOLIS.
The policy scenarios included, besides local infrastructure improvement policies specific for
each case study city, policies for car pricing, speed limits, public transport and land use as
well as policy packages consisting of several land use and transport policies combined. All
policy scenarios are compared with a reference or base scenario, in which no policy changes
are assumed after the year 2001. All policies in the policy scenarios start after 2001, i.e. all
policy scenarios are identical with the reference scenario until that year.
Each of the three diagrams shows trajectories for one system variable between the base year
1970 and the target year 2030. Each line in the diagrams corresponds to one policy scenario.
The heavy line represents the development of the variable in the reference or base scenario
000. After the year 2000, the lines representing the policy scenarios diverge from the line of
the reference scenario; the numbers attached to each line is the scenario number. The policies
modelled in each policy scenario are listed in short form on the diagram.
Figure 4 shows the development of mean travel cost per trip in the scenarios. The increase in
mean travel cost in the reference scenario is the combined effect of inflation, increasing fuel
costs and public transport fares, longer distances travelled and growing fuel efficiency of cars
(see Figure 4). The differences in mean travel cost between the scenarios and the reference
scenario are indicate the effect of the pricing policies. There is only one scenario, scenario
421, in which mean travel costs are lower than in the reference scenario, whereas in all other
scenarios they are higher. The highest increases are shown in scenarios 213 and 218, in
which significant increases of fuel taxes are assumed.
Figure 5 shows the development of mean trip lengths. In the reference scenario mean trip
lengths increase from under 10 to about 15 km between 1970 and 2030. This is the combined
result of growing affluence, decentralisation of population through suburbanisation and only
moderate increases of fuel prices, which have in effect made fuel less expensive in real terms
during the forecasting period. The differences between the policy scenarios and the reference
scenario are as expected. Scenario 421, in which travel by public transport is made less ex-
pensive, longer trips are made – something not always expected by proponents of subsidisa-
tion of public transport. All other scenarios result in shorter average trip lengths, which is in
line with economic theory.
10Figure 4 Scenario results: mean travel cost
Figure 5 Scenario results: mean trip length
11A similar picture emerges if only car km are considered. Figure 6 shows that only car pricing
policies have a significant effect on car distances travelled. All other policy types, including
the land use policies have only insignificant effects.
Figure 6 Scenario results: car km
4.2 Sustainability Indicators
The land-use transport models predict long term changes in the urban land use and transport
system. The indicator modules (see Figure 1) use the output of the land-use transport models
(zone data and link flows), disaggregate it to raster cells using GIS information and produce
the sustainability indicators. If the land-use transport model results are translated into
sustainability effects the same overall picture with respect to the policy impacts holds true.
Only making car travel more expensive, significant reductions in greenhouse gas emissions
can be expected (Figure 7). However, the diagram also shows that equally important are ef-
forts to make cars more energy efficient: the decline in CO2 emissions after 2000 in the refer-
ence scenario is due to the assumptions about growing energy efficient car technology built
into all of the scenarios.
Figures 8 to 11 show examples of raster-based output of environmental and social indicators
in the Dortmund urban region for the year 2021 for the base scenario 000.
12Figure 7 Scenario results: CO2 emissions by transport
Figure 8 shows a forecast of air quality in the Dortmund urban region as it would result in the
reference scenario. Based on a forecast of number and type of vehicles on the links of the road
network, emission functions are used to determine the volume of pollutants, in this case of
NO2, emitted along the links. An air distribution model is used to forecast the dispersion of
the pollutant on adjacent areas – the predominant south-west wind direction in the Dortmund
area is clearly visible. As also population by socio-economic group is disaggregated to raster
cells, it is possible to calculate how many people in each neighbourhood and in each socio-
economic group are exposed to this type of air pollution. This information is used for the
health and equity indicators in the system of indicators (see Table 1).
Figure 9 shows exposure to traffic noise. Again link loads by vehicle type are used to calcu-
late traffic noise emissions along links. A noise propagation model is used to calculate the
dispersion of noise on both sides of the links. To take into account that buildings along the
roadways act as noise barriers, assumptions about the reduction of noise propagation in areas
of higher density are made. As with air quality, exposure to noise can be related to residences
of population by socio-economic group and used in the health and equity evaluations.
Figure 10 is a raster-based representation of open space, i.e. all land that is neither built-up
area nor a transport link. In the map the traffic noise corridors of Figure 7 are overlaid with
the open space. Red raster cells are disturbed by traffic noise, green areas are not. It is as-
sumed that only the remaining open space, which is not disturbed by traffic noise, is of value
for recreation and can therefore serve as an indicator of the quality of open space in a zone.
Figure 11 shows accessibility to open space. The indicator is calculated by a potential acces-
sibility model using open space as mass term and walking distance as impedance. The aver-
age accessibility to open space is influenced in the different scenarios by settlement activities,
by infrastructure development and by movement of households.
13Figure 8 Air quality in the Dortmund region
Figure 9 Traffic noise in the Dortmund region
14Figure 10 Quality of open space in the Dortmund region
Figure 11 Accessibility to open space in the Dortmund region
15The maps presented are used as means to understand the spatial distribution of effects of a
certain policy. For the policy evaluation, the indicator numbers are used. Table 3 presents for
selected sustainability indicators the outcome of the selected policies presented in the previ-
ous sections. Emission of air pollutants will clearly go down in all scenarios because of new
emission standards for new vehicles replacing old ones assumed already in the base scenario.
The increase in car operating costs will result in even lower numbers of population exposed to
air pollution and traffic noise. However, most significant effects can only be achieved by a
clear increase in costs as in Scenario 218. Quality of open space and also the accessibility to
open space are becoming worse in the future, mainly because of the fact that the ongoing
trend of land consumption will continue in all scenarios. However, quality of open space
might be improved compared to the base scenario by appropriate policies such as increase of
car operating costs, reduction of speeds or combinations of policies.
Table 3 Scenario results: selected sustainability indicators
Scenario Quality of Exposure to Exposure to Accessibility
open space NO2 noise to open space
Number Policy Year Index Percent of Percent of Index
2001 = 100 population population 2001 = 100
above EU disturbed
guidelines
000 Base scenario 2001 100.0 20.5 39.5 100.0
000 Base scenario 2021 89.4 12.3 37.6 88.7
211 Car operating costs 2021 90.1 12.0 37.4 88.7
+25%
212 Car operating costs 2021 91.3 11.7 37.1 88.6
+50%
213 Car operating costs 2021 92.9 10.8 36.5 88.5
+100%
214 Car operating costs 2021 92.1 11.4 37.0 88.7
+75%
218 Car operating costs 2021 91.3 8.9 34.4 88.6
+200%
321 Maximum car speed - 2021 95.1 13.0 35.6 88.5
20%
421 Public transport fares - 2021 89.8 12.0 37.5 88.8
50%
713 214 + 421 + develop- 2021 95.0 11.0 36.7 88.1
ment at public trans-
port stations
165. Conclusions
This paper presented a model system developed to simulate and evaluate the impacts of land
use and transport policies on sustainability in seven European urban regions.
The PROPOLIS system of sustainability indicators differs from other sustainability indicator
systems. Other systems are based on monitoring approaches in which the quantities in ques-
tion are directly observed or measured, whereas in PROPOLIS the indicators are modelled,
i.e. can be forecast. Another distinction is that the PROPOLIS indicators were chosen as near
as possible at the tail-ends of causal chains. For example, vehicle kilometres or average travel
times are not presented as indicators for sustainability but emissions or numbers of residents
in the most polluted areas.
The land-use transport models implemented in PROPOLIS are integrated with geographic in-
formation systems. All model zones and network links have their direct correspondence in a
GIS. Tools were developed to exchange information back and forth between the models and
the GIS, such as tools for editing links and link attributes in the GIS and to load them into the
models. In this way the land-use transport models follow the trend to link spatial models to
georeferenced data (Fotheringham and Wegener, 2000). GIS integration is a precondition for
linking land-use transport models with environmental impact modules.
The PROPOLIS model system is one of the first attempts to address the issue of urban
sustainability in a comprehensive long-term forecasting framework. The model system moves
from two-way land-use transport modelling towards three-way land-use transport environ-
ment modelling (LTE), even though the feedback from environment to land use and transport,
i.e. the way by which changes in environmental quality affect location decisions of investors,
firms and households and so indirectly also influence activity and mobility patterns, has so far
been only poorly developed (Spiekermann and Wegener, 2003),
The few results presented suggest that a clear increase of car operating might be the single
best policies to support sustainability and might also suggest that other polices, such as regu-
latory policies or land use polices are not important. However, the latter would be a mislead-
ing conclusions. High-density, mixed-used settlement patterns are an essential precondition
for less car-dependent cities. Therefore land use policies supporting high densities and smaller
distances between residences and work places are a necessary ingredient of sustainability-
oriented urban planning.
The PROPOLIS system is currently being implemented in seven European urban regions.
Therefore, only typical preliminary results could be presented in this paper. All case city
model systems are expected to calculate all PROPOLIS sustainability indicators and test the
same set of policies. This will allow the systematic comparison of policy scenarios and indi-
vidual policies with respect to their impact on urban sustainability. This comparison will lead
to recommendations which policies should be adopted to improve urban sustainability in the
long term.
17Acknowledgements
The authors are grateful to their colleagues of the PROPOLIS project at IRPUD (Dortmund),
LT (Helsinki), ME&P (Cambridge), MECSA (Bilbao), STRATEC (Brussels), TRT (Milan)
and UCL (London) for the permission to use material they have contributed to the project.
References
Daly, H.E. (1991): Steady State Economics. Island Press, Washington.
de la Barra, T. (1989): Integrated Land-Use and Transport Modelling. Decision Chains and
Hierarchies. Cambridge University Press, Cambridge.
European Environment Agency (1995): Europe's Environment: The Dobris Assessment.
European Environment Agency, Copenhagen.
Fotheringham, A.S. and Wegener, M. (eds.) (2000): Spatial Models and GIS: New Potential
and New Models. GISDATA 7. Taylor & Francis, London.
Hunt, D. (1994): Calibrating the Naples land use and transport model. Environment and Plan-
ning B: Planning and Design 21, 569-590.
ICLEI – International Council for Local Environmental Initiatives (1994): Charter of Euro-
pean Cities and Towns Towards Sustainability (Aalborg Charter). http://www.iclei.org/
europe/echarter.htm.
Martino, A. and Maffii, S. (1999): The integrated land-use and transport model of Naples:
from the master transport plan to the EU policy tests. In Rizzi, P. (ed.): Computers in Urban
Planning and Urban Management on the Edge of the Millennium. F. Angeli, Milan.
Prud'homme, R. and Chang-Woon, L. (1999): Size, sprawl speed and the efficiency of cities,
Urban Studies 36, 11, 1849-1858.
Spiekermann, K. (1999): Sustainable transport, air quality and noise intrusion – an urban
modelling exercise. Paper presented at the ESF/NSF Transatlantic Research Conference on
Social Change and Sustainable Transport, University of California at Berkeley.
Spiekermann, K. (2003): The PROPOLIS Raster Module. Deliverable D4 of PROPOLIS.
Spiekermann & Wegener Urban and Regional Research (S&W), Dortmund.
Spiekermann K. and Wegener M. (1999): Disaggregate environmental modules for modelling
sustainable urban development. In Rizzi, P. (ed.): Computers in Urban Planning and Urban
Management on the Edge of the Millennium. F. Angeli, Milan.
Spiekermann K. and Wegener, M. (2000): Freedom from the tyranny of zones: towards new
GIS-based models. In Fotheringham, A.S. and Wegener, M. (eds.): Spatial Models and GIS:
New Potential and New Models. GISDATA 7. Taylor & Francis, London, 45-61.
Spiekermann, K. and Wegener, M. (2003): Environmental Feedback. Deliverable D2 of
PROPOLIS. Institute of Spatial Planning, University of Dortmund and Spiekermann & We-
gener Urban and Regional Research (S&W), Dortmund.
Wegener, M. (1996): Reduction of CO2 emissions of transport by reorganisation of urban ac-
tivities. In Hayashi, Y. and Roy, J. (eds.): Land Use, Transport and the Environment. Kluwer
Academic Publishers, Dordrecht, 103-124.
18Wegener, M. (1998): The IRPUD Model: Overview. http://irpud.raumplanung.uni-dortmund.
de/irpud/pro/mod/mod_e.htm.
Wegener, M. (1999): Die Stadt der kurzen Wege – müssen wir unsere Städte umbauen? Be-
richte aus dem Institut für Raumplanung 43. Dortmund: Institute of Spatial Planning, Univer-
sity of Dortmund.
Williams, I.N. (1994): A model of London and the South East. Environment and Planning B:
Planning and Design 21, 517-533.
WCED – World Commission on Environment and Development (1987): Our Common Fu-
ture. Oxford University Press, Oxford.
19You can also read