Annual Plan - Consultation Document Supporting Information
←
→
Page content transcription
If your browser does not render page correctly, please read the page content below
Annual
    Plan
   2019-20
Consultation Document
Supporting Information
Contents                                                                 About this
  About this document .  .  .  .  .  .  .  .  .  .  .  .  .  .  . 3      document
Draft forecast financial statements .  .  .  .  .  .  .5
Activity funding  .  .  .  .  .  .  .  .  .  .  .  .  .  .  .  .  . 13   The Annual Plan 2019-20 Consultation
                                                                         Document is all about Year 2 of our Long
  Draft prospective funding impact statements . 14                       Term Plan 2018-28.
Draft capital projects .  .  .  .  .  .  .  .  .  .  .  .  .  . 25       We have made some small changes
  Capital projects planned for 2019-20 .  .  .  .  . 26                  since we set the plan that are not
                                                                         considered significant from a legal
Draft financial prudence benchmarks  .  .  .  . 33                       perspective. However, we felt it was
  Annual plan disclosure statement  .  .  .  .  .  .  . 34               important to let you know where we
                                                                         are heading and what the plans for
Draft funding impact statement .  .  .  .  .  .  .  . 39                 2019-20 look like.
  Funding impact statement  .  .  .  .  .  .  .  .  .  .  . 40           This document contains information
Draft significant forecasting assumptions .  . 51                        that supports the Annual Plan 2019-20
                                                                         Consultation Document (Year 2 of our
  2019-20 Annual Plan significant forecasting                            Long Term Plan 2018-28).
  assumptions  .  .  .  .  .  .  .  .  .  .  .  .  .  .  .  .  .  . 52
                                                                         We will be out and about in the
                                                                         community during our consultation
                                                                         period of March 4 to April 4 so you can
                                                                         tell us your thoughts on our Annual Plan
                                                                         2019-20. We look forward to hearing
                                                                         from you.

                                                                              For more
                                                                              information
                                                                              If you want more
                                                                              information visit:
                                                                              www.wdc.govt.nz/AnnualPlan
                                                                              or phone 09 430 4200
                                                                              or 0800 WDC INFO

                                                                                                                    3
4
Draft
forecast
financial
statements

             5
PROSPECTIVE STATEMENT OF COMPREHENSIVE REVENUE
AND EXPENDITURE
LTP Year 1 Annual Plan LTP Year 2 Variance
2018-19 2019-20 2019-20 $000
$000 $000 $000
Revenue
97,322 Rates 101,788 101,592 196
4,640 Development and other contributions 4,794 4,794 -
22,524 Subsidies and grants 23,595 25,539 (1,944)
14,144 Fees and charges 14,822 14,863 (41)
53 Interest revenue 448 46 402
13,013 Other revenue 13,149 13,225 (76)
151,696 Total revenue 158,596 160,059 (1,463)
Expenses
65,880 Other expenditure 67,120 66,937 (183)
38,720 Depreciation and amortisation 42,453 40,274 (2,179)
6,609 Finance costs 7,345 7,345 -
29,463 Personnel costs 30,672 30,173 (499)
140,672 Total expenses 147,590 144,729 (2,861)
11,024 Surplus / (deficit) before taxation 11,006 15,330 (4,324)
- Taxation charge - - -
11,024 Surplus / (deficit) after taxation 11,006 15,330 (4,324)
Other comprehensive revenue and expenses
42,003 Gain / (loss) on infrastructure asset revaluation 17,395 17,395 -
- Gain / (loss) on other asset revaluations - - -
53,027 Total comprehensive income 28,401 32,725 (4,324)
6PROSPECTIVE STATEMENT OF CHANGES IN NET ASSETS /
EQUITY
Year 1 Annual Plan LTP Year 2
2018-19 2019-20 2019-20
$000 $000 $000
1,480,857 Opening balance as at 1 July 1,574,740 1,533,884
53,027 Total comprehensive revenue and expense 28,401 32,724
- Adjustments and contributions to net assets/equity - -
1,533,884 Total recognised net assets/equity as at 30 June 1,603,141 1,566,608
7PROSPECTIVE STATEMENT OF FINANCIAL POSITION
LTP year 1 Annual Plan LTP year 2
2018 - 19 2019 - 20 2019 - 20
$000 $000 $000
Assets
Current assets
300 Cash and cash equivalents 3,361 300
17,057 Debtors and receivables 16,715 18,010
- Derivative financial instruments - -
607 Other financial assets 576 607
822 Other current assets 711 822
- Assets held for sale - -
18,786 Total current assets 21,363 19,739
Non current assets
10 Derivative financial assets 7 10
Other financial assets:
11,589 - Investments held in joint ventures and subsidiaries 12,830 12,601
2,924 - Investments held in other entities 3,137 2,924
1,610,830 Property plant and equipment 1,697,049 1,681,269
8,540 Intangible assets 9,334 10,385
787 Forestry assets 891 787
55,919 Investment properties 54,890 55,919
1,690,599 Total non current assets 1,778,138 1,763,895
1,709,385 Total assets 1,799,501 1,783,634
Liabilities
Current liabilities
21,615 Payables and deferred revenue 27,727 28,513
283 Derivative financial instruments 304 283
29,000 Current borrowings 23,000 20,000
2,478 Employee benefits liabilities 2,475 2,528
108 Provisions 108 106
53,484 Total current liabilities 53,614 51,430
8LTP year 1 Annual Plan LTP year 2
2018 - 19 2019 - 20 2019 - 20
$000 $000 $000
Non current liabilities
11,233 Derivative financial instruments 11,881 11,233
108,860 Non-current borrowings 129,000 152,483
399 Employee benefits liabilities 396 407
1,368 Provisions 1,368 1,318
156 Payables and deferred revenue 101 156
122,016 Total non current liabilities 142,746 165,597
175,500 Total liabilities 196,360 217,027
1,533,885 Net assets 1,603,141 1,566,607
Equity
896,165 Retained earnings 933,964 921,498
71,933 Other reserves 67,547 61,928
565,787 Asset revaluation reserve 601,630 583,180
1,533,885 Total equity attributable to Council 1,603,141 1,566,607
9PROSPECTIVE STATEMENT OF CASH FLOWS
LTP year 1 Annual Plan LTP year 2
2018 - 19 2019 - 20 2019 - 20
$000 $000 $000
Cash flows from operating activities
96,625 Receipts from rate revenue 101,308 100,964
22,373 Subsidies and grants received 23,474 25,404
13,107 Other revenue including development contributions 13,327 13,367
14,048 Fees and charges received 14,752 14,777
50 Interest received 448 43
540 Dividends received 40 540
(94,346) Payments to suppliers and employees (95,664) (93,659)
(6,609) Interest paid (7,345) (7,345)
45,788 Net cash flow from operating activities 50,341 54,091
Cash flows from investing activities
- Proceeds from fixed assets - -
- Receipts from investments and loans 500 -
(58,763) Purchase and development of fixed assets (79,083) (88,712)
- Purchase of investments and loans provided - -
(58,763) Net cash flow from investing activities (78,583) (88,712)
Cash flows from financing activities
12,974 Proceeds from borrowings - 34,623
- Loan repayments received - -
- Repayment of borrowings - -
- Loans granted - -
12,974 Net cash flow from investing activities - 34,623
(1) Net increase/(decrease) in cash, cash equivalents and bank (28,242) 1
overdrafts
300 Cash, cash equivalents and bank overdrafts at the beginning of the 31,603 300
year
300 Cash, cash equivalents and bank overdrafts at the end of the year 3,361 300
10RESERVE FUNDS
Opening Transfers Transfers Estimated
balance in out closing
July balance 30
2019 June 2020
Asset revaluation Reserve 584,235 17,395 - 601,630
Activity Total Asset Revaluation Reserve 584,235 17,395 - 601,630
Governance and strategy Fishermans Levy - to fund 112 - - 112
maintenance and upgrading of marine
facilities for use by commercial fishing
vessels
Community Facilities and Trust Funds - bequests held for 11 - - 11
services specific purpose
Community Facilities and Community Development Fund 1 - to 4,134 124 - 4,258
services provide funding for land for reserves
for community facilities on Council
owned reserve land
Community Facilities and Community Development Fund 2 - 6,669 200 - 6,870
services to provide funding for community
facilities on non-Council reserve land
Community Facilities and Community Development Fund 3 - to 322 10 - 331
services provide funding for performing arts
activities
Community Facilities and Art Acquisitions - to fund acquisition 15 - - 15
services of artworks
Community Facilities and Clock Purchases - to fund purchase 51 - - 51
services of clocks for the Claphams Clocks
Museum
Community Facilities and AH Reed Reserve - residual balance 3 - - 3
services
Community Facilities and Leonard Library Reserve - bequest for 257 - - 257
services the purchase of library books
Governance and strategy Property Reinvestment Reserve - 31,003 620 - 31,623
to fund property purchases for a
commercial return
Water Water Reserve - to hold any surpluses 33,505 - 9,699 23,806
for future funding of water activities
Planning and regulatory Dog Reserve - to hold any surpluses 257 - 47 210
services for future funding of Dog activities
Total Reserves and Special Funds 76,340 954 9,746 67,548
1112
Activity
funding

           13
Draft prospective funding impact
statements
SUMMARY
Year 1 Annual Plan Year 2 Variance
2018 - 19 2019 - 20 2019 - 20 $000
$000 $000 $000
Sources of Operating Funding
56,517 General rates, uniform annual general charges, rates 59,551 59,471 80
penalties
40,806 Targeted rates 42,237 42,121 116
6,482 Subsidies and grants for operating purposes 6,691 6,691 -
14,144 Fees and charges 14,822 14,863 (41)
1,488 Interest and dividends from investments 2,000 1,598 402
8,578 Local authorities fuel tax, fines, infringement fees 8,597 8,673 (76)
and other receipts
128,014 Total Operating Funding 133,898 133,416 482
Applications of Operating Funding -
95,343 Payments to staff and suppliers 97,792 97,110 682
6,609 Finance Costs 7,345 7,345 -
- Other operating funding applications - - -
101,952 Total Applications of Operating Funding 105,137 104,455 682
26,061 Surplus / (Deficit) of Operating Funding 28,761 28,961 (200)
Sources of Capital Funding
16,042 Subsidies and grants for capital expenditure 16,903 18,848 (1,945)
4,640 Development and financial contributions 4,794 4,794 -
12,974 Increase / (decrease) in debt - 34,623 (34,623)
- Gross proceeds from sale of assets - - -
- Other dedicated capital funding - - -
- Lump sum contributions - - -
33,657 Total Sources of Capital Funding 21,697 58,264 (36,567)
Applications of Capital Funding
Capital expenditure
7,710 to meet additional demand 10,164 12,951 (2,787)
17,564 to improve levels of service 35,016 43,331 (8,315)
29,458 to replace existing assets 36,031 35,882 149
4,986 Increase / (decrease) in reserves (30,753) (4,938) (25,815)
- Increase / (decrease) of investments - - -
59,718 Total Applications of Capital Funding 50,458 87,226 (36,768)
(26,061) Surplus / (Deficit) of Capital Funding (28,761) (28,961) 200
- Funding Balance - - -
14TRANSPORTATION
Year 1 Annual Plan Year 2 Variance
2018 - 19 2019 - 20 2019 - 20 $000
$000 $000 $000
Sources of Operating Funding
15,874 General rates, uniform annual general charges, rates 16,248 15,901 347
penalties
34 Targeted rates 34 34 1
6,422 Subsidies and grants for operating purposes 6,629 6,629 -
1,328 Fees and charges 1,364 1,364 -
- Internal charges and overheads recovered - - -
645 Local authorities fuel tax, fines, infringement fees 814 649 165
and other receipts
24,302 Total Operating Funding 25,089 24,576 513
Applications of Operating Funding
13,879 Payments to staff and suppliers 14,652 14,356 296
4,070 Finance Costs 4,478 4,270 208
1,107 Internal charges and overheads applied 1,153 1,092 61
- Other operating funding applications - - -
19,056 Total Applications of Operating Funding 20,283 19,717 566
5,246 Surplus / (Deficit) of Operating Funding 4,806 4,859 (53)
Sources of Capital Funding -
14,820 Subsidies and grants for capital expenditure 14,247 16,191 (1,944)
1,957 Development and financial contributions 2,022 2,022 -
3,928 Increase / (decrease) in debt (3,375) 10,105 (13,480)
- Gross proceeds from sale of assets - - -
- Other dedicated capital funding - - -
- Lump sum contributions - - -
20,705 Total Sources of Capital Funding 12,894 28,319 (15,425)
Applications of Capital Funding
Capital expenditure
3,227 to meet additional demand 3,239 4,293 (1,054)
3,922 to improve levels of service 6,211 8,641 (2,430)
16,778 to replace existing assets 16,579 16,764 (185)
2,024 Increase / (decrease) in reserves (8,329) 3,479 (11,808)
- Increase / (decrease) of investments - - -
25,951 Total Applications of Capital Funding 17,700 33,178 (15,478)
(5,246) Surplus / (Deficit) of Capital Funding (4,806) (4,859) 53
- Funding Balance - - -
15WATER
Year 1 Annual Plan Year 2 Variance
2018 - 19 2019 - 20 2019 - 20 $000
$000 $000 $000
Sources of Operating Funding
- General rates, uniform annual general charges, rates - - -
penalties
15,129 Targeted rates 15,196 15,236 (40)
- Subsidies and grants for operating purposes - - -
169 Fees and charges 173 173 -
- Internal charges and overheads recovered - - -
1,416 Local authorities fuel tax, fines, infringement fees 1,495 1,366 129
and other receipts
16,714 Total Operating Funding 16,864 16,774 90
Applications of Operating Funding
7,472 Payments to staff and suppliers 7,572 7,324 248
- Finance Costs - - -
2,595 Internal charges and overheads applied 2,493 2,590 (97)
- Other operating funding applications - - -
10,067 Total Applications of Operating Funding 10,065 9,914 151
6,648 Surplus / (Deficit) of Operating Funding 6,799 6,861 (62)
Sources of Capital Funding -
- Subsidies and grants for capital expenditure - - -
944 Development and financial contributions 975 975 -
- Increase / (decrease) in debt - - -
- Gross proceeds from sale of assets - - -
- Other dedicated capital funding - - -
- Lump sum contributions - - -
944 Total Sources of Capital Funding 975 975 -
Applications of Capital Funding
Capital expenditure
2,326 to meet additional demand 4,860 5,904 (1,044)
2,285 to improve levels of service 5,873 5,202 671
4,446 to replace existing assets 6,741 7,741 (1,000)
(1,466) Increase / (decrease) in reserves (9,699) (11,011) 1,312
- Increase / (decrease) of investments - - -
7,591 Total Applications of Capital Funding 7,774 7,836 (62)
(6,648) Surplus / (Deficit) of Capital Funding (6,799) (6,861) 62
- Funding Balance - - -
16SOLID WASTE
Year 1 Annual Plan Year 2 Variance
2018 - 19 2019 - 20 2019 - 20 $000
$000 $000 $000
Sources of Operating Funding
- General rates, uniform annual general charges, rates - - -
penalties
6,678 Targeted rates 7,031 6,891 140
- Subsidies and grants for operating purposes - - -
2,922 Fees and charges 2,936 2,986 (50)
- Internal charges and overheads recovered - - -
370 Local authorities fuel tax, fines, infringement fees 378 376 2
and other receipts
9,969 Total Operating Funding 10,345 10,254 91
Applications of Operating Funding
6,861 Payments to staff and suppliers 7,804 7,017 787
296 Finance Costs 115 141 (26)
167 Internal charges and overheads applied 126 170 (44)
- Other operating funding applications - - -
7,324 Total Applications of Operating Funding 8,045 7,328 717
2,646 Surplus / (Deficit) of Operating Funding 2,300 2,926 (626)
Sources of Capital Funding -
- Subsidies and grants for capital expenditure - - -
- Development and financial contributions - - -
(1,014) Increase / (decrease) in debt (1,475) (2,926) 1,451
- Gross proceeds from sale of assets - - -
- Other dedicated capital funding - - -
- Lump sum contributions - - -
(1,014) Total Sources of Capital Funding (1,475) (2,926) 1,451
Applications of Capital Funding
Capital expenditure
- to meet additional demand - - -
1,632 to improve levels of service 825 - 825
- to replace existing assets - - -
- Increase / (decrease) in reserves - - -
- Increase / (decrease) of investments - - -
1,632 Total Applications of Capital Funding 825 - 825
(2,646) Surplus / (Deficit) of Capital Funding (2,300) (2,926) 626
- Funding Balance - - -
17WASTEWATER
Year 1 Annual Plan Year 2 Variance
2018 - 19 2019 - 20 2019 - 20 $000
$000 $000 $000
Sources of Operating Funding
- General rates, uniform annual general charges, rates - - -
penalties
18,064 Targeted rates 18,985 18,969 16
- Subsidies and grants for operating purposes - - -
684 Fees and charges 707 707 -
- Internal charges and overheads recovered - - -
345 Local authorities fuel tax, fines, infringement fees 208 350 (142)
and other receipts
19,093 Total Operating Funding 19,900 20,025 (125)
Applications of Operating Funding
5,608 Payments to staff and suppliers 5,911 5,844 67
464 Finance Costs - - -
988 Internal charges and overheads applied 1,804 985 819
- Other operating funding applications - - -
7,061 Total Applications of Operating Funding 7,715 6,829 886
12,032 Surplus / (Deficit) of Operating Funding 12,185 13,196 (1,011)
Sources of Capital Funding -
1,172 Subsidies and grants for capital expenditure 2,657 2,657 -
1,131 Development and financial contributions 1,168 1,168 -
(8,911) Increase / (decrease) in debt (14,574) (10,647) (3,927)
- Gross proceeds from sale of assets - - -
- Other dedicated capital funding - - -
- Lump sum contributions - - -
(6,608) Total Sources of Capital Funding (10,749) (6,822) (3,927)
Applications of Capital Funding
Capital expenditure
436 to meet additional demand 667 740 (73)
1,471 to improve levels of service 3,272 4,531 (1,258)
1,727 to replace existing assets 2,518 2,618 (100)
1,790 Increase / (decrease) in reserves (5,021) (1,514) (3,507)
- Increase / (decrease) of investments - - -
5,424 Total Applications of Capital Funding 1,436 6,375 (4,939)
(12,032) Surplus / (Deficit) of Capital Funding (12,185) (13,196) 1,011
- Funding Balance - - -
18STORMWATER
Year 1 Annual Plan Year 2 Variance
2018 - 19 2019 - 20 2019 - 20 $000
$000 $000 $000
Sources of Operating Funding
4,284 General rates, uniform annual general charges, rates 3,646 3,837 (191)
penalties
- Targeted rates - - -
- Subsidies and grants for operating purposes - - -
- Fees and charges - - -
- Internal charges and overheads recovered - - -
- Local authorities fuel tax, fines, infringement fees - - -
and other receipts
4,284 Total Operating Funding 3,646 3,837 (191)
Applications of Operating Funding
1,232 Payments to staff and suppliers 1,088 1,233 (145)
- Finance Costs - - -
1,250 Internal charges and overheads applied 971 1,244 (273)
- Other operating funding applications - - -
2,481 Total Applications of Operating Funding 2,059 2,477 (418)
1,802 Surplus / (Deficit) of Operating Funding 1,587 1,359 228
Sources of Capital Funding -
- Subsidies and grants for capital expenditure - - -
- Development and financial contributions - - -
- Increase / (decrease) in debt - - -
- Gross proceeds from sale of assets - - -
- Other dedicated capital funding - - -
- Lump sum contributions - - -
- Total Sources of Capital Funding - - -
Applications of Capital Funding
Capital expenditure
- to meet additional demand - - -
852 to improve levels of service 643 415 228
951 to replace existing assets 944 944 -
- Increase / (decrease) in reserves - - -
- Increase / (decrease) of investments - - -
1,802 Total Applications of Capital Funding 1,587 1,359 228
(1,802) Surplus / (Deficit) of Capital Funding (1,587) (1,359) (228)
- Funding Balance - - -
19FLOOD PROTECTION
Year 1 Annual Plan Year 2 Variance
2018 - 19 2019 - 20 2019 - 20 $000
$000 $000 $000
Sources of Operating Funding
- General rates, uniform annual general charges, rates - - -
penalties
1,120 Targeted rates 1,210 1,210 -
- Subsidies and grants for operating purposes - - -
- Fees and charges - - -
- Internal charges and overheads recovered - - -
61 Local authorities fuel tax, fines, infringement fees 62 61 1
and other receipts
1,181 Total Operating Funding 1,272 1,271 1
Applications of Operating Funding
750 Payments to staff and suppliers 753 768 (15)
31 Finance Costs 13 6 7
9 Internal charges and overheads applied 9 9 -
- Other operating funding applications - - -
790 Total Applications of Operating Funding 775 783 (8)
392 Surplus / (Deficit) of Operating Funding 497 488 9
Sources of Capital Funding -
- Subsidies and grants for capital expenditure - - -
- Development and financial contributions - - -
(392) Increase / (decrease) in debt (497) (488) (9)
- Gross proceeds from sale of assets - - -
- Other dedicated capital funding - - -
- Lump sum contributions - - -
(392) Total Sources of Capital Funding (497) (488) (9)
Applications of Capital Funding
Capital expenditure
- to meet additional demand - - -
- to improve levels of service - - -
- to replace existing assets - - -
- Increase / (decrease) in reserves - - -
- Increase / (decrease) of investments - - -
- Total Applications of Capital Funding - - -
(392) Surplus / (Deficit) of Capital Funding (497) (488) (9)
- Funding Balance - - -
20COMMUNITY FACILITIES AND SERVICES
Year 1 Annual Plan Year 2 Variance
2018 - 19 2019 - 20 2019 - 20 $000
$000 $000 $000
Sources of Operating Funding
25,899 General rates, uniform annual general charges, rates 26,510 25,943 567
penalties
- Targeted rates - - -
60 Subsidies and grants for operating purposes 62 62 -
971 Fees and charges 1,002 992 10
2,573 Internal charges and overheads recovered 2,682 2,624 58
3,124 Local authorities fuel tax, fines, infringement fees 3,316 3,189 127
and other receipts
32,628 Total Operating Funding 33,572 32,809 763
Applications of Operating Funding
24,538 Payments to staff and suppliers 25,514 25,149 365
4,961 Finance Costs 5,261 5,653 (392)
9,177 Internal charges and overheads applied 8,936 9,223 (287)
- Other operating funding applications - - -
38,675 Total Applications of Operating Funding 39,711 40,026 (315)
(6,047) Surplus / (Deficit) of Operating Funding (6,139) (7,216) 1,077
Sources of Capital Funding -
50 Subsidies and grants for capital expenditure - - -
608 Development and financial contributions 628 628 -
16,549 Increase / (decrease) in debt 11,916 23,530 (11,614)
- Gross proceeds from sale of assets - - -
- Other dedicated capital funding - - -
- Lump sum contributions - - -
17,208 Total Sources of Capital Funding 12,544 24,159 (11,615)
Applications of Capital Funding
Capital expenditure
1,163 to meet additional demand 821 936 (115)
3,968 to improve levels of service 8,476 7,738 738
4,006 to replace existing assets 5,438 4,789 648
2,024 Increase / (decrease) in reserves (8,329) 3,479 (11,808)
- Increase / (decrease) of investments - - -
11,160 Total Applications of Capital Funding 6,405 16,943 (10,538)
6,047 Surplus / (Deficit) of Capital Funding 6,139 7,216 (1,077)
- Funding Balance - - -
21GOVERNANCE AND STRATEGY
Year 1 Annual Plan Year 2 Variance
2018 - 19 2019 - 20 2019 - 20 $000
$000 $000 $000
Sources of Operating Funding
1,775 General rates, uniform annual general charges, rates 2,754 3,075 (321)
penalties
- Targeted rates - - -
- Subsidies and grants for operating purposes - - -
- Fees and charges - - -
327 Internal charges and overheads recovered 474 334 140
6,149 Local authorities fuel tax, fines, infringement fees 6,067 6,316 (249)
and other receipts
8,252 Total Operating Funding 9,295 9,725 (430)
Applications of Operating Funding
6,028 Payments to staff and suppliers 5,755 7,019 (1,264)
281 Finance Costs 268 268 -
1,881 Internal charges and overheads applied 2,272 1,916 356
- Other operating funding applications - - -
8,190 Total Applications of Operating Funding 8,295 9,203 (908)
61 Surplus / (Deficit) of Operating Funding 1,000 521 479
Sources of Capital Funding -
- Subsidies and grants for capital expenditure - - -
- Development and financial contributions - - -
- Increase / (decrease) in debt - - -
- Gross proceeds from sale of assets - - -
- Other dedicated capital funding - - -
- Lump sum contributions - - -
- Total Sources of Capital Funding - - -
Applications of Capital Funding
Capital expenditure
- to meet additional demand - - -
61 to improve levels of service 100 521 (421)
- to replace existing assets 900 - 900
- Increase / (decrease) in reserves - - -
- Increase / (decrease) of investments - - -
61 Total Applications of Capital Funding 1,000 521 479
(61) Surplus / (Deficit) of Capital Funding (1,000) (521) (479)
- Funding Balance - - -
22PLANNING AND REGULATORY SERVICES
Year 1 Annual Plan Year 2 Variance
2018 - 19 2019 - 20 2019 - 20 $000
$000 $000 $000
Sources of Operating Funding
8,455 General rates, uniform annual general charges, rates 8,148 9,347 (1,199)
penalties
- Targeted rates - - -
- Subsidies and grants for operating purposes - - -
7,809 Fees and charges 8,375 8,375 -
4,254 Internal charges and overheads recovered 4,021 4,259 (238)
1,204 Local authorities fuel tax, fines, infringement fees 1,203 1,206 (3)
and other receipts
21,722 Total Operating Funding 21,747 23,187 (1,440)
Applications of Operating Funding
10,990 Payments to staff and suppliers 11,302 11,123 179
- Finance Costs - - -
10,527 Internal charges and overheads applied 10,245 10,650 (405)
- Other operating funding applications - - -
21,518 Total Applications of Operating Funding 21,547 21,772 (225)
204 Surplus / (Deficit) of Operating Funding 200 1,415 (1,215)
Sources of Capital Funding -
- Subsidies and grants for capital expenditure - - -
- Development and financial contributions - - -
- Increase / (decrease) in debt - - -
- Gross proceeds from sale of assets - - -
- Other dedicated capital funding - - -
- Lump sum contributions - - -
- Total Sources of Capital Funding - - -
Applications of Capital Funding
Capital expenditure
- to meet additional demand - - -
- to improve levels of service - - -
204 to replace existing assets 200 1,415 (1,215)
- Increase / (decrease) in reserves - - -
- Increase / (decrease) of investments - - -
204 Total Applications of Capital Funding 200 1,415 (1,215)
(204) Surplus / (Deficit) of Capital Funding (200) (1,415) 1,215
- Funding Balance - - -
23SUPPORT SERVICES
Year 1 Annual Plan Year 2 Variance
2018 - 19 2019 - 20 2019 - 20 $000
$000 $000 $000
Sources of Operating Funding
1,748 General rates, uniform annual general charges, rates 3,804 2,950 854
penalties
- Targeted rates - - -
- Subsidies and grants for operating purposes - - -
259 Fees and charges 265 265 -
23,181 Internal charges and overheads recovered 23,474 23,349 125
246 Local authorities fuel tax, fines, infringement fees 268 250 18
and other receipts
25,434 Total Operating Funding 27,811 26,814 997
Applications of Operating Funding
19,721 Payments to staff and suppliers 19,220 19,077 143
- Finance Costs 424 498 (74)
2,635 Internal charges and overheads applied 2,643 2,687 (44)
- Other operating funding applications - - -
22,356 Total Applications of Operating Funding 22,287 22,262 25
3,078 Surplus / (Deficit) of Operating Funding 5,524 4,552 972
Sources of Capital Funding -
- Subsidies and grants for capital expenditure - - -
- Development and financial contributions - - -
2,814 Increase / (decrease) in debt 8,000 15,046 (7,046)
- Gross proceeds from sale of assets - - -
- Other dedicated capital funding - - -
- Lump sum contributions - - -
2,814 Total Sources of Capital Funding 8,000 15,046 (7,046)
Applications of Capital Funding
Capital expenditure
558 to meet additional demand 577 1,077 (500)
3,373 to improve levels of service 9,616 16,283 (6,667)
1,346 to replace existing assets 2,712 1,611 1,101
615 Increase / (decrease) in reserves 619 627 (8)
- Increase / (decrease) of investments - - -
5,892 Total Applications of Capital Funding 13,524 19,598 (6,074)
(3,078) Surplus / (Deficit) of Capital Funding (5,524) (4,552) (972)
- Funding Balance - - -
24Draft capital
projects
25Capital projects planned for
2019-20
Programme Project LTP Net timing New/ Annual Plan
2019-20 differences (savings) 2019-20
$000 $000 $000 $000
Transportation
Bus Shelters Bus Shelters 94 - - 94
Coastal Protection Coastal Protection Structures 84 - - 84
- Roading
Cycleways Cycleways - Subsidised 3,182 (3,182) - -
Footpaths Footpaths Renewals 372 - - 372
Footpaths New Footpaths 417 - - 417
Minor Improvements to Minor Improvements to 5,321 - - 5,321
Roading Network Network
Other Roading Projects Springs Flat Roundabout 4,170 - - 4,170
Parking Parking Renewals 230 - - 230
Roading Drainage Drainage Renewals 1,110 - - 1,110
Roading Subdivision Works Subdivision Works 52 - - 52
Contribution Contribution
Seal Extensions Seal Extensions - 1,061 - - 1,061
Unsubsidised
Sealed Road Pavement Sealed Road Pavement 4,134 - - 4,134
Rehabilitation Rehabilitation
Sealed Road Resurfacing Sealed Road Resurfacing 4,346 - - 4,346
Structures Component Structures Component 1,048 - - 1,048
Replacement Replacement
Traffic Signs & Signals Traffic Sign & Signal 890 - - 890
Renewals
Transportation Planning Transport Planning Studies & 261 - - 261
Studies & Strategies Strategies
Unsealed Road Metalling Unsealed Road Metalling 840 - - 840
Urban Intersection Urban Intersection Upgrades 2,085 (487) - 1,598
Upgrades
Transportation Total 29,699 (3,669) - 26,029
Water
Property Water Property Renewals 94 - - 94
Water Meters Water Meter Renewals 365 - - 365
Water Reservoirs Reservoir Rehabilitation - 188 - - 188
Programmed Work
26Programme Project LTP Net timing New/ Annual Plan
2019-20 differences (savings) 2019-20
$000 $000 $000 $000
Three Mile Bush Reservoir 156 - - 156
Additional Capacity
Water Reticulation Minor Projects - Emergency 313 - - 313
Works
Reticulation - Programmed 1,981 (750) (292) 938
Work
Waipu Water Reticulation 730 - (730) -
Water Treatment Plants SCADA Upgrade 1,042 - - 1,042
Treatment Plant Renewals - - 250 250
Treatment Plant Upgrades 21 - 700 721
Water Treatment Plant & 521 - - 521
Equipment Replacement
Whau Valley Water Whau Valley New Water 13,551 (3,762) 3,211 13,000
Treatment Plant Treatment Plant
Water Total 18,961 (4,512) 3,139 17,588
Solid Waste
Recycling Recycling Bins Purchase - 650 - 650
Transfer Stations Stormwater Projects - - 175 - 175
Programmed Work
Solid Waste Total - 825 - 825
Wastewater
Laboratory Laboratory Equipment 21 - - 21
Renewals & Upgrades
Wastewater Asset Wastewater Assessment 44 - - 44
Management
Wastewater Network Hikurangi Sewer Network 2,085 - (1,000) 1,085
Upgrade
Sewer Network Renewal 1,407 - - 1,407
Sewer Network Upgrades 1,222 (470) - 752
Wastewater Pump Stations Wastewater Pump Station 110 - - 110
Remote Monitoring
Wastewater Pump Station 405 - - 405
Renewals
Wastewater Treatment Wastewater Reticulation 42 - - 42
Plants Upgrade
Wastewater Treatment Plant 862 200 - 1,062
Renewals
Wastewater Treatment Plant 2,339 (200) - 2,139
Upgrades
Wastewater Total 8,537 (470) (1,000) 7,067
27Programme Project LTP Net timing New/ Annual Plan
2019-20 differences (savings) 2019-20
$000 $000 $000 $000
Stormwater
Stormwater Asset Stormwater Catchment 500 50 - 550
Management Management Plans &
Assessments
Stormwater Improvements Stormwater Renewals 1,070 - - 1,070
Stormwater Upgrades 290 - - 290
Stormwater Total 1,860 50 - 1,910
Flood Protection
Flood Protection Total - - - -
Community Facilities and Services
Civil Defence
Civil Defence & Emergency Civil Defence Emergency 5 - - 5
Management Management Equipment
Renewals
Tsunami Signage 36 - - 36
Tsunami Sirens Renewals 18 - 36 54
Civil Defence Total 59 - 36 95
Community Development
CCTV Network CCTV Upgrades & 136 - - 136
Improvements
Council-Owned Community Buildings 213 31 - 243
Community Buildings Renewals & Improvements
Pensioner Housing Pensioner Housing Renewals 688 120 - 808
& Improvements
Sense of Place Community Led 418 276 - 694
Development
Community Development Total 1,454 426 - 1,880
Libraries
Digital Council Library IT Equipment 104 - - 104
Library Asset Renewals Library Renewals 5 - - 5
Library Books Book Purchases 674 - - 674
Libraries Total 784 - - 784
Parks & Recreation
Cemeteries Cemeteries Renewals 204 - - 204
Coastal Structures Coastal Structures Renewal 804 - - 804
Neighbourhood & Public Neighbourhood & Public - 153 - 153
Gardens Gardens Level of Service
Neighbourhood & Public 801 432 - 1,233
Gardens Renewals
28Programme Project LTP Net timing New/ Annual Plan
2019-20 differences (savings) 2019-20
$000 $000 $000 $000
Playgrounds & Skateparks Playgrounds & Skateparks 120 533 - 653
Level of Service
Playgrounds & Skateparks 188 - - 188
Renewals
Sense of Place Parks Interpretation 44 - - 44
Information
Pohe Island Development 1,313 193 - 1,507
Public Art 44 - - 44
Town Basin - Conversion of 3,648 (600) - 3,048
Carpark to Park
Waterfront Programme - - 570 570
Whangarei City Centre Plan 1,188 - - 1,188
Implementation
Sportsfields & Facilities Sport & Recreation Growth 894 (472) - 423
Sport & Recreation Level of 89 - - 89
Service
Sport & Recreation Renewals 1,233 - - 1,233
Tikipunga Soccer Hub 52 - - 52
Walkways and Tracks Walkway & Track Renewals 489 - - 489
Parks & Recreation Total 11,112 239 570 11,922
Venue and Events Whangarei
Forum North Venue Forum North Venue 23 100 - 123
Renewals
Forum North Venue 90 - - 90
Upgrades
Northland Events Centre NECT Building Renewals 151 - - 151
Venue and Events Whangarei Total 263 100 - 363
Community Facilities and Services Total 13,673 766 606 15,044
29Programme Project LTP Net timing New/ Annual Plan
2019-20 differences (savings) 2019-20
$000 $000 $000 $000
Planning and Regulatory
Services
Dog Pound Dog Pound Renewals 1,415 (1,215) - 200
Planning and Regulatory Services Total 1,415 (1,215) - 200
Governance and Strategy
Commercial Property Parihaka Transmission Mast - 900 - 900
Upgrade
Port Road Site Remediation - 100 - 100
District Development District Development 271 - (271) -
Projects
New Airport Evaluation New Airport Evaluation 2,321 (1,938) - 383
Governance and Strategy Total 2,592 (938) (271) 1,383
Support Services
Business Improvement Business Improvement 104 - - 104
Projects
Business Support Business Support Projects 104 - - 104
Civic Buildings Furniture Renewals 21 - - 21
Civic Centre Civic Centre 15,194 (7,194) - 8,000
Council Vehicle Council Vehicle 219 45 - 264
Replacements Replacements
Digital Council Asset Management Software 822 402 - 1,224
Upgrade
CiA Upgrade 417 565 - 982
Computer Tech for Building, - 10 - 10
Animal Control & Parking
Corporate Performance - 155 - 155
Management
Customer Access - Online 466 (466) - -
Services
Decision Support System - 161 - 161
Development
Digital District Plan and 506 (506) - -
Policies Online
Digital Platform - 1,033 - 1,033
Digitisation of Records 244 81 - 325
Electronic LIMs 605 (605) - -
IT Equipment New 52 8 - 60
IT Equipment Replacement 625 - - 625
IT Network Upgrades - - 110 110
30Programme Project LTP Net timing New/ Annual Plan
2019-20 differences (savings) 2019-20
$000 $000 $000 $000
Minor ICT Projects 83 - - 83
Mobility Technology - 336 - - 336
Building
Upgrade Kete SharePoint 261 - - 261
Support Services Total 20,059 (6,310) 110 13,859
Projects Total 96,795 (15,474) 2,584 83,905
Breakdown of Net Timing Differences $000
Less Brought Forward to 2018/19 (7,234)
Plus Carry Forward to 2019/20 21,375
Plus Brought Forward to 2019/20 from future years 3,436
Less Carry Forward to future years (33,050)
Total net timing differences (15,474)
3132
Draft
financial
prudence
benchmarks

             33
Annual plan disclosure
statement
FOR PERIOD COMMENCING 1 JULY 2019
What is the purpose of this statement?
The purpose of this statement is to disclose Council’s planned financial performance in relation to various benchmarks to
enable the assessment of whether Council is prudently managing its revenues, expenses, assets, liabilities, and general
financial dealings.
The Council is required to include this statement in its long-term plan in accordance with the Local
Government (Financial Reporting and Prudence) Regulations 2014 (the regulations). Refer to the regulations
(www.legislation.govt.nz) for more information, including definitions of some of the terms used in this statement.
Benchmark Limit Planned Met
Rates affordability benchmarks
Income 70% 55% Yes
Increases 5.3% 5.1% Yes
Debt affordability benchmarks
External debt 175% 94% Yes
Net interest to rates revenue 25% 7% Yes
External debt per capita $2,241 $1,599 Yes
Balanced budget benchmark 100% 102% Yes
Essential services benchmark 100% 145% Yes
Debt servicing benchmark 15% 4.9% Yes
34RATES AFFORDABILITY BENCHMARKS
Council meets the rates affordability benchmark if:
• its planned rates income equals or is less than each quantified limit on rates; and
• its planned rates increases equal or are less than each quantified limit on rates increases.
Rates (income) affordability
The following graph compares Council’s planned rates with a quantified limit on rates contained in the financial strategy
included in the long-term plan. The quantified limit is that rates income (excluding water) will not exceed 70% of total
revenue.
80%
70%
60%
Rates income / Total revenue (%)
50%
40%
30%
20%
10%
0%
2019-20 2019-20
LTP Year 2 Annual Plan
Quantified limit on rates income Proposed rates income (at or within limit) Proposed rates income (exceeds limit)
Rates (increases) affordability
The following graph compares Council’s planned rates increases with a quantified limit on rates increases contained in
the financial strategy included in the long-term plan. The quanitified limit is that the rates increase should not exceed
LGCI plus 2% plus 1% growth annually.
6%
5%
Rates increase (%)
4%
3%
2%
1%
0%
2019-20 2019-20
LTP Year 2 Annual Plan
Quantified limit on rates increase Proposed rates increase (at or within limit) Proposed rates increase (exceeds limit)
35DEBT AFFORDABILITY BENCHMARKS
Council meets the debt affordability benchmarks if its planned borrowing is within each quantified limit on borrowing.
External debt
The following graph compares Council’s planned debt with a quantified limit on borrowing contained in the financial
strategy included in this long-term plan. The quantified limit is that net debt be no higher than 175% of total revenue.
200%
175%
150%
External debt / total revenue (%)
125%
100%
75%
50%
25%
0%
2019-20 2019-20
LTP Year 2 Annual Plan
Quantified limit on debt Proposed external net debt (at or within limit) Proposed external net debt (exceeds limit)
Net interest to rates revenue
The following graph compares Council’s planned interest on debt with a quantified limit on borrowing contained in the
financial strategy included in the long-term plan. The quantified limit is that planned net interest should not exceed 25%
of total rates revenue.
30%
25%
Net Interest / rates revenue (%)
20%
15%
10%
5%
0%
2019-20 2019-20
LTP Year 2 Annual Plan
Quantified limit Actual interest to revenue (at or within limit) Actual interest to revenue (exceeds limit)
External debt per capita
The following graph compares Council’s planned debt with a quantified limit on borrowing contained in the financial
strategy included in the long-term plan. The quantified limit is that external net debt per capita be less than $2,241 .
$2,500
$2,000
Debt per capita ($)
$1,500
$1,000
$500
$0
2019-20 2019-20
LTP Year 2 Annual Plan
Quantified limit Actual external net debt per capita (at or within limit) Actual external net debt per capita (exceeds limit)
36BALANCED BUDGET BENCHMARK
The following graph displays Council’s planned revenue (excluding development contributions, financial contributions,
vested assets, gains on derivative financial instruments, and revaluations of property, plant and equipment) as a
proportion of planned operating expenses (excluding losses on derivative financial instruments and revaluations of
property, plant and equipment).
Council meets the balanced budget benchmark if its planned revenue equals or is greater than its planned operating
expenses.
110%
Revenue/ opearting expenditure (%)
105% 102%
100%
90%
80%
70%
60%
50%
40%
2019-20 2019-20
LTP Year 2 Annual Plan
Quantified limit Benchmark met Benchmark not met
ESSENTIAL SERVICES BENCHMARK
The following graph displays Council’s planned capital expenditure on network services as a proportion of expected
depreciation on those same network services.
Council meets the essential services benchmark if its planned capital expenditure on network services equals or is
greater than expected depreciation on network services.
200%
Capital expenditure/depreciation(%)
173%
160% 145%
120%
80%
40%
0%
2019-20 2019-20
LTP Year 2 Annual Plan
Quantified limit Benchmark met Benchmark not met
DEBT SERVICING BENCHMARK
The following graph displays Council’s planned borrowing costs as a proportion of planned revenue (excluding
development contributions, financial contributions, vested assets, gains on derivative financial instruments,and
revaluations of property, plant, or equipment). Because Statistics New Zealand projects Council’s population will grow
more slowly than the national population is projected to grow, it meets the debt servicing benchmark if its planned
borrowing costs equal or are less than 15% of its planned revenue.
16.0%
Borrowing cost/revenue (%)
14.0%
12.0%
10.0%
8.0%
6.0% 4.8% 4.9%
4.0%
2.0%
0.0%
2019-20 2019-20
LTP Year 2 Annual Plan
Quantified limit Benchmark met Benchmark not met
3738
Draft funding
impact
statement

                39
Funding impact statement
This statement sets out the information required by clause 20 of Schedule 10 of the Local Government Act 2002 to
assist ratepayers in understanding the impact of the Annual Plan. This statement should be read in conjunction with the
Revenue and Financing Policy prepared as part of the LTP 2018-28 process.
FINANCIAL DISCLOSURES
The Local Government Act requires disclosure of all sources of funding in a prescribed format. The Funding Impact
Statement showing the overall sources of funding, the amount of funds expected from each source and how those funds
will be applied has been included on page 14 of this document, which are to be read together with and form part of
this Funding Impact Statement.
RATES
These rates are based on the funding requirements set out in the Annual Plan together with the land values, capital
values and property numbers included in Council’s Rating Information Database.
GENERAL RATES
General rates are set under Section 13 of the Local Government (Rating) Act 2002. Council proposes to set a general
rate for all rateable land in our District.
The general rate will be made up of a uniform annual general charge (UAGC) and a value-based general rate.
Value based general rates
The value-based general rate will be assessed on the land value of each rateable rating unit in our District.
The general rate will be set on a differential basis based on the category of land use or, in certain circumstances, land
zoning. The objective of the differential rate is to achieve the total revenue sought from each category of land use, as set
out on page 42.
Where a property is used for more than one purpose the value of the property will be apportioned between the different
categories. Subject to legal rights of objection, it shall be at the sole discretion of Council to determine the use or
principal use of any rating unit.
The value-based general rate for a given property will be assessed by multiplying the land value of the rating unit by the
rate per dollar that applies to the category of land use.
DIFFERENTIAL BASIS
All rating units in our District are allocated to the most appropriate category based on the use to which the land is put or,
in specified circumstances, the land’s zone. The categories are:.
Category 1: Residential Category 4: Rural
All rating units which are used principally for residential or All rating units which are used principally for agricultural,
lifestyle residential purposes, including retirement villages, horticultural, forestry, pastoral or aquaculture purposes,
flats and apartments. or for the keeping of bees, poultry or other livestock.
Category 2: Multi-unit This does not include properties which are used for non-
All rating units used principally for residential purposes economic lifestyle residential purposes, generally 20
and on which is situated multi-unit type residential hectares or less and where the value of the land exceeds
accommodation that is used principally for temporary or the value of comparable farmland.
permanent residential accommodation for commercial Category 5: Commercial and industrial
purposes, including, but not limited to, hotels, boarding All rating units used principally for commercial, industrial
houses, motels, tourist accommodation, residential clubs, or related purposes or zoned for commercial, industrial
hostels, but excluding any properties which are licensed or related purposes and not otherwise categorised. For
under the Sale and Supply of Alcohol Act 2012. the avoidance of doubt, this category includes properties
Category 3: Miscellaneous properties licensed under the Sale and Supply of Alcohol Act 2012;
All rating units being any other property not otherwise and private hospitals and private medical centres.
categorised.
40Uniform Annual General Charge
The Uniform Annual General Charge (UAGC) is set under Section 15 of the Local Government (Rating) Act 2002. The
UAGC will be charged to each separately used or inhabited part (SUIP) of a rating unit. The effect of this is that where a
rating unit has more than one use or occupation, a separate charge will apply to each part.
The UAGC is calculated according to the judgement of Council on what is the proper balance between the fixed and
variable parts of the general rate and on any consequential impacts on individuals and groups of ratepayers.
A UAGC of $476.00 (including GST) will apply per SUIP for 2019-20. This is estimated to produce $20.544 million
(including GST) for 2019-20 and equates to 29 percent of general rates revenue and 17 percent of total rates revenue.
DEFINITION OF SEPARATELY USED OR INHABITED PART
OF A RATING UNIT
A separately used or inhabited part is defined as:
• any part of a property (rating unit) that is separately used or occupied, or is intended to be separately used or
occupied by any person, other than the ratepayer, having a right to use or inhabit that part by virtue of a tenancy,
lease, license, or other agreement
• any part of a rating unit that is separately used, or occupied, or intended to be separately used or occupied by the
ratepayer.
Examples include:
• each separate shop or business activity on a rating unit
• each occupied or intended to be occupied dwelling, flat, or additional rentable unit (attached or not attached) on a
rating unit
• individually tenanted flats, including retirement units, apartments and town houses (attached or not attached) or
multiple dwellings on Māori freehold land on a rating unit
• each block of land for which a separate title has been issued, even if that land is vacant.
41GENERAL RATES FOR THE 2019-20 FINANCIAL YEAR
Total general rates required for 2019-20 are $70.323 million GST inclusive. The differential rate in the dollar for each
category of land use is set to achieve the share of the total revenue sought from each category. The percentage share of
total general rates allocated to each category of land use for 2019-20 is all:
Residential properties 61.49%
Multi-unit properties 0.21%
Miscellaneous properties 0.30%
Rural properties 9.50%
Commercial and industrial properties 28.50%
Total 100%
The process by which the differential rate in the dollar for each category is calculated is set out below.
The amount projected to be collected from UAGCs in each land category is deducted from the total revenue sought from
each category. The balance required from each category is divided by total land value of land in that category to establish
the cents in the dollar required to achieve the revenue sought from that category. The relationship or differential between
the categories will be the result of these calculations.
Details of charges and the amount of revenue sought for the 2019-20 year is:
Value-based general rates Uniform Annual General Total general
Charge rates
Basis of assessment: Per $ of Basis of assessment: Per
land value separately used or inhabited
part of a rating unit
TYPE OF RATE Rate or Revenue Rate or Revenue Revenue
charge 2019- sought 2019- charge 2019- sought 2019- sought 2019-
20 (GST 20 (GST 20 (GST 20 (GST 20 (GST
inclusive) inclusive) inclusive) inclusive) inclusive)
Residential category $0.0023036 24,523,000 $476.00 18,722,000 43,245,000
Multi-Unit category $0.0046073 124,000 $476.00 22,000 146,000
Rural category $0.0031177 5,860,000 $476.00 820,000 6,680,000
Commercial and Industrial category $0.0154187 19,144,000 $476.00 897,000 20,041,000
Miscellaneous category $0.0023036 128,000 $476.00 83,000 211,000
Total 49,779,000 0,544,000 70,323,000
42TARGETED RATES FOR THE 2019-20 FINANCIAL YEAR
Targeted rates are set under Section 16 of the Local Government (Rating) Act 2002. Targeted rates are used where
a Council service provides a specific activity or a benefit to a specific group of people and consequently it is these
beneficiaries that are charged the cost of providing the service. It may apply to all ratepayers or a specific group of
ratepayers.
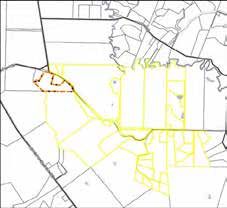
Roading schemes
Targeted rates are set for specific activities under Section 16 of the Local Government Rating Act 2002 and apply to
properties within a defined area of benefit. Rates for the schemes noted below recover a contribution of the costs of
capital works over a five-year period. The maps show the area of benefit and therefore the area of rateable land, in
relation to each roading scheme on each map, all properties on the streets marked in yellow are rateable in respect of
that roading scheme.
ROADING – SEAL EXTENSIONS – ROADING – SEAL EXTENSIONS – MCKINLEY
WHANGARURU NORTH ROAD ROAD
The sealing of Whangaruru North Road was undertaken by The sealing of McKinley Road was undertaken by Council
Council and a portion of the costs were to be recovered by and a portion of the costs were to be recovered by those in
those in the area of benefit. the area of benefit.
The costs were to be recovered by way of a targeted rate The costs were to be recovered by way of a targeted rate
over five years as a fixed amount per rating unit of $575.00. over five years as a fixed amount per rating unit of $575.00.
This is estimated to produce $17,250 for 2019-20. 2019- This is estimated to produce $22,425 for 2019-20. 2019-
20 is the fifth year of this charge. 20 is the fifth year of this charge.
Whangaruru North Road – Area of benefit McKinley Road – Area of benefit
43Sewerage disposal rate
The activity for which the targeted rate is set is the operation and maintenance of the sewerage disposal system. The
targeted rate will be set and assessed per separately used or inhabited part of a rating unit (as defined on page 41)
where the SUIP is connected to Council’s wastewater system. The targeted rate is set on a differential basis. Residential
connections will pay a fixed amount regardless of the number of toilet pans or urinals. Other premises, i.e. non-
residential, will pay a fixed charge per toilet pan or urinal.
Details of rates for and the amount of revenue sought from, targeted rates for sewage disposal are:
TYPE OF RATE BASIS OF ASSESSMENT RATE OR REVENUE
CHARGE 2019- SOUGHT 2019-
2020 (GST 2020 (GST
INCLUSIVE) INCLUSIVE)
Total $21,833,000
Residential category Per separately used or inhabited part of $741.00 $17,618,000
a rating unit
Other-non residential Per toilet pan or urinal $482.00 $4,215,000
District-wide refuse management rate
The activity funded by this targeted rate is the provision of refuse services not funded by user charges at transfer stations
or the per bag charge (paid by stickers or official rubbish bags) for refuse collected at the kerbside. The targeted rate will
be applied on a uniform basis to all rateable properties and assessed to all separately used or inhabited parts of a rating
unit (as defined on page 41).
It funds kerbside and other recycling, litter bins, clearing of refuse from parks/reserves and streets, roadside rubbish,
dealing with hazardous wastes, removing abandoned vehicles and the seasonal clean-ups required at beaches and other
tourist locations. Costs associated with Council’s waste minimisation programme are also included.
Also included is the cost of staffing transfer stations to ensure appropriate waste management of hazardous substances
and to recover material such as steel and timber to minimise the items that would normally be dumped as waste through
the landfill. These are services that benefit the whole District rather than individual users of our District’s rubbish
collection and disposal services.
A uniform targeted rate of $187.00 (including GST) will apply per SUIP (as defined at page 41) for 2019-20. This is
estimated to produce $8.086 million (including GST) for 2019-20.
44Water rate
The activity for which the targeted rate is set is for the catchment, storage, treatment and distribution of water
throughout various parts of our District. A targeted rate set under section 19 of the Local Government (Rating) Act
2002 will apply for water consumption based on water consumed as recorded by a water meter on a per cubic metre
basis. The targeted rate under section 19 will be calculated as a fixed charge per unit (cubic metre) of water consumed
(“Volumetric consumption charge”).
A fixed targeted rate set under section 16 of the Local Government (Rating) Act 2002 will apply to all connected and
metered properties (“Supply charge”). This is in addition to the volumetric consumption charge.
A fixed targeted rate set under section 16 of the Local Government (Rating) Act 2002 will apply per SUIP of a rating unit
for those premises where consumption of water is not recorded through a meter, but the property is connected to any
of our District’s water supply systems (“Uniform charge (unmetered)”). A further supply charge is not applied where the
uniform unmetered water charge is set.
A fixed targeted rate set under section 16 of the Local Government (Rating) Act 2002 will apply per SUIP of a rating unit
for availability of water (“Availability charge”) where premises are capable of being connected to the water supply as they
are situated within 100 metres of any public water supply reticulation system, but are not connected.
Targeted rates for back flow prevention apply to all properties which have a back-flow preventer connected. The revenue
will be used for the monitoring and maintenance of the back-flow preventers. The rate will be assessed on the size of the
back-flow preventer.
DETAILS OF RATES FOR AND THE AMOUNT OF REVENUE SOUGHT FROM, TARGETED RATES FOR
WATER
Type of rate Basis of assessment Rate or charge Revenue sought
2019-20 (GST 2019-20 (GST
inclusive) inclusive)
Water rate $17,305,000
Volumetric consumption charge Volume of metered water consumed per $2.26 N/A
cubic meter
Supply charge (metered) Provision of service per separately used $34.50 $903,000
or inhabited part of a rating unit
Availability charge Availability of service per separately used $34.50 $7,000
or inhabited part of a rating unit
Uniform charge (unmetered) Provision of service per separately used $474.00 $37,000
or inhabited part of a rating unit
Backflow preventer charge Provision of service per connection based N/A
on the nature of connection
15/20mm connection $80.42
25mm connection $81.52
32mm connection $96.44
40mm connection $98.69
50mm connection $102.39
80/100mm connection $257.89
150mm connection $301.90
200mm connection $500.01
45Flood protection rate
HIKURANGI SWAMP RATING DISTRICTS
A targeted rate applies to properties in the Hikurangi Swamp Special Rating District. The area of land within this special
rating district is divided into classes based on location and area of benefit or effect of the scheme on a property. The
activity funded by this targeted rate is to defray the costs of the Hikurangi Swamp Major Scheme set out on page 50 of
the LTP.
The targeted rate is based on a differential graduated scale according to the class of the property and the area of land
within the rating unit. Some properties may have areas of land which fall into several classes and the rating differentials
are applied accordingly. The targeted rate per hectare for each category (class) of land is set out on the diagram below.
A second targeted rate applies to properties in the Hikurangi Swamp Drainage Rating District. The activity funded by
this targeted rate is to defray the costs and charges of the Hikurangi Swamp draining scheme. The targeted rate applies
differentially to two categories of land: class A and class F as set out on the Drainage District Diagram below. The
targeted rate for each category is based on a differential graduated scale according to the class of the property and
the area of land within the rating unit. The targeted rate per hectare for each category (class) of land is set out on the
diagram below.
The Hikurangi Swamp rates are projected to increase 8% this year to fund additional expenditure required to maintain
the effectiveness of the scheme as outlined in the LTP.
HIKURANGI DRAINAGE DISTRICT HIKURANGI MAJOR SCHEME
Henty Rd Henty Rd
Pu
Pu
t Rd t Rd
Fla Fla
hip
hip
Tapuhi Tapuhi
uh
uh
t ree
ree
i
i
Rd
Rd
Teat
Tea
Puhipuhi Puhipuhi
Rd Rd
nui nui
ik a ik a
K ai K ai
M
M
ine
ine
Rd
Rd
Kaimamaku Kaimamaku
W
W
aio
aio
Rd
Rd
tu
tu
d d
s
s
B lo
B lo
R R
bb
bb
ad ad
Gi
Gi
He He
ck R
ck R
gs gs
Pi Pi
Opuawhanga Opuawhanga
d
d
Rd
Rd
Hukerenui Hukerenui
eill
eill
Waiotu Waiotu
O 'N
O 'N
d Byl d Byl
d
d
Whakapara hR es Whakapara hR es
st R
st R
SH 1 ort Rd SH 1 ort Rd
N N
Ju b
Ju b
d ki d ki
Ne
Ne
ui R Rd na
na ui R Rd na
na
re n re n
il e
il ee
nnan a nnan a
ws
ws
ke Le Wh ke Le Wh
e
Hu Hu
Oto nga
Oto nga
Mc Mc
Cro
Cro
Rd
Rd
Otonga Otonga
-Marua
-Marua
Riponui Riponui
onui Rd
Marua onui Rd
Marua
Rip Rip
Rd
Rd
McB
McB
Heaton Rd
Heaton Rd
L ow
Lo
Waro Waro
we
reen Rd
reen Rd
Wilsonville Wilsonville
eR
G
G
om
om
O t ak ai ra
O t ak ai ra
Rd
d
ez
ez
Ki n
Ki n
Rd
Rd
Tanekaha Tanekaha
gS
gS
ngi Rd
ngi Rd
Jo
Jo
M ar u M ar u
George S t
George S t
t
t
r
r
a Rd a Rd
Hikurangi Hikurangi
da
da
n
n
d
d
Va
Va
R
R
mp mp
lle
lle
d
d
S wa S wa
kR
kR
y
y
Rd
Rd
Otakairangi Otakairangi
oo
oo
R d R d
er er
hbr
hbr
ow Rd ow Rd
ins ins
Rus
Rus
M Ma M Ma
Ma
ta rau
Apotu Ma
ta rau
Apotu
A po
A po
Rd Rd
Rd Rd
tu
tu
Rd Rd
oing in oing in
Ma Ma
Kauri Kauri
G
G
Rd
Rd
Crane Rd
Crane Rd
Matarau Matarau
Ngararatunua Ngararatunua
Rd
Rd
h
h
Churc
Churc
WHANGAREI WHANGAREI
Land Information New Zealand, Eagle Technology Land Information New Zealand, Eagle Technology
Class
A F
0
A4 Scale: 1:160,000
1.25 2.5
(C) Crown Copyright Reserved
5 km
´ Class
A B C D E F
0
A4 Scale: 1:160,000
1.25 2.5
(C) Crown Copyright Reserved
5 km
´
Date Saved: 8/02/2018 DZ:HS Date Saved: 8/02/2018 DZ:HS
46You can also read