Highly Sensitive Fluorescence Sensor for Carrageenan from a Composite Methylcellulose/Polyacrylate Membrane - MDPI
←
→
Page content transcription
If your browser does not render page correctly, please read the page content below
sensors
Letter
Highly Sensitive Fluorescence Sensor for
Carrageenan from a Composite
Methylcellulose/Polyacrylate Membrane
Riyadh Abdulmalek Hassan 1,2 , Lee Yook Heng 1,3, * and Ling Ling Tan 3
 1    School of Chemical Sciences and Food Technology, Faculty of Science and Technology, Universiti
      Kebangsaan Malaysia, 43600 UKM Bangi, Selangor Darul Ehsan, Malaysia; rydh1974@yahoo.com
 2    Department of Chemistry, Faculty of Science, Ibb University, P.O. Box: 70270 Ibb, Yemen
 3    Southeast Asia Disaster Prevention Research Initiative (SEADPRI-UKM), Institute for Environment and
      Development (LESTARI), Universiti Kebangsaan Malaysia, 43600 UKM Bangi, Selangor Darul Ehsan,
      Malaysia; lingling@ukm.edu.my
 *    Correspondence: leeyookheng@yahoo.co.uk; Tel.: +60-3-8921-3356; Fax: +60-3-8921-5410

 Received: 12 June 2020; Accepted: 13 July 2020; Published: 4 September 2020

 Abstract: Carrageenans are linear sulphated polysaccharides that are commonly added into
 confectionery products but may exert a detrimental effect to human health. A new and simpler way
 of carrageenan determination based on an optical sensor utilizing a methylcellulose/poly(n-butyl
 acrylate) (Mc/PnBA) composite membrane with immobilized methylene blue (MB) was developed.
 The hydrophilic Mc polymer membrane was successfully modified with a more hydrophobic acrylic
 polymer. This was to produce an insoluble membrane at room temperature where MB reagent could
 be immobilized to build an optical sensor for carrageenan analysis. The fluorescence intensity of
 MB in the composite membrane was found to be proportional to the carrageenan concentrations in a
 linear manner (1.0–20.0 mg L−1 , R2 = 0.992) and with a detection limit at 0.4 mg L−1 . Recovery of
 spiked carrageenan into commercial fruit juice products showed percentage recoveries between 90%
 and 102%. The optical sensor has the advantages of improved sensitivity and better selectivity to
 carrageenan when compared to other types of hydrocolloids. Its sensitivity was comparable to most
 sophisticated techniques for carageenan analysis but better than other types of optical sensors. Thus,
 this sensor provides a simple, rapid, and sensitive means for carageenan analysis.

 Keywords: fluorescence sensor; polymer blend; carrageenan; methylene blue

1. Introduction
     The common use of carrageenan in food as an additive is safe at its intended level of load.
However, the excess amount of carrageenan in food may cause harm to human health. Carrageenans
have been extensively applied in the food and beverage industry, serving as thickener, stabilizer,
emulsifier, and gelling agents. The safety of carrageenans for use in food was confirmed at the 57th
meeting of the JECFA-Joint Food and Agriculture Organization of the United Nations/World Health
Organization Expert Committee in Food Additives [1]. According to the JECFA, only degraded
carrageenans are associated with adverse health effects, and should not be used as food additives.
Recently, carrageenans have become an essential ingredient in pharmaceutical industries to reduce
the amount of polymorphic transformation in tableting [2], and to produce controlled release matrix
tablets [3] to stimulate interactions with drugs for modified release systems [4].
     The purity and composition of carrageenan in commercial food samples may vary significantly.
Therefore, there is a need to authenticate their composition and concentrative properties in various
edible products. Various approaches are available for assessment of carrageenan content in

Sensors 2020, 20, 5043; doi:10.3390/s20185043                                   www.mdpi.com/journal/sensors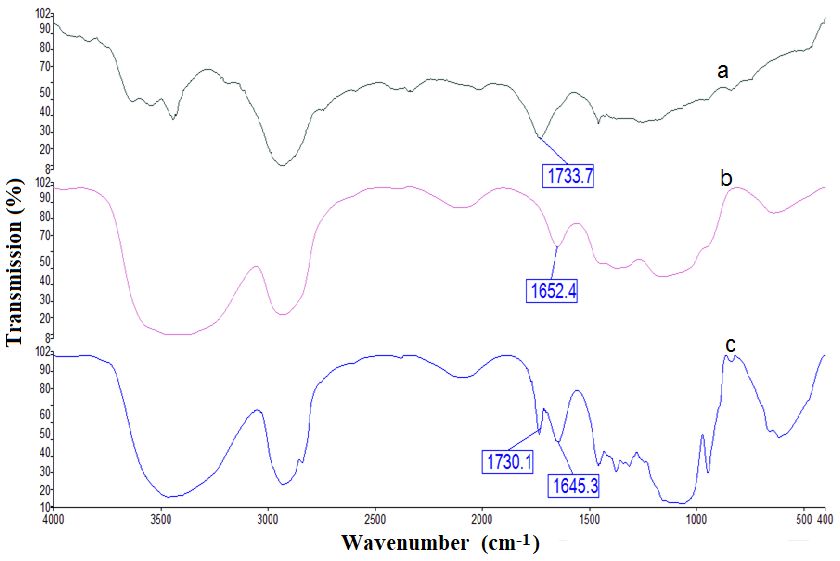
Sensors 2020, 20, 5043                                                                              2 of 14

foods, especially confectionery goods. These include colorimetric staining for total carrageenan
determination, light microscopy, immunological detection, calorimetry, fluorimetry, electrophoresis,
nuclear magnetic resonance (NMR), and chromatographic methods. Chromatographic methods are
more often used, e.g., gas−liquid chromatography (GLC), high-performance liquid chromatography
(HPLC) spectroscopy, gel permeation coupled with inductively coupled plasma-atomic emission
(GPC/ICP-AES) [5], and high-performance anion-exchange chromatography coupled with chemical or
enzymatic depolymerization procedures [6,7].
       Spectrophotometric methods for the detection of carrageenan in the liquid state are based on
cationic dyes, which are hydrophilic substances for reaction with anionic carrageenan. The requirement
of digestion and addition of chemicals are the major problems in this method. The linear detection range
of the spectrophotometric method for carrageenan is normally narrow and in the low concentration
range. ELISA and dot-blot assay were used to assay kappa- (κ) carrageenan and were proved to be
sensitive and specific with no cross-reaction with other thickeners. The limit of κ-carrageenan detected
was in the range of 0.001–0.010% w/w in foodstuffs [8]. Another report using a sandwich ELISA for the
determination of κ-carrageenan could yield a linear concentration range of 16−256 ng mL−1 [9], while
the electrophoretic method using laser-excited indirect fluorescence (LIF) means with Schiff’s reagent
and toluidine blue staining for iota- (ι) and κ-carrageenan could give a mass limit of detection of 95 ng.
This indirect LIF method using fluorescein for carrageenan also provided a low detection limit in the
picogram range in some cases [10].
       Many of the methods mentioned above have demonstrated a satisfactory lower detection limit for
the analysis of carrageenan in foods. However, the disadvantages of using these conventional analytical
instruments are the need for complicated sample pre-treatment and elaborate operating procedures,
hence the need for skillful operators. Such techniques are also expensive and time-consuming due to
the need for complicated isolation, derivatization, and purification before the analysis can be performed.
Furthermore, some of these reported methods are not specific, and supplementary methods must be
used to determine the type of carrageenan correctly.
       In this work, a new optical sensor based on the change in fluorescence emission intensity was
developed to determine the concentration of carrageenan at a low limit of detection that is comparable
to many sophisticated instrumental techniques. The optical change was induced through strong
chemical interactions rather than simple physical adsorption, resulting in fluorometric changes
(i.e., chemoresponsive). A methylcellulose/poly(n-butyl acrylate) (Mc/PnBA) composite membrane
was employed for the first time in the development of such an optical sensor. The polyacrylate
membrane was blended with the Mc polymer to increase the overall hydrophobicity of the membrane
to improve its usefulness for carrageenan sensing. Methylene blue (MB) was used as a carrageenan
sensing fluorogenic dye and immobilized in the composite membrane. Carrageenan was detected
by the electrostatic interaction between the cationic site of immobilized MB, i.e., alkylamino (=NR2 + )
functional group and anionic site of carrageenan, i.e., the negatively charged sulphate (−SO4 − )
functional group. As a result of such interaction, the blue-colored membrane turned purple due to the
formation of a metachromatic complex. This will lead to a change in the fluorescence intensity, as well
as the color of the sensor membrane. The MB could be immobilized in the Mc/PnBA membrane likely
via electrostatic interactions, hydrogen bonding, and van der Waals forces [11] between the membrane
structure and MB molecules. Figure 1 illustrates the chemical reaction between the immobilized MB
and carrageenan, and the chemical structure of the Mc/PnBA composite membrane.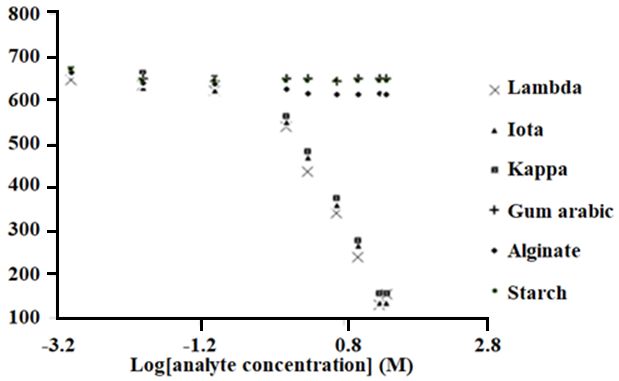
Sensors 2020, 20, 5043                                                                                             3 of 14

Sensors 2018, 18, x FOR PEER REVIEW                                                                                3 of 16

                Schematicrepresentation
     Figure 1. Schematic
     Figure                 representationof of aa chemical
                                                   chemical reaction
                                                             reaction between
                                                                       between aa cationic
                                                                                  cationic functional
                                                                                           functional group
                                                                                                         group of of
                                   +
     methylene blue (MB) (=NR22 ) )andandanionic
                                           anionicfunctional
                                                     functional group                      −
                                                                group of carrageenan (SO44 ),),and
                                                                                                and the
                                                                                                     the chemical
                                                                                                         chemical
     methylene                    +                                                        −

     structures of
     structures of methylcellulose
                   methylcellulose and
                                     and poly(n-butyl
                                          poly(n-butyl acrylate).
                                                         acrylate). Blue-colored
                                                                    Blue-colored membrane
                                                                                 membrane changed
                                                                                              changed to to aa light
                                                                                                               light
     purple hue
     purple  hue after
                 after the addition of a carrageenan solution.

2. Experimental
2. Experimental
2.1. Materials and Apparatus
2.1. Materials and Apparatus
      Tris-HCl buffer was prepared by using tris(hydroxymethyl) aminomethane (THAM, Acros
     Tris-HCl buffer was prepared by using tris(hydroxymethyl) aminomethane (THAM, Acros
Organics, Belgium, USA) in Milli-Q water, and hydrochloric acid 37% (HCl, Riedel-de Haen, Seelze,
Organics, Belgium, USA) in Milli-Q water, and hydrochloric acid 37% (HCl, Riedel-de Haen, Seelze,
Germany) was added to adjust the Tris-HCl buffer to the required pH. A stock solution of methylene
Germany) was added to adjust the Tris-HCl buffer to the required pH. A stock solution of
blue (MB, R & M Chemicals, Selangor, Malaysia) at 1 mM was prepared in Milli-Q water and stored at
methylene    blue (MB, R & M Chemicals, Selangor, Malaysia) at 1 mM was prepared in Milli-Q water
4 ◦ C in the dark. Dilution of MB solution was done using dimethylformamide (DMF). The analytical
and stored at 4 °C in the dark. Dilution of MB solution was done using dimethylformamide (DMF).
grade of iota- (ι, Sigma, Laramie, USA), lambda- (λ, Sigma), and kappa- (κ, Fluka, Buchs, Switzerland)
The analytical grade of iota- (ι, Sigma, Laramie, USA), lambda- (λ, Sigma), and kappa- (κ, Fluka,
carrageenans including calcium alginate, starch, and gum Arabic from Fluka was prepared by dissolving
Buchs, Switzerland) carrageenans including calcium alginate, starch, and gum ◦Arabic from Fluka
50 mg of each carrageenan sample in 50 mL of Milli-Q water in a water bath at 50 C. Other chemicals
was prepared by dissolving 50 mg of each carrageenan sample in 50 mL of Milli-Q water in a water
were of analytical reagent grade and used without purification.
bath at 50 °C. Other chemicals were of analytical reagent grade and used without purification.
      The fluorescence intensity of MB was observed by using an optical Perkin Elmer Fluorimeter
     The fluorescence intensity of MB was observed by using an optical Perkin Elmer Fluorimeter
4002 at an emission wavelength of 675 nm. The preparation of acrylic polymer was done by
4002 at an emission wavelength of 675 nm. The preparation of acrylic polymer was done by
photopolymerization reaction by utilizing an UV exposure unit (RS Ltd., Cambridge, UK), which
photopolymerization reaction by utilizing an UV exposure unit (RS Ltd., Cambridge, UK), which
comprised four light tubes (15 W UV) transmitting ultraviolet (UV) radiation at an absorption
comprised four light tubes (15 W UV) transmitting ultraviolet (UV) radiation at an absorption
wavelength of 350 nm under continuous nitrogen gas purging. Chemical characterization of the
wavelength of 350 nm under continuous nitrogen gas purging. Chemical characterization of the
Mc/PnBA polymer blend was performed on a Perkin Elmer Spectrum GX FTIR microscope using
Mc/PnBA polymer blend was performed on a Perkin Elmer Spectrum GX FTIR microscope using
the KBr disc method. A scanning electron microscope (SEM, LEO 1450VP) was used to characterize
the KBr disc method. A scanning electron microscope (SEM, LEO 1450VP) was used to characterize
the morphology of the composite membrane. The successful immobilization of MB on the Mc/PnBA
the morphology of the composite membrane. The successful immobilization of MB on the Mc/PnBA
composite membrane was confirmed by SEM-EDS (scanning electron microscope with an energy
composite membrane was confirmed by SEM-EDS (scanning electron microscope with an energy
dispersive X-ray spectrometer) that detected the presence of MB dye in the film sample.
dispersive X-ray spectrometer) that detected the presence of MB dye in the film sample.
2.2. Preparation of Methylcellulose/Polyacrylate Optical Sensor Membrane
2.2. Preparation of Methylcellulose/Polyacrylate Optical Sensor Membrane
      Polymers used in this study were methylcellulose (Mc) and poly(n-butyl acrylate) (PnBA). Polymer
solutions of 2%used
      Polymers         in thisand
                  w/v PnBA      study  were
                                   Mc in THFmethylcellulose
                                               were prepared (Mc)    and separately
                                                                and used poly(n-butyl  acrylate) (PnBA).
                                                                                    in stoppered  conical
Polymer solutions of 2% w/v PnBA and Mc in THF were prepared and used separately in stoppered
conical flasks. Similarly, different polymer blend compositions were prepared by mixing
appropriate quantities of stock solutions of Mc and PnBA, and their blend compositions at 100/0,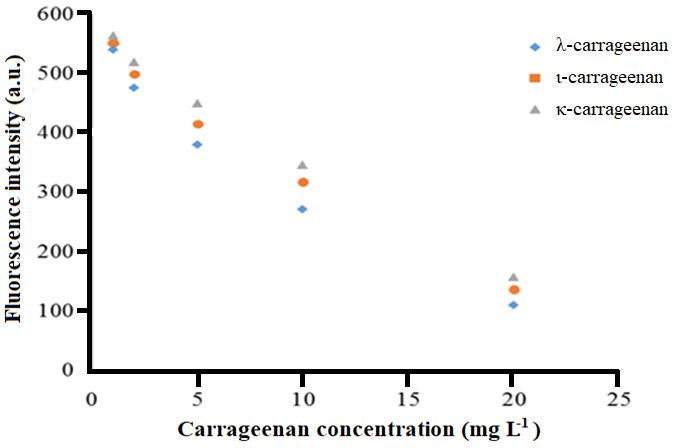
Sensors 2020, 20, 5043                                                                            4 of 14

flasks. Similarly, different polymer blend compositions were prepared by mixing appropriate quantities
of stock solutions of Mc and PnBA, and their blend compositions at 100/0, 80/20, 70/30, 50/50, 30/70,
and 20/80% (v/v) were prepared in THF under vigorous stirring for one day. The MB immobilization
process was carried out by mixing 100 µL of the MB in DMF to 2 mL of polymer blend solution and
stirred overnight. Finally, 20 µL of MB immobilized polymer blend was dropped onto a flat piece of a
glass surface, and the sensor was left overnight at room temperature (25 ◦ C). The dried sensor was
then washed thoroughly with Tris-HCl buffer (pH 7) and kept at 25 ◦ C in a dark and dry place before
further usage.

2.3. Optimization of the Carrageenan Fluorescence Sensor Response
     The concentration−effect study on the immobilized MB was carried out by immobilizing MB dye
onto the composite membrane at different concentrations from 0.01 to 0.15 mM, and the fluorescence
intensity of the sensor membrane was measured at 675 nm. For the effect of pH on the analytical
sensing performance of the carrageenan fluorescence sensor, three series of λ-carrageenan solutions
in the concentration range of 5.0–20.0 mg L−1 were prepared in 20 mM Tris-HCl buffer at pH 4,
pH 7, and pH!9, and examined with the optode. The buffer concentration effect was conducted by
preparing 10.0 mg L−1 λ-carrageenan in Tris-HCl buffer (pH 7) in the concentration range of 10−100 mM.
The linear response range of the optical sensor for κ-, ι-, and λ-carrageenans was determined using
0.001−25.000 mg L−1 carrageenan solution in 20 mM Tris-HCl buffer (pH 7). Anionic polysaccharides
such as starch, calcium alginate, and gum Arabic in the concentration range of 0.001–25.000 mg L−1
were also prepared to determine the selectivity of the optical fluorescence sensor. Sensor performance
toward carrageenan determination was evaluated by spike-and-recovery tests using spiked standards
of λ-carrageenan at 5.0, 10.0, and 15.0 mg L−1 . The sample used was commercial beverages such as
pineapple, apple, and orange juices. The fluorescence response of the sensor was measured at 675 nm.
All the sensor characterization experiments were performed in triplicate.

3. Results and Discussion

3.1. Morphology of the Methylcellulose/Poly(n-butyl acrylate) Composite Membrane
      The uniformity of the dispersion of solution-cast films of different Mc/PnBA blend compositions
was examined through SEM, and examples of the micrographs are shown in Figure 2. At a low
content of PnBA in the composite membrane, Mc/PnBA was dispersed on the film completely and
showed a single phase. Conversely, when the PnBA content was increased, the films showed a rough
surface, which can be observed in the SEM image [12]. For instance, at 80/20% (v/v) Mc/PnBA blend
composition, the film showed a good smooth surface. Due to the hydrophilic character of Mc, which
tends to dissolve in water, a high amount of Mc composition in the polymer blend would cause the
formation of pores on the surface. By contrast, large agglomerates were observed for the blended
sample containing higher PnBA content, e.g., 20/80% (v/v) Mc/PnBA, which showed incompatibility
between Mc and PnBA (Figure 2f). The composite membrane at 70/30% (v/v) Mc/PnBA was chosen as
the best film composite because it possessed good adhesion properties and insolubility in water [13,14].
The mixture of these two polymers gave a smooth and coherent surface with a good dispersion on the
glass slide. The 70/30% (v/v) Mc/PnBA polymer blend had improved the membrane properties in terms
of membrane water insolubility. Thus, there was no disintegration of the membrane in water. Besides,
a slightly higher amount of Mc had allowed more interaction of the resulting membrane with MB dye
and improved the immobilization process. This can subsequently be beneficial for carrageenan binding.
Sensors 2020, 20, 5043 5 of 14
Sensors 2018, 18, x FOR PEER REVIEW 5 of 16
Figure 2. SEM
Figure micrographs
2. SEM of methylcellulose/poly(n-butyl
micrographs of methylcellulose/poly(n-butyl acrylate) (Mc/PnBA)
acrylate) polymer
(Mc/PnBA) blendblend
polymer with
various
with Mc/PnBA compositions:
various Mc/PnBA (a) 100/0,
compositions: (a)(b) 80/20,
100/0, (b)(c) 70/30,
80/20, (c) (d) 50/50,
70/30, (e) 30/70,
(d) 50/50, and (f)and
(e) 30/70, 20/80.
(f) 20/80.
TheThe
immobilization
immobilizationof MBof inMB theinpolymer composite
the polymer of 70/30%
composite of (v/v) Mc/PnBA
70/30% could be performed
(v/v) Mc/PnBA could be
via performed
hydroxyl (-OH) functional groups of the Mc polymer. This polymer composite
via hydroxyl (-OH) functional groups of the Mc polymer. This polymer composite contains a large
number of -OH
contains groups
a large from
number ofMc,
-OHand thesefrom
groups functional
Mc, andgroups could bindgroups
these functional to MBcould
by physicochemical
bind to MB by
interactions, which are
physicochemical mainly viawhich
interactions, ion exchange or complex
are mainly via ionformation
exchange between
or complex dyesformation
and the functional
between
dyes and the functional groups of Mc [15]. This is due to the fact that cellulose and its
groups of Mc [15]. This is due to the fact that cellulose and its derivatives are relatively inert except their derivatives
are relatively
hydroxyl groups,inert
which except their hydroxyl
are responsible for thegroups,
majoritywhich arereactions
of the responsiblewithfor the majority
organic of the
and inorganic
reactions
reagents, andwith
thisorganic
leads toand inorganic
inter- reagents, and this
and intra-molecular leads to
hydrogen inter- and
bonding intra-molecular hydrogen
[16].
bonding [16].
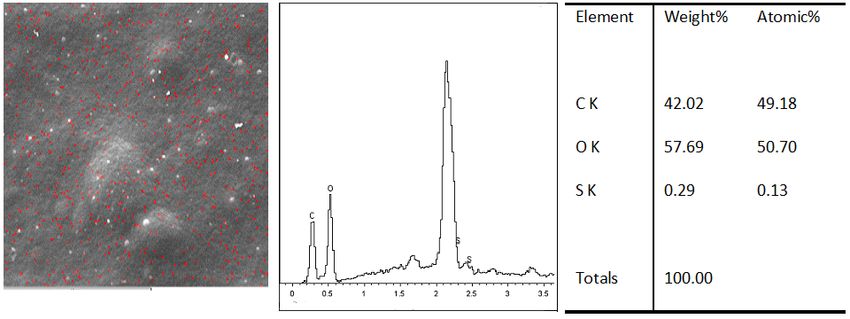
The immobilization of MB on the blended composite is to prevent aggregation and self-quenching
The immobilization
of the MB molecule, of MB the
which decreases on fluorescence
the blended intensity.
composite Theis successful
to preventimmobilization
aggregation and of MBself-
on
the quenching of the MB
Mc/PnBA composite filmmolecule,
was confirmed whichbydecreases
SEM-EDXthe thatfluorescence intensity. ofThe
detected the presence MB successful
in the film
immobilization
sample. of MB on containing
MB and carrageenan the Mc/PnBA composite
sulfur elements film
werewas confirmed
mapped by SEM-EDX
by scanning electron that detected
microscopy
the presence of MB in the film sample. MB and carrageenan containing
(SEM) with the SEM-EDS spectrum for polymer composite-MB (Figure 3a). MB concentration sulfur elements were
mapped by scanning electron microscopy (SEM) with the SEM-EDS spectrum for polymer
was chosen for the best intensity to be suitable as a carrageenan sensor. The SEM-EDS spectrum
composite-MB (Figure 3a). MB concentration was chosen for the best intensity to be suitable as a
showed the presence of sulfur element after addition of 100 mg L−1 of λ carrageenan (Figure 3b).
carrageenan sensor. The SEM-EDS spectrum showed the presence of sulfur element after additionSensors 2020, 20, 5043 6 of 14
Sensors
of 100 2018,
mg L18,
−1 x
ofFOR PEER REVIEW(Figure 3b). The SEM-EDS spectrum exhibited an increment in the
λ carrageenan 6 of 16
The SEM-EDS spectrum exhibited an increment in the sulfur element of the film after addition of the
sulfur element
λ-carrageenan sample.of the film after addition of the -carrageenan sample.
(a)
(b)
Figure 3. (a) SEM-EDS spectrum analysis result of S, O elements in the MB immobilized Mc/PnBA
polymer composite, and (b) the presence of S element on the MB-Mc/PnBA membrane before and after
addition of 100 mg L−1 λ -carrageenan.
3.2. FTIR Analysis of Mc/PnBA Composite Membrane
The superimposed FTIR spectra of PnBA, Mc, and Mc/PnBA polymers are shown in Figure 4.
The presence of characteristic bands in the final polymer blend (Figure 4c), which were initially present
in the respective starting materials, i.e., PnBA (Figure 4a) and Mc (Figure 4b), confirmed the formation
of the Mc/PnBA polymeric composite. In Figure 4c, the absorption band at 1160 cm−1 is associated
with the anti-symmetric stretching vibration of the C-O-C bridge of Mc. A broad O-H absorption band
at 3426 cm−1 and a sharp C=O absorption band of aldehyde appeared at 1645.3 cm−1 , also implying
the presence of(a)
Figure 3. Mc in the polymer
SEM-EDS blend. result
spectrum analysis The C=O ester
of S, O functional
elements group
in the MB from the
immobilized acrylic compound
Mc/PnBA
corresponds
polymertocomposite,
the absorption band
and (b) the at 1730.1
presence −1
cm [17].
of S element on the MB-Mc/PnBA membrane before and
after addition of 100 mg L−1 λ -carrageenan.
3.2. FTIR Analysis of Mc/PnBA Composite Membrane
The superimposed FTIR spectra of PnBA, Mc, and Mc/PnBA polymers are shown in Figure 4.
The presence of characteristic bands in the final polymer blend (Figure 4c), which were initially
present in the respective starting materials, i.e., PnBA (Figure 4a) and Mc (Figure 4b), confirmed the
formation of the Mc/PnBA polymeric composite. In Figure 4c, the absorption band at 1160 cm−1 is
associated with the anti-symmetric stretching vibration of the C-O-C bridge of Mc. A broad O-H
absorption band at 3426 cm−1 and a sharp C=O absorption band of aldehyde appeared at 1645.3 cm−1,also implying
Sensors 2018, 18, the presence
x FOR of Mc in the polymer blend. The C=O ester functional group from 7the
PEER REVIEW of 16
Sensors 2020,
acrylic 20, 5043 corresponds to the absorption band at 1730.1 cm−1 [17].
compound 7 of 14
Figure4.4.FTIR
Figure FTIRspectra
spectrafor
for (a)
(a) PnBA,
PnBA, (b)
(b) Mc,
Mc, and
and (c)
(c) Mc/PnBA
Mc/PnBA composite
composite membranes.
membranes.
3.3.
3.3.Optimization
OptimizationofofImmobilized
ImmobilizedMB
MBConcentration
Concentration
The
Theemission
emission peaks of theofimmobilized
peaks the immobilizedMB in theMB composite
in the membrane
composite atmembrane
different concentrations
at different
from 0.01 to 0.15 mM were measured with the fluorimeter to obtain the maximum
concentrations from 0.01 to 0.15 mM were measured with the fluorimeter to obtain the maximum fluorescence signal at
675 nm. The fluorescence
fluorescence signal at 675intensity
nm. The of the immobilized
fluorescence MB wasoffound
intensity to increase from
the immobilized MB0.01wastofound
0.05 mMto
asincrease
a largerfrom
amount 0.01ofto
MB fluorophore
0.05 mM as adye wasamount
larger bound to ofthe
MBcomposite
fluorophore membrane,
dye wasthus affording
bound to thea
higher fluorescence
composite membrane, emission (Figure 5).
thus affording It is important
a higher to note
fluorescence that MB
emission binding
(Figure is is
5). It immediate
importantand to
note that
requires noMB bindingstep,
incubation is immediate
whereby the andMB requires
compoundno incubation step, whereby
was physically attached onthethe
MBself-adhesive
compound
was physically
membrane, thereby attached on the
simplifying self-adhesive
the reagent membrane,
immobilization thereby
method [18].simplifying the reagent
As the concentration of
immobilization method [18]. As the concentration of immobilized MB increased
immobilized MB increased beyond 0.05 mM, the fluorescence signal gradually declined from 0.05 to beyond 0.05 mM,
the mM.
0.15 fluorescence
This might signal gradually
be due declined from effect
to the self-quenching 0.05 tobetween
0.15 mM. MBThis might be
monomers anddue to the
dimers at self-
high
MBquenching effectloading
concentration between MB
[19]. monomers
Therefore, 0.05and
mM dimers at high
immobilized MB MBwas concentration
used in the nextloading [19].
carrageenan
Therefore,
optical sensor 0.05 mM immobilized
optimization MB was used in the next carrageenan optical sensor optimization
experiments.
experiments.Sensors 2020, 20, 5043 8 of 14
Sensors 2018, 18, x FOR PEER REVIEW 8 of 16
Figure 5.
5. Effect
Effectofof immobilized
immobilized MBMB concentration
concentration on theon the fluorescence
fluorescence intensityintensity of the composite
of the Mc/PnBA Mc/PnBA
membrane. membrane.
composite Error bars represent data from
Error bars 3 identical
represent data sensor
from runs and triplicate
3 identical sensormeasurements of each.
runs and triplicate
measurements of each.
3.4. Effect of Buffer pH on the Carrageenan Optosensor Response
3.4. Effect of Buffer pHofonathe
The formation Carrageenan Optosensor
metachromatic complex is Response
dependent on the pH, ionized acidic groups,
and ionic strength of
The formation of the reaction medium
a metachromatic [20]. isThe
complex variation
dependent oninthe
pHpH,hasionized
an ionic strength
acidic impact
groups, and
ionic strength of the reaction medium [20]. The variation in pH has an ionic strength impact on via
on the adsorption interaction of MB cationic dye [21–23] and metachromatic complex formation the
electrostaticinteraction
adsorption interaction of dueMB to the changes
cationic dyein[21–23]
the ionic andstate of the polyanions’
metachromatic complex functional groups.
formation via
Besides, changes in pH can also influence the substrate binding with MB
electrostatic interaction due to the changes in the ionic state of the polyanions’ functional groups. and ultimately affects the
immobilization
Besides, changesreaction
in pH can of MB
also [21,24].
influenceThe thecolorimetric determination
substrate binding with MB of andcarrageenan and other
ultimately affects the
anionic hydrocolloids with MB dye in solution has been carried out by
immobilization reaction of MB [21,24]. The colorimetric determination of carrageenan and other Soedjak [24]. The anionic sites
of the hydrocolloids
anionic hydrocolloidsappearedwith MBtodye be inprimarily
solutionresponsible for theout
has been carried dye-binding
by Soedjak to[24].
formThe
the anionic
purple
metachromatic complexes (maximum absorption at 559 nm). The interaction
sites of the hydrocolloids appeared to be primarily responsible for the dye-binding to form the is assumed electrostatic
with
purple a 1:1 stoichiometriccomplexes
metachromatic ratio between the anionic
(maximum sites andatthe559
absorption bound
nm).dye Themolecules.
interaction is assumed
The optical sensor based on the MB-immobilized Mc/Pn-BA
electrostatic with a 1:1 stoichiometric ratio between the anionic sites and the bound membrane has been used
dye to determine
molecules.
λ-carrageenan in the concentration range of 5.0–20.0 mg L −1 in 20 mM buffer at various pHs. In acidic
The optical sensor based on the MB-immobilized Mc/Pn-BA membrane has been used to
pH, i.e., pHλ-carrageenan
4, the immobilized at =NR +
determine in theMB and λ-carrageenan
concentration range ofunderwent
5.0–20.0 mg protonation
L-1 in 20 mM 2 and
buffer sulfate
at various
functional groups, respectively. As the λ-carrageenan became
pHs. In acidic pH, i.e., pH 4, the immobilized MB and λ-carrageenan underwent protonationpartially uncharged at low pH [25],
at
it slowed down the electrostatic interaction between λ-carrageenan and
=NR2+ and sulfate functional groups, respectively. As the λ-carrageenan became partially uncharged MB. By contrast, under the
alkaline
at low pH conditions at pH 9,down
[25], it slowed both immobilized
the electrostatic MBinteraction
and λ-carrageenan
between were deprotonated,
λ-carrageenan and and
MB. theBy
reaction between optode and analyte was not chemically favored.
contrast, under the alkaline conditions at pH 9, both immobilized MB and λ-carrageenan wereThe most suitable pH condition for
the immobilized
deprotonated, andMBtheindicator
reactiondye to formoptode
between the metachromatic
and analyte was complex with a carrageenan
not chemically favored.polyanion
The most
was at pH 7, as an obvious color change from blue to purple hue
suitable pH condition for the immobilized MB indicator dye to form the metachromatic complex was observed at near-neutral
conditions
with [26–28]. As
a carrageenan Table 1 indicates,
polyanion was at pH the7,highest sensitivity
as an obvious of the
color optical
change sensor
from bluetoward carrageenan
to purple hue was
−1
observed at near-neutral conditions [26–28]. As Table 1 indicates, the highest sensitivityatofpH
detection within the linear λ-carrageenan concentration range of 5.0–20.0 mg L occurred the7
with a correlation coefficient (R 2 ) obtained at 0.9923. Thus, all subsequent optimization studies were
optical sensor toward carrageenan detection within the linear λ-carrageenan concentration range of
carried out
5.0–20.0 mgatLpH 7 using 20
−1 occurred atmM
pH Tris-HCl
7 with abuffer.
correlation coefficient (R2) obtained at 0.9923. Thus, all
subsequent optimization studies were carried out at pH 7 using 20 mM Tris-HCl buffer.Sensors 2020, 20, 5043 9 of 14
Table 1. The R2 and sensitivity values of the fluorescence optosensor in the determination of
Sensors 2018, 18, x FOR PEER REVIEW 9 of 16
5.0−20.0 mg L−1 λ-carrageenan at different pH conditions.
pH Value R2 Sensitivity λ-Carrageenan Linear Concentration Range (mg L−1 )
Table 1. The R2 and sensitivity values of the fluorescence optosensor in the determination of 5.0−20.0
4 L−1 λ-carrageenan
mg −407
0.9815 at different pH conditions. 5.0–20.0
7 0.9923 −564 5.0–20.0
9 pH value0.9419R2 Sensitivity
−434 λ-carrageenan linear concentration
5.0–20.0 range (mg L−1)
4 0.9815 −407 5.0−20.0
7 0.9923 −564 5.0−20.0
3.5. Effect of Buffer Concentration
9
3.5. Effect of Buffer 0.9419
Concentration −434 5.0−20.0
The buffer capacity is an important variable that must be optimized to ensure adequate ionic
The buffer capacity is an important variable that must be optimized to ensure adequate ionic
strength and charge balance of the reaction buffer to permit a repeatable and maximum fluorescence
strength and charge balance of the reaction buffer to permit a repeatable and maximum
response to be obtainable by the proposed optical sensor. In this study, the fluorescence intensity of
fluorescence response to be obtainable by the proposed optical sensor. In this study, the
the sensor in theintensity
fluorescence detection of of
the10.0 mginL−1
sensor theλ-carrageenan
detection of 10.0using
mg varying concentrations
L−1 λ-carrageenan of Tris-HCl
using varying
buffer (pH 7) was determined. Figure 6 represents the buffer concentration
concentrations of Tris-HCl buffer (pH 7) was determined. Figure 6 represents the buffer effect on the fluorescence
response trend of effect
concentration the optosensor. The highest
on the fluorescence fluorescence
response response
trend of the was The
optosensor. obtained
highestatfluorescence
20 mM Tris-HCl
buffer, after which
response was the fluorescence
obtained at 20 mMintensity dramatically
Tris-HCl dropped
buffer, after whichbetween 20 and 100 intensity
the fluorescence mM Tris-HCl
dramatically
buffer (pH 7). The dropped between
high ionic 20 and
strength of 100
the mM Tris-HCl
buffer buffer
appeared (pH 7). the
to distort The ionic
high ionic strength of
atmospheres of both
the buffer appeared to distort the ionic atmospheres of both ionic reactant and analyte.
ionic reactant and analyte. It resulted in the conformational change in the polyanion (the charged It resulted in
the conformational
polymer change
molecule) [29,30], andinthis
the has
polyanion (the charged
significantly polymer
changed molecule) of
the selectivity [29,30], and this chemical
the selective has
significantly changed the selectivity of the selective chemical layer toward its target analyte.
layer toward its target analyte.
Figure
Figure 6. The6. effect
The effect of Tris-HCl
of Tris-HCl bufferbuffer concentration
concentration (pH(pH 7)the
7) on on fluorescence
the fluorescence response
response of the
of the optical
sensoroptical
toward sensor
the toward
detectiontheof
detection
10 mg L of−110λ-carrageenan
mg L−1 λ-carrageenan
at 675 at
nm.675 nm.
3.6. Optical
3.6. Optical SensorSensor toward
toward Carrageenan
Carrageenan Detection
Detection
As the concentrations of the carrageenan increased, greater electrostatic interaction between
As the concentrations
immobilized of the carrageenan
MB and carrageenan increased,
polyanions occurred. greater
A light purpleelectrostatic interaction
metachromatic complex between
was
immobilized
formed. MBThe and carrageenan
complexation polyanions
between occurred.
immobilized MB andA light purple metachromatic
carrageenan was formed between complexthe was
formed. Thefunctional
cationic complexationgroup between
of MB, i.e.,immobilized
=NR2+, and the MB and carrageenan
negatively was formed
charged sulphate functionalbetween
group the
cationic functional group
of carrageenan. of MB, i.e.,
The proposed =NR
optode can+ , and the negatively charged sulphate functional group
of of
2 detect carrageenan by the fluorescence intensity change
the MB immobilized in the composite membrane. As in Figure 7a, the fluorescence
carrageenan. The proposed optode can detect carrageenan by the fluorescence intensity change of intensity of the
the MBoptical sensor decreased
immobilized upon reaction
in the composite with the increase
membrane. in carrageenan
As in Figure concentrationsintensity
7a, the fluorescence from 0.001 of the
and 1.000 mg L . This was attributed to less electrostatic interaction between immobilized cationic
−1
optical sensor decreased upon reaction with the increase in carrageenan concentrations from 0.001
MB and anionic carrageenan where most of the immobilized MB molecules remained uncomplexed,
and 1.000 mg L−1 . This was attributed to less electrostatic interaction between immobilized cationic
thus giving a higher fluorescence emission response. The fluorescence sensor was found to respond
MB and anionic carrageenan where most of the immobilized MB molecules remained uncomplexed,
linearly to the increasing carrageenan concentration between 1.0 and 20.0 mg L−1 (Figure 7a) with a
thus giving a higher
good linear fluorescence
R2 value of close to emission
+ 1 (Table response. The fluorescence
2) and reproducibility (relativesensor wasdeviation,
standard found toRSD)respond
linearly to the increasing carrageenan concentration between 1.0 and 20.0 mg L−1 (Figure 7a) with aSensors 2020, 20, 5043 10 of 14 good linear R2 value of close to + 1 (Table 2) and reproducibility (relative standard deviation, RSD) of
Sensors 2020, 20, 5043                                                                                 11 of 14

     The R2 is the linear correlation coefficient between the fluorescent intensity of the sensor and the
concentrations of the carrageenan measured (Tables 1 and 2). A value of R2 = 0.99 means that 99%
of the two sets of data are correlated in a certain range of concentrations. Thus, the concentration is
strongly correlated with the fluorescent intensity in a linear manner. The R2 value can be calculated
by a correlation statistical program via the data processing software Excel Spreadsheet from a plot of
fluorescent intensity against the carrageenan concentrations.
     The sensitivity of the sensor as mentioned in Tables 1 and 2 is defined by the response of the
sensor, i.e., the fluorescent intensity per unit change in concentration. Thus, this is a value of the slope
from the linear plot of intensity vs. carrageenan concentration over a certain concentration range.
Thus, the larger the magnitude of the slope (or sensitivity), the more sensitive the sensor response
(fluorescence) toward changes in concentration.
     Besides, the optical sensor showed slightly different response factors for the detection of the
respective κ-, ι-, and λ-carrageenans according to the molar sulfate content of carrageenans at pH 7
with 20 mM Tris-HCl buffer. No change in response of the sensor was observed toward other anionic
polysaccharides such as starch, calcium alginate, and gum Arabic even at different concentrations.
This indicates that little reaction occurred between the immobilized MB and those polysaccharides.
Thus, the optical sensor was selective toward the detection of carrageenan (Figure 7b). The selectivity
behavior of the sensor is similar to a study on carrageenan and other anionic hydrocolloids analysis
using MB by the UV-Vis spectrophotometric method [24].

3.7. Recovery Studies of the Fluorescence Carrageenan Optical Sensor
     A recovery study was performed to validate the performance of the proposed carrageenan
optical sensor by using real samples spiked with a known amount of the analyte. A fixed amount
of -carrageenan was added into pineapple, apple, and orange juices. The concentration used was
between the linear range of the sensor calibration curve. Based on the data tabulated in Table 3,
the sensor showed percentage recoveries of carrageenan ranged between 90% and 102%. This suggests
that common additives that are found in the commercial juice products have little or no interference
effect on the analytical sensing performance of the carrageenan fluorescence sensor.

      Table 3. Recovery of carrageenan from spiked food samples using fluorescence carrageenan optosensor
      (n = 3).

  Spiked -Carrageenan      Found(mg L−1 )             Found (mg L−1 )              Found (mg L−1 )
                                             *R (%)                      *R (%)                      *R (%)
  Concentration(mg L−1 )   Pineapple Juice             Apple Juice                  Orange Juice
              5                  4.7           94            4.5          90             4.9           98
             10                 10.2          102            9.4          94             10           100
             15                 14.9           99           14.6          97            14.8           99
                                                *R = Recovery.

     To our best knowledge, so far, no one has reported on the carrageenan detection using
the fluorometry approach. Thus, it is not possible to compare to a similar fluorescent sensor
reported. However, it is still fair to compare to other optical sensors based on reflectance or UV-Vis
spectrophotometry (Table 4) because they also employed immobilized MB as a sensing material [31].
Most of the current methods for carrageenan analysis involve instrumental procedures, e.g.,
electrophoresis, chromatography methods, and spectrophotometric methods. Therefore, equipment
and chemical consumables contributed to the high cost for carrageenan analysis. Our estimation of
the sensor cost is about 10 times lower than that for an average cost of analysis via instrumentation
techniques. Clearly, the fluorescence sensor based on the MB-immobilized Mc/PnBA composite
membrane demonstrated an LOD performance toward carrageenan with a significantly lower detection
limit by a factor of approximately 2000. Hence, the fluorescence-based carrageenan sensor has achieved
a low LOD comparable to that of most established methods, such as immunoassay and electrophoresis,
for the analysis of carrageenan in foodstuffs.
Sensors 2020, 20, 5043 12 of 14
Table 4. A comparison of analytical performance for optical determination of carrageenan.
Sensitivity Dynamic Linear Detection Limit
Sensing Element Transducer R2 Cost Reference
(∆units/decade) Range (mg L−1 )
MB Reflectometry 377.5 0.980 80.0–5000.0 mg L−1 80.00 Low Ling and Lee [31]
MB Reflectometry 279.9 0.983 100.0–5000.0 mg L−1 100.00 Low Ling and Lee [31]
MB UV-Vis spectrophotometry (0.2–2.0) × 10−3 % High Soedjak [24]
MB and Toluidine Blue UV-Vis spectrophotometry >0.996 2.0–60.0 mg L−1 High Ziolkowska et al. [32]
MB Fluorometry −312.0 0.992 1.0–20.0 mg L−1 0.04 Low Present studySensors 2020, 20, 5043 13 of 14
4. Conclusions
The hydrophilic methylcellulose polymer was successfully modified with a more hydrophobic
poly(n-butyl acrylate) to yield an insoluble membrane. This membrane functioned as a fluorescence
sensor for assay of carrageenan where methylene blue could be immobilized in the Mc/PnBA polymer
blend. The fluorescence carrageenan sensor demonstrated good selectivity and sensitivity toward
carrageenan, and has a high potential for simple, rapid, and selective analysis of carrageenan in food
samples. Therefore, extensive sample pre-treatment may not be required as compared to most of
the currently used techniques. The sensitivity of the optical sensor is comparable to many standard
methods for carrageenan analysis of various food items.
Author Contributions: R.A.H.: Investigation, Writing—Original Draft, Visualization, Methodology. L.Y.H.:
Project administration. L.Y.H. and L.L.T.: Supervision, Conceptualization, Funding acquisition, Writing—review
& editing. All authors have read and agreed to the published version of the manuscript.
Funding: Research funding from projects FRGS/1/2012/ST01/UKM/01/1, GP-5179-2019, and GP-5179-2020 are
acknowledged. Financial assistance from the Fakulti Sains & Teknologi, Universiti Kebangsaan Malaysia is
much appreciated.
Conflicts of Interest: The authors declare no conflict of interest.
References
1. Kim, S.K. Handbook of Marine Macroalgae: Biotechnology and Applied Phycology; John Wiley & Sons, Chichester,
West Sussex: Chichester, UK; Wiley-Blackwel: Hoboken, NJ, USA, 2011.
2. Schmidt, A.G.; Wartewig, S.; Picker, K.M. 2003. Potential of carrageenans to protect drugs from polymorphic
transformation. Eur. J. Pharm. Biopharm. 2003, 56, 101–110. [CrossRef]
3. Keppeler, S.; Ellis, A.; Jacquier, J.C. Cross-linked carrageenan beads for controlled release delivery systems.
Carbohydr. Polym. 2009, 78, 973–977. [CrossRef]
4. Thommes, M.; Kleinebudde, P. Use of kappa-carrageenan as alternative pelletisation aid to microcrystalline
cellulose in extrusion/spheronisation. II. Influence of drug and filler type. Eur. J. Pharm. Biopharm. 2006, 63,
68–75. [CrossRef] [PubMed]
5. James, N.B. Gums and Hydrocolloids, Carbohydrates in Food, 2nd ed.; CRC Press: Boca Raton, FL, USA, 2006;
pp. 209–231.
6. Campo, V.L.; Kawano, D.F.; Silva, D.B., Jr.; Carvalho, I. Carrageenans: Biological properties, chemical
modifications and structural analysis–A review. Carbohydr. Polym. 2009, 77, 167–180. [CrossRef]
7. Venugopal, V. Marine Products for Healthcare: Functional and Bioactive Nutraceutical Compounds from the Ocean;
CRC Press: Boca Raton, FL, USA, 2008.
8. Williams, D.W.; Patel, P.O.; Shepherd, R.; Vreeland, V. Detection of Carrageenan (and Alginate) in Baby
Foods by Dot-Blot and Enzyme-Labelled Immunoassays. Leatherhead Food Research, Ed.; British Food
Manufacturing Industries Research Association: Leatherhead, UK, 1994; p. 717.
9. Arakawa, S.; Ishihara, H.; Nishio, O.; IsomuraJ, S. A sandwich enzyme-linked immunosorbent assay for
kappa-carrageenan determination. Sci. Food. Agric. 1991, 57, 135–140. [CrossRef]
10. Richmond, M.D.; Yeung, E.S. Development of laser-excited indirect fluorescence detection for
high-molecular-weight polysaccharides in capillary electrophoresis. Anal. Biochem. 1993, 210, 245. [CrossRef]
[PubMed]
11. Manna, S.; Roy, D.; Saha, P.; Gopakumar, D.; Thomas, S. Rapid methylene blue adsoprtion using modified
lignocellulosic materials. Process Safety Environ. 2017, 107, 346–356. [CrossRef]
12. Ulianas, A.; Lee, Y.H.; Musa, A. A Biosensor for Urea from Succinimide-Modified Acrylic Microspheres
Based on Reflectance Transduction. Sensors 2011, 11, 8323–8338. [CrossRef]
13. Ulianas, A.; Lee, Y.H.; Musa, A.; Lau, H.; Zamri, I.; Tan, L.L. A Regenerable Screen-printed DNA Biosensor
Based on Acrylic Microsphere-Gold Nanoparticle Composite for Genetically Modified Soybean Determination.
Sens. Actuators B Chem. 2014, 190, 694–701. [CrossRef]
14. Rahman, M.; Lee, Y.H.; Futra, D.; Chew, P.C.; Zulkafli, A.R.; Tan, L.L. A Highly Sensitive Electrochemical DNA
Biosensor from Acrylic-Gold Nano-Composite for the Determination of Arowana Fish Gender. Nanoscale
Res. Lett. 2017, 12, 474–485. [CrossRef]Sensors 2020, 20, 5043 14 of 14
15. Jin, Y.; Zhang, Y.; Lu, Q.; Cheng, X. Biosorption of methylene blue by chemically modified cellulose waste.
J. Wuhan Univ. Technol. 2014, 29, 817–823. [CrossRef]
16. Dias, S.L.L.P.; Fujiwara, S.T.; Gushikem, Y.; Bruns, R.E. Methylene blue immobilised on cellulose surfaces
modified with titanium dioxide and titanium phosphate: Factorial design optimisation of redox properties.
J. Electroanal. Chem. 2002, 531, 141–146. [CrossRef]
17. Nur Syarmim, M.N.; Tan, L.L.; Lee, Y.H.; Chong, K.F.; Saiful Nizam, T. Acrylic microspheres-based optosensor
for visual detection of nitrite. Food Chem. 2016, 207, 132–138. [CrossRef]
18. Roberts, M.A.; Quemener, B. Measurement of carrageenans in food: Challenges, progress, and trends in
analysis. Trends Food Sci. Technol. 1999, 10, 169–181. [CrossRef]
19. Ukhanov, K.Y.; Flores, T.M.; Hsiao, H.S.; Mohapatra, P.; Pitts, C.H.; Payne, R. Measurement of cytosolic Ca2+
concentration in Limulus ventral photoreceptors using fluorescent dyes. J. Gen. Physiol. 1995, 105, 95–116.
[CrossRef]
20. Dell’antone, P.; Colonna, R.; Azzone, G.F. The Membrane Structure Studied with Cationic Dyes.
Eur. J. Biochem. 1972, 24, 553–565. [CrossRef]
21. Al-Degs, Y.S.; El-Barghouthi, M.I.; El-Sheikh, A.H.; Walker, G.M. Effect of solution pH, ionic strength,
and temperature on adsorption behavior of reactive dyes on activated carbon. Dyes Pigm. 2008, 77, 16–23.
[CrossRef]
22. Hu, Y.; Guo, T.; Ye, X.; Li, Q.; Guo, M.; Liu, H.; Wu, Z. Dye adsorption by resins: Effect of ionic strength on
hydrophobic and electrostatic interactions. Chem. Eng. 2013, 228, 392–397. [CrossRef]
23. Davidson, G.F. The acidic properties of cotton cellulose and derived oxycelluloses. Part II. the absorption of
methylene blue. J. Tex. Inst. 1948, 39, 65–86. [CrossRef]
24. Soedjak, H.S. Colorimetric Determination of Carrageenans and Other Anionic Hydrocolloids with Methylene
Blue. Anal. Chem. 1994, 66, 4514–4518. [CrossRef]
25. Pinheiro, A.C.; Bourbon, A.I.; Quintas, M.A.C.; Coimbra, M.A.; Vicente, A.A. K-carrageenan/chitosan
nanolayered coating for controlled release of a model bioactive compound. Innov. Food Sci. Emerg. Technol.
2012, 16, 227–232. [CrossRef]
26. Ohashi, S.; Ura, F.; Ochi, T.; Iida, H.; Ukai, S. Interaction of thaumatin with carrageenans. I. Effects of pH,
temperature and competing cations. Food Hydrocoll. 1990, 4, 105–119. [CrossRef]
27. Graham, H.D. Quantitative aspects of the interaction of carrageenan with cationic substances. I. interaction
with methylene blue. J. Food Sci. 1960, 25, 720–730. [CrossRef]
28. Eliasson, A.C. Hydrocolloids/Food Gums: Analytical Aspects, Carbohydrates in Food; CRC Press: Boca Raton, FL,
USA, 2006.
29. Tan, J.S.; Schneider, R.L. Dye binding and its relation to polyelectrolyte conformation. J. Phys. Chem. 1975, 79,
1380–1386. [CrossRef]
30. Nandini, R.; Vishalakshi, B. A Study of Interaction of Methyl Orange with Some Polycations. J. Chem. 2012,
9, 1–14. [CrossRef]
31. Ling, Y.P.; Lee, Y.H. Reflectance based sensor for carrageenan utilising methylene blue embedded acrylic
microspheres. Sens. Actuators B Chem. 2014, 192, 247–252. [CrossRef]
32. Ziolkowska, D.; Kaniewska, A.; Lmkiewicz, J.; Shyichuk, A. Determination of carrageenan by means of
photometric titration with methylene blue and toluidine blue dyes. Carbohydr. Polym. 2017, 165, 1–6.
[CrossRef]
© 2020 by the authors. Licensee MDPI, Basel, Switzerland. This article is an open access
article distributed under the terms and conditions of the Creative Commons Attribution
(CC BY) license (http://creativecommons.org/licenses/by/4.0/).You can also read