Journal of Environmental Management - PATh
←
→
Page content transcription
If your browser does not render page correctly, please read the page content below
Journal of Environmental Management 261 (2020) 110229
Contents lists available at ScienceDirect
Journal of Environmental Management
journal homepage: http://www.elsevier.com/locate/jenvman
Research article
Reverse osmosis performance on stripped phenolic sour water treatment –
A study on the effect of oil and grease and osmotic pressure
Pedro D.A. Bastos a, b, c, Maria Anto
�nio Santos b, Pedro Jorge Carvalho c, Jo~ao G. Crespo a, *
a
LAQV-REQUIMTE, DQ, FCT, Universidade NOVA de Lisboa, 2829-516, Caparica, Portugal
b
Sines Refinery, Petrogal S.A., 7520-952, Sines, Portugal
c
CICECO – Aveiro Institute of Materials, Universidade de Aveiro, Portugal
A R T I C L E I N F O A B S T R A C T
Keywords: Technologies for water recycling within oil refineries have been gaining interest at an extensive rate due to the
Refinery wastewater large volume of wastewater generated, high dependency of water and the progressive scarcity of this valuable
Phenols resource. Phenols are part of a specific class of organic pollutants that have been contributing to a low-quality
Nanofiltration
effluent in oil refineries due to their hazardous nature and strict environmental legislation associated. The
Reverse osmosis
reuse of stripped sour water within refineries is often blocked due to its rich phenolic content.
Water reuse
This study evaluates the retention of phenols in refinery wastewater through reverse osmosis (RO) at its major
source of emission, for water reclamation. The RO membrane selected exhibited rejections of up to 98% of
phenols and 99% of both chemical oxygen demand (COD) and total organic carbon (TOC). Permeate quality
remained intact despite flux decline caused by phenolic and hydrocarbon adsorption when the oil content, in the
feed, reached 771 ppm. The effluent’s low conductivity due to lack of salts led to minor osmotic pressure dif
ferences (less than 2.5 bar at a volume concentration factor of 3), therefore, showing appealing performances of
reverse osmosis filtration. Characterization of all permeates obtained from cross-flow filtration experiments
showed COD levels in line with water reuse quality standards for make-up water in cooling processes.
1. Introduction Aqueous refinery effluents encompass a diverse range of pollutants
including oil and grease, phenols, sulphides and ammonia. Regarding
Wastewater management from crude oil processing has been a key- the largest Portuguese oil refinery, located in Sines, with a capacity of
point of concern over the past few years due to environmental con around 220000 bpd of crude oil processing, it was reported that the
straints and regulations. Strict discharge limits have encouraged in main contributor of polar oil and grease was the spent caustic effluent
dustries to adopt new strategies for effluent treatment and water reuse. from the kerosene caustic washing unit (Santos et al., 2013). Among the
From a technological, environmental and economic point of view, these several contaminants that are controlled in the wastewater generated at
changes are challenging, requiring the development of sustainable, the Sines refinery, phenols are to be highlighted.
efficient and economically viable technologies to treat the effluents and Being involved in many industries, such as coke, oil refineries, resin
enable the reuse of resources. manufacturing, pharmaceuticals, pesticides, dyes and plastics, phenols
Oil refinery processes are known to be highly dependent on water, play an important role to what concerns environmental impact. Phenols
with the required amount of water depending on size, type of crude, are among the major hazardous compounds in industrial wastewater
products and complexity of the operations involved. Refining processes due to their poor biodegradability, high toxicity and ecological aspects,
for oil and sweetening of gases produce a large amount of wastewater, mainly on the aquatic environment (Mrayyan and Battikhi, 2005; Wake,
generally referred to as “process water” (Munirasu et al., 2016), which 2005), and by remaining in the environment for long periods of time and
has been in close contact with hydrocarbons. The large consumption of being fast consumers of oxygen. These concerns led national and inter
water leads to significant volumes of generated wastewater, reported to national environmental regulatory bodies to set stricter discharge limits
reach, for the petroleum refinery, 0.4–1.6 times the amount of the crude (Villegas et al., 2016), that are fostering the development and imple
oil processed (Diya’uddeen et al., 2011). mentation of more efficient treatments and sustainable processes.
* Corresponding author.
E-mail address: jgc@fct.unl.pt (J.G. Crespo).
https://doi.org/10.1016/j.jenvman.2020.110229
Received 28 November 2019; Received in revised form 29 January 2020; Accepted 30 January 2020
Available online 3 February 2020
0301-4797/© 2020 Published by Elsevier Ltd.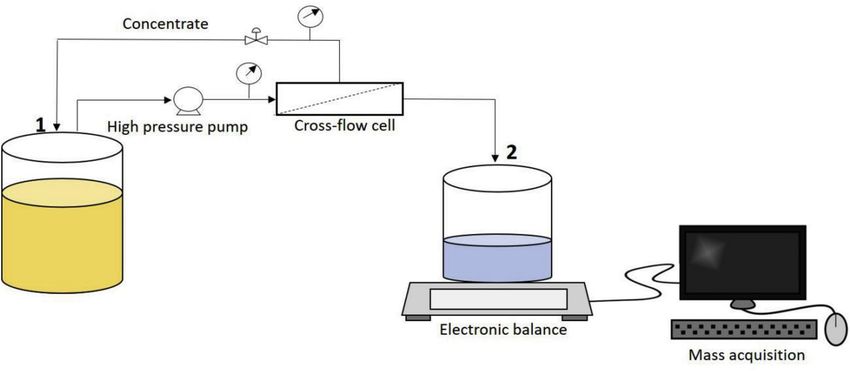
P.D.A. Bastos et al. Journal of Environmental Management 261 (2020) 110229
Phenol has been designated as a priority pollutant by the US Environ Therefore, a membrane filtration laboratory study on real stripped
mental Protection Agency (EPA) and the EU, with these agencies phenolic sour water treatment, over a representative operational period
establishing limits for wastewater discharge of 0.5 ppm for surface was conducted, where it was possible to witness the variability of the
waters and 1 ppm for the sewage system (Datta and Uslu, 2014). feed regarding its physico-chemical characteristics, such as oil and
Being in intimate contact with hydrocarbons, process water can be grease and explore their influence on the treatment performance using
divided into 4 main groups including sour water and process conden nanofiltration and reverse osmosis membranes, through analysis of
sates; desalter effluent; tank bottoms and spent caustic (Venkatesh, permeate flux and overall rejections.
2010). The largest source of sour water has been identified (Luke
Addington et al., 2011) as the steam stripping of the crude in the at 2. Materials and methods
mospheric and vacuum tower processing units. Fluidized catalytic
crackers (FCC), hydrodesulphurization units (HDS) and hydrocrackers 2.1. Stripped sour water and chemical analyses
also generate a significant amount of sour water. In FCC units, phenol is
produced from the reaction between cyclic hydrocarbons and steam Stripped sour water samples were collected directly from the effluent
along with other byproducts such as sulphides, ammonia and hydrogen of the sour water stripping unit of the cracking complex at the Sines
cyanide (Leprince, 2001; Tim Armstrong et al., 1996). Table 1 shows the refinery. Samples from the initial wastewater and permeates obtained
typical sour water contaminants in the feed and treated water, after after nanofiltration and reverse osmosis were analysed by standard
soluble ammonia, sulphide, and volatile compounds have been stripped methods for oil and grease and phenols concentration (SMEWW 5520 C/
(stripped water), denoting that phenols are hardly removed in sour F and SMEWW 5530D, respectively). COD was analysed by the LCI 500
water stripping units. cuvette kit (Hach Lange, GmbH, Germany) in agreement with ISO 15705
This issue of the non-strippable behavior of phenols in sour water and TOC was determined through a total carbon analyser TOC-VCSH
stripping is present in refining, such as cokers, crude distillation units (Shimadzu, Japan). Ammonia and phosphate content were analysed
and FCC units, along with other contaminants such as cyanide and by a SKALAR analyser. Turbidity values were acquired through a
sulphur (David and Stevens, 2008), unlike hydrotreaters and desulfur portable turbidity meter (Hanna Instruments, USA). Total dissolved
ization units, where phenols are not usually an issue in the wastewaters solids (TDS) and conductivity measurements were obtained by means of
generated, as they are not formed. a WTW portable conductivity meter. Salinity measurements were per
The concentration of phenols in stripped sour water has been re formed using a Sension þ EC7 Laboratory Conductivity Meter, (Hach,
ported between 190 and 537 ppm (G.Stoneburner, 1961; Richard J. USA).
Metcalf, 1957) (A.Dyke, 2000), denoting that the discharge without
adequate treatment will contribute to a low-quality effluent. However, 2.2. Membrane screening experiments through nanofiltration and reverse
most refineries use a well-known and reported treatment (Richard J. osmosis
Metcalf, 1957) to overcome this issue by reusing the stripped water as
wash water for desalters that in turn results in a portion of the phenol Membrane screening assays were conducted to address the differ
being extracted lowering its content in the wastewater stream. ence in efficiency of using nanofiltration and reverse osmosis regarding
Process condensates are wastewater streams that result from the rejections of COD from the stripped sour water. The membranes used in
condensation of vapours that have been in contact with oil products. this study along with their main characteristics are detailed in Table 2
Sour waters from FCC units are among these streams and emit a and were chosen based on the major phenolics, identified having mo
considerable amount of phenols, with concentrations ranging from 80 to lecular weights of up to 122 Da, found in real refinery wastewater
300 ppm (Leprince, 2001). streams (Al Zarooni and Elshorbagy, 2006). Filtration experiments were
Many technologies have been reviewed over the past few years conducted in a stainless steel dead-end stirred-cell (Membrane Extrac
(Mohammadi et al., 2015; Villegas et al., 2016) regarding the separation tion Technology Ltd., UK) with an effective membrane area of 54 cm2.
and/or removal of different types of phenolic compounds from different The nanofiltration experiment was conducted at 15 bar whereas reverse
feed solutions, ranging from traditional methods such as distillation, osmosis assays were performed at 50 bar, all at room temperature (22 �
extraction, adsorption, chemical oxidation, and biodegradation, to 1 � C) and with the feed solutions stirred at 900 rpm to lessen concen
advanced methods namely photo oxidation processes and membrane tration polarization. Samples of permeates were withdrawn throughout
separation technologies (Galanakis, 2015), where the latter has been the experiments to measure COD and calculate apparent rejections as,
given particular attention due to low energy consumption, low oper � �
ating cost, and easy scale up by using a modular design. Cp
Apparent rejection ð%Þ ¼ 1 � 100 (1)
Phenolic wastewaters from paper mill industries (Sun et al., 2015) Cf
and coke-oven wastewaters (Kumar and Pal, 2013) are examples of in
dustrial effluents that have undergone phenol removal through mem where Cp and Cf are the COD in the permeate and feed, respectively.
brane filtration processes. However, studies regarding treatment at the
source of emission using reverse osmosis or nanofiltration technologies 2.3. Cross-flow filtration assays through reverse osmosis
on stripped phenolic sour water from refineries are yet to be thoroughly
explored, especially regarding membrane performance on phenol The filtration experiments were carried out in a cross-flow mem
removal itself upon feed quality variations such as pH and oil and grease brane filtration unit (Sepa CF II Membrane Cell system, SUEZ Water
contamination levels. Technologies and Solutions) with effective membrane area of 140 cm2.
Fig. 1 shows a schematic representation of the setup. The unit was
equipped with a permeate and feed tank, a high-pressure diaphragm
Table 1 pump (Hydra-Cell, Wanner Engineering, Inc.), a valve to regulate
Typical sour water contaminants with feed and stripped water concentration pressure and an electronic balance coupled to a computer for mass
(David and Stevens, 2008; Luke Addington et al., 2011).
acquisition. The studies were carried out in concentration mode, where
Contaminant Feed (ppm) Stripped water (ppm) the permeate was collected and continuously weighed over time into a
Sulphides (H2S) 300–12000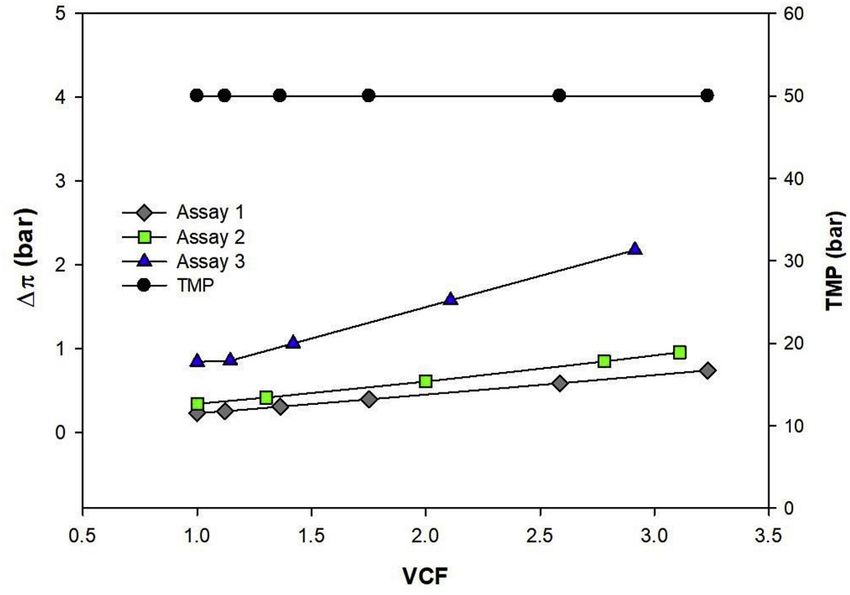
P.D.A. Bastos et al. Journal of Environmental Management 261 (2020) 110229
Table 2
Main characteristics of membranes used in the study.
Manufacturer Membrane Material Type of Molecular weight cut-off (MWCO) Temperature/Maximum pH
membrane (Da) pressure
GE Osmonics Desal DK Polyamide Selective Layer Thin Film Nanofiltration 150–300 50 � C/41 bar 3–9
Composite
DOW SW30 Polyamide Selective Layer Thin Film Reverse Osmosis NaCl rejection ¼ 99,4% 45 � C/69 bar 2–11
BW30 Composite
Fig. 1. Schematic diagram of the membrane filtration setup operating in cross-flow mode; 1 – Feed tank; 2 – Permeate collection tank.
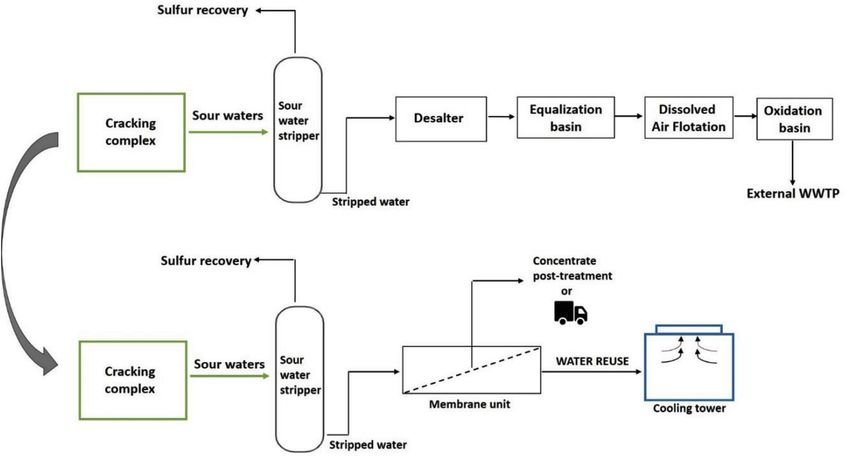
pressure difference between the feed circuit and the permeate circuit, at 3. Results and discussion
the entrance and the outlet of the module (Cheryan, 1998). Feed tem
perature was maintained at 22 � 2 � C by cooling the concentrate at a Regarding the Sines Refinery, sour waters from the cracking complex
countercurrent heat exchanger, placed before the stream returned to the undergo a series of pre-treatment steps, after being stripped, to minimize
feed tank. Permeate fluxes ðJvÞ were calculated as the permeate flowrate the phenolic content before discharge to an external WWTP (Wastewater
ðQvÞ per unit membrane area (A). Treatment Plant). Fig. 2 shows an alternative schematic proposal
Fig. 2. Simplified schematic wastewater treatment circuit of Sines Refinery and membrane treatment proposal.
3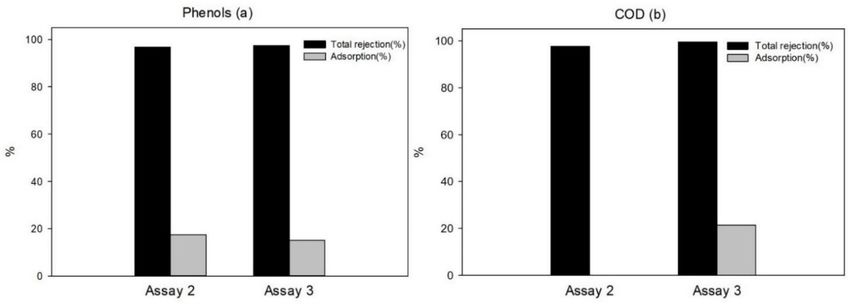
P.D.A. Bastos et al. Journal of Environmental Management 261 (2020) 110229
involving membrane treatment at the source of phenols emission. The (Galanakis, 2015). On the other hand, in the present study, the reverse
proposed technology leads to the possibility of both reducing the volume osmosis membranes BW30 and SW30 showed COD rejections of up to 83
discharged to the external WWTP and saving water for reuse within the and 97%, respectively, with minimal loss of rejection (no greater than
refinery, such as in make-up water in cooling towers. 12% for SW30) compared to Desal DK (approx. 40% loss of rejection) at
a concentration factor of 3.2, An accumulated reduction in COD of
21.5% was observed for Desal DK and 83.2% and 86.1% reduction for
3.1. Membrane screening experiments through nanofiltration and reverse
BW30 and SW30 membranes, respectively, as it can be seen in Table 3.
osmosis
As the SW30 membrane showed the best results, regarding COD
reduction, a further characterization of the permeate regarding relevant
In order to select the efficiency of the most adequate membrane for
parameters concerning water reuse, was performed, such as pH, con
the treatment of stripped phenolic sour water, known for its high
ductivity and TDS. Furthermore, these parameters were compared
phenolic content, a nanofiltration membrane (Desal DK) and two reverse
against water quality standards as reported in Table 4. It can be observed
osmosis membranes (SW30 and BW30) were tested in a dead-end
that the permeate quality is in line with the standards regarding most of
filtration setup aiming at an evaluation of their performance regarding
the routinely controlled parameters such as pH, TDS and conductivity.
rejection of the organic pollutants at hand. Samples of permeate were
The COD value for the final permeate was higher than the reported
withdrawn throughout the filtration experiments and COD was
quality standards for water reuse, mainly affected by the loss of rejection
measured and compared with that of the inlet feed. For the screening
at higher concentration factors, due to concentration polarization that
assays, COD measurements were chosen as a straightforward and effi
can hardly be eliminated in dead-end filtration processes.
cient method of determining the amount of organic pollutants that
Therefore, a study regarding reverse osmosis performance in cross-
permeate the membrane, showing to be a useful parameter to assess
flow filtration using the SW30 membrane was conducted to study the
water quality. Fig. 3 shows the COD apparent rejection as a function of
effect on rejection loss of organic compounds by the membrane, while
the volume concentration factor (VCF), which was calculated as the
scaling-up the wastewater treatment and allowing control of the fluid
initial volume divided by the volume of the concentrate throughout the
dynamics involved.
filtration (Santos et al., 2016), for the three membranes studied, at a
transmembrane pressure applied of 15 bar for the Desal DK membrane
and 50 bar for SW30 and BW30, calculated by Eq (1). It can be seen that 3.2. Cross-flow filtration assays through reverse osmosis
COD apparent rejections were no greater than 40% when the feed was
processed through the Desal DK nanofiltration membrane and decreased 3.2.1. RO membrane performance on flux and rejection
throughout the filtration, indicating that most of organic pollutants Based on the membrane screening experiments conducted, where the
present in the feed, including phenols, are not retained by the mem SW30 reverse osmosis showed the most promising results among the
brane. It suggests that most of the phenols constituting the feed have membranes studied, a cross-flow filtration of the wastewater was per
molecular weights that are lower than the membrane’s MWCO formed in concentration mode. Cross-flow filtration studies involve the
(150–300 Da). A recent report on a pilot processing of a phenolic-rich possibility of fluid dynamics control that improves performance and are
wastewater using Desal DK (Sanches et al., 2016) also found generally closer to an upscale to a membrane technology industrial application.
unimpressive rejections of low molecular weight phenols identified in Three wastewater samples of stripped phenolic sour water were
the feed. This study along with the major phenols found in real refinery collected over a representative operational period, throughout distinct
wastewater streams (Al Zarooni and Elshorbagy, 2006), such as phenol, production conditions of the refinery, to allow the study of feed quality
cresol and xylenol, strongly support that the studied nanofiltration variations that could occur based on different types of crude oil
membrane is not suitable for the retention of phenols in the stripped processed.
phenolic sour water studied, unlike other industrial effluents of high A physico-chemical characterization of the feed samples is presented
organic load where nanofiltration was successfully implemented in Table 5 where it is possible to observe the distinct variations between
(Mafalda et al., 2013). The molecular weight of phenolic compounds wastewaters, such as pH and oil and grease concentration. The identi
plays a decisive role in the type of membrane required for a successful fication of the experiments performed on each batch sample was set
separation, where nanofiltration may present interesting rejections if the according to the oil and grease content found as follows: Assay 1 - Low
total phenols constituting the feed are of high molecular weight O&G content (4 ppm); Assay 2 – Intermediate O&G content (98 ppm);
Assay 3 – High O&G content (771 ppm).
Samples of instantaneous permeates were collected throughout each
100
BW30 50 bar
filtration experiment at different VCF and were analysed in terms of
Desal DK 15 bar phenols, COD and TOC. Apparent rejections were calculated based on
SW30 50 bar and adapted from Eq (1). Fig. 4 represents the apparent rejections
(phenols and COD) and corresponding normalized permeate fluxes
COD apparent rejection (% )
80
(Jv=Jv0 Þ for all assays, where Jv0 represents the initial permeate flux as a
function of the VCF for each assay. It is possible to that the normalized
60 permeate flux remained constant throughout the filtration in Assay 1
and Assay 2, respectively. Opposingly, Assay 3 shows a sharp flux
decline up to a VCF of 1.5 and a gradual flux decline for VCF up to 2.94
40 where the final permeate flux dropped to approximately 53% of its
Table 3
Feed and permeate COD and overall COD reduction for membranes studied in
20
dead-end filtration.
Nanofiltration Reverse Osmosis
1.0 1.5 2.0 2.5 3.0 3.5 4.0 4.5
DESAL DK BW30 SW30
VCF
COD (mgO2/L) Feed 793.3 782.3 740.3
Final permeate 622.8 131.7 103.0
Fig. 3. Dead-end filtration apparent rejection (%) of COD as a function of
Overall reduction (%) 21.5 83.2 86.1
volume concentration factor (VCF).
4
P.D.A. Bastos et al. Journal of Environmental Management 261 (2020) 110229
Table 4
Characterization of feed and permeate from SW30 membrane and water reuse
quality standards for dead-end filtration.
Parameter Feed Permeate Water reuse quality standardsa
Cooling water
pH 8.44 7.66 6.5–9.0
TDS (ppm) 70.9 20.5 500
1 b
Conductivity (μS.cm ) 141.4 41.5
COD (mgO2/L) 740.3 103 75
TOC (ppm) 293.4 41.4 –
b
Phosphate (ppm) < LOQ < LOQ
b
Ammonia (ppm) 13.5 2.86
LOQ – limit of quantification.
a
(Eddy, 2007).
b
Accepted as received.
Table 5
Physico-chemical characterization of stripped sour water samples fed to cross-
flow filtration system.
Feed characterization
Parameter Assay 1 Assay 2 Assay 3
pH 8.83 10.41 9.35
Conductivity (μS.cm 1) 222 335 86.3
TDS (ppm) 71 101 46
Turbidity (NTU) – 14.5 16.8
COD (mgO2/L) 857 1577 1605
TOC (ppm) 273.3 664.7 399.4
Phenols (ppm) 160 184 128
Polar O&G (ppm) 1 1 37
Non-polar O&G (ppm) 3 97 734
Total O&G (ppm) 4 98 771
Ammonia (ppm) 13.62 37.84 9.47
Phosphate (ppm) < LOQ < LOQ < LOQ
initial value. Regarding phenols retention, it can be seen that the
apparent rejections show negligible decreases throughout the filtration
up to a concentration factor of 3, from 97.2 to 96.5% for Assay 1,
97.4–95.7% for Assay 2 and 98.1–96.6% for Assay 3. COD rejections
remain clearly constant for all assays, reaching values of 97.4% for Assay
1 and Assay 2, and 99.4% for Assay 3. The fact that the major contrib
utors of COD are phenols and O&G supports the higher COD rejection for
the feed rich in O&G compared to the feed poor in O&G. Nevertheless, it
is possible to highlight from the overall results that the flux decline
showed no effect on the phenol/COD rejections, suggesting that poten
tial fouling by oil and grease contributes to the rejection of smaller
solutes. In this study, such high molecular weight compounds encom
Fig. 4. Cross-flow filtration evolution of apparent rejection of phenols and COD
pass heavy non-polar hydrocarbons that exist in the feed.
with volume concentration factor and normalized permeate fluxes for all assays.
Before each filtration experiment, deionized water was passed
through the fresh membrane to determine the pure water permeability
at 50 bar and room temperature, achieving a constant value of 0.78 � equation, as
0.02 L h 1.m 2.bar 1 at 22 � C. Δπ ¼ ðCb CpÞRT (3)
3.2.2. Osmotic pressure estimation and adsorption where Cb is the molar concentration of the solutes in the bulk, Cp their
For nanofiltration and reverse osmosis processes, the osmotic pres molar concentration in the permeate, R is the gas constant and T is the
sure difference (Δπ ) between the retentate and permeate may play a absolute temperature. As far as contribution to osmotic pressure dif
major impact on permeate flux (Jv), when operating in concentration ference, it was assumed that only molecules with low molecular weight
mode, due to the driving force decrease, according to, are relevant, such as phenols, salts and small non-polar hydrocarbons.
Therefore, the following components in the wastewater were considered
Jv ¼ Lp ðTMP ΔπÞ (2)
the key compounds for osmotic pressure estimation: phenol (MW, 94.11
where Lp represents the membrane permeability, TMP the trans g mol 1), cresol (MW, 108.14 g mol 1), xylenol (MW, 122.16 g mol 1),
membrane pressure and Δπ the osmotic pressure difference. Therefore, heptane (MW, 100.21 g mol 1), octane (MW, 114.23 g mol 1), nonane
an estimation of the impact of low molecular weight solutes on the (MW, 128.26 g mol 1), decane (MW, 142.29 g mol 1) and sodium
driving force was conducted in order to study the causes of the flux chloride (MW, 58.44 g mol 1). Molar concentrations in the concentrate
decline observed in Assay 3. The osmotic pressure difference between were calculated through a mass balance using the molar concentrations
the concentrate and permeate side was determined using the Van’t Hoff in permeate and feed as well as their respective volumes. The experi
mentally obtained mass concentrations were used to calculate feed and
5
P.D.A. Bastos et al. Journal of Environmental Management 261 (2020) 110229
permeate molar concentrations. Fig. 5 shows the evolution of the os Since the adsorption of phenols presented a lower effect on the observed
motic pressure difference as a function of the volume concentration flux decline, compared to COD adsorption, it is plausible that oily
factor, as opposed to the transmembrane pressure operated. It can be matter, which greatly contributes to COD, played a relevant role in
clearly seen that the increase in osmotic pressure difference in Assay 3 is membrane adsorption as the feed rich in oil and grease led to flux
greater than the increase in the remaining assays, ranging from less than decline.
1 bar up to 2.2 bar at a concentration factor of 3, whereas the slight For filtration assays with low O&G content, membrane rinsing with
increase for Assay 1 and Assay 2 ranged from 0.3 bar to less than 1 bar hot deionized water (35–45 � C) for 30 min sufficed to recover hydraulic
for the same VCF. For the feed with low and intermediate O&G content permeability. A cleaning-in-place protocol (CIP) with P3-Ultrasil 75
(Assay 1 and 2, respectively), phenols played the most relevant part with (2%) for 1h, followed by 30 min rinsing with water, was required for
the largest contribution to osmotic pressure difference, showing the recovering hydraulic permeability when a heavier load of oily matter is
highest molar concentrations, whereas for the feed rich in O&G (Assay present in the feed.
3), low molecular weight non-polar hydrocarbons overcame phenols in Overall, it is to be highlighted that the specific wastewater studied
terms of osmotic pressure contribution, due to the O&G content being possesses promising advantages regarding its pyshico-chemical charac
about 7x as high as the feed with intermediate O&G content. The salts teristics, in that its salinity is negligible and therefore osmotic pressure is
contribution (in terms of sodium chloride) ended up playing a minor role extremely low compared to the transmembrane pressure applied. This
in the osmotic pressure difference, due to the original wastewater being shows that from a process point of view, reverse osmosis could be
low in salts with average salinity concentrations of 113 mg.L 1 leading applied efficiently at high recoveries with fewer stages, lowering capital
to low molar concentrations. The low TDS and conductivity values of all costs associated with membrane modules used. However, a balanced
wastewater samples fed to the filtration system also supports the lack of trade-off should be considered between the need of a RO pre-treatment
salinity of the feed. In all scenarios, however, it can be highlighted that for cases in which flux decline caused by membrane adsorption of oily
compared to the transmembrane pressure, the total osmotic pressure matter show damaging consequences to the membrane and the simple
differences of the experiments are negligible, suggesting that flux de adjustment and process optimization of the fluid dynamics involved.
clines observed can hardly be caused by this phenomenon. Therefore, Sour water is always sent to a flash drum and fed to a Feed Stabilization
the most likely explanation of the flux decline observed leans on fouling Tank before entering the stripping unit so that the residence time of the
caused by membrane adsorption. sour water is increased for longer mixing and homogenization of the
It is of high importance to minimize fouling in reverse osmosis pro feed composition and for further removal of hydrocarbons. Therefore,
cesses to achieve maximum recoveries while maintaining rejection O&G content remained low in the stripped phenolic sour water in the
performances, which is why designers tend to use proper modules to Sines Refinery with an average concentration of 22 ppm in 2017.
optimize operational conditions such as temperature, transmembrane Nevertheless, a combination of monitoring the RO performance and
pressure and crossflow velocity (Mohammadi et al., 2003). monitoring the O&G content of the wastewater fed to the treatment
Adsorption (Ads) on the membrane is one of the contributing pa system could lead to promising results when operational upsets arise,
rameters of rejection of compounds and can be calculated for each solute avoiding the narrowing of membrane lifetime, which is of great
of interest as, importance in refinery wastewater treatment (Santos et al., 2016).
� �
mp þ mr
Ads ð%Þ ¼ 1 � 100 (4) 3.3. Permeate characterization and water reuse
mf
As referred, no flux decline observed led to any significant rejection
where mp , mr and mf are the mass of a given compound in the permeate,
loss of the organic matter within the wastewater. Therefore, final per
retentate and feed, respectively, which were calculated from the con
meates characteristics for all experiments were compared to the water
centrations and volumes of the streams at hand. Total rejections and
quality requirements for cooling systems for water reuse as well as a
adsorption percentages were determined for COD and phenols in Assay 2
sample of the make-up water from the Sines Refinery cooling tower. The
and Assay 3 and can be seen in Fig. 6. Phenols showed to have a rela
analytical data for permeates and wastewaters and presented in Table 6.
tively constant adsorption percentage (15–17%) regardless of the
It can be seen that all COD values fit the water quality standards for
permeate flux obtained with high total rejections (96.7–97.5%) whereas
water reuse as well as pH values. TDS and conductivity values were well
COD showed a higher adsorption (21.4%) when flux decline was
below the Sines Refinery cooling tower make-up water and quality
observed, nevertheless presenting appealing rejections (97–99.4%).
standards which show that they are fit for reuse.
4. Conclusions
In the present study, a specific refinery effluent with a rich phenolic
content, stripped phenolic sour water, was processed through a nano
filtration membrane as a wastewater treatment. Low COD rejections
after using a Desal DK NF membrane led to observation that nano
filtration was not suitable for an efficient treatment by retention of the
most abundant organic contaminant, phenols. Therefore, two reverse
osmosis membranes, BW30 and SW30 were tested without any pre-
treatment, in which the latter showed appealing overall rejections of
COD (up to 99%) and phenols (up to 98%) when being processed in a
cross-flow filtration mode. Three different wastewater samples were
processed over a representative operational period, two of which
experienced no flux decline up to a concentration factor of 3. Flux
decline due to hydrocarbon and phenolic adsorption was observed in the
case where O&G content in feed exceeded regular values. No loss of
rejection, however, was observed in any of the cross-flow experiments
Fig. 5. Cross-flow filtration evolution of osmotic pressure difference for the and all permeates characterized were within the water quality standards
experiments performed. for water reuse in cooling systems. The minor osmotic pressures (less
6P.D.A. Bastos et al. Journal of Environmental Management 261 (2020) 110229
Fig. 6. Percentages of total rejection and adsorption determined in Assay 2 and Assay 3 for phenols (a) and COD (b).
Table 6
Analytical data for feed and permeate characterization from cross-flow filtration studies and water reuse quality standards.
Parameter Assay 1 Assay 2 Assay 3 Water reuse quality standardsa Sines Refinery cooling tower
Feed Permeate Feed Permeate Feed Permeate Cooling water Make-up water
pH 8.83 6.61 10.41 7.79 9.35 6.84 6.5–9.0 7.81
1 b
Conductivity (μS.cm ) 222 7.77 335 109.1 86.3 8.82 1095
TDS (ppm) 71 3.77 101 54.63 46 4.59 500 548
Turbidity (NTU) – 2.21 14.5 1.18 16.8 1.02 1.76
COD (mgO2/L) 857 29.5 1577 54.7 1605 9.5 75 5.34
TOC (ppm) 273.3 8.48 664.7 13.3 399.4 3.72
Phenols (ppm) 160 4.4 184 6 128 3.2
Total O&G (ppm) 4 < LOQ 98P.D.A. Bastos et al. Journal of Environmental Management 261 (2020) 110229
Mohammadi, S., Kargari, A., Sanaeepur, H., Abbassian, K., Najafi, A., Mofarrah, E., 2015. Santos, B., Crespo, J., Santos, M., Velizarov, S., 2016. Oil refinery hazardous effluents
Phenol removal from industrial wastewaters: a short review. Desalination Water minimization by membrane filtration: an on-site pilot plant study. J. Environ.
Treat. 53, 2215–2234. Manag. 181.
Mrayyan, B., Battikhi, M.N., 2005. Biodegradation of total organic carbons (TOC) in Stoneburner, G., 1961. In: Company, S.O. (Ed.), Method of Removing Phenolic
Jordanian petroleum sludge. J. Hazard Mater. 120, 127–134. Compounds from Waste Water, p. 4. Chicago, Illinois.
Munirasu, S., Haija, M.A., Banat, F., 2016. Use of membrane technology for oil field and Sun, X., Wang, C., Li, Y., Wang, W., Wei, J., 2015. Treatment of phenolic wastewater by
refinery produced water treatment—a review. Process Saf. Environ. Protect. 100, combined UF and NF/RO processes. Desalination 355, 68–74.
183–202. Tim Armstrong, B.S., Taylor, Kin, Gardner, Art, 1996. Sour water stripping. Today’s
Sanches, S., Fraga, M., Silva, N., Nunes, P., Crespo, J., Pereira, V., 2016. Pilot scale Refin.
nanofiltration treatment of olive mill wastewater: a technical and economical Venkatesh, M., 2010. In: Series, O.B.P. (Ed.), Petroluem Refining Water/wastewater Use
evaluation. Environ. Sci. Pollut. Control Ser. 24. and Management. AECOM, Inc.
Santos, B., Galinha, C.F., Crespo, J.G., Santos, M.A., Velizarov, S., 2013. Prediction of Villegas, L.G.C., Mashhadi, N., Chen, M., Mukherjee, D., Taylor, K.E., Biswas, N., 2016.
polar oil and grease contamination levels in refinery wastewater through A short review of techniques for phenol removal from wastewater. Curr. Pollut. Rep.
multivariate statistical modeling. Separ. Purif. Technol. 119, 51–57. 2, 157–167.
Wake, H., 2005. Oil refineries: a review of their ecological impacts on the aquatic
environment. Estuar. Coast Shelf Sci. 62, 131–140.
8You can also read