Effect of Microwave Cooking on Quality of Riceberry Rice (Oryza sativa L.)
←
→
Page content transcription
If your browser does not render page correctly, please read the page content below
Hindawi
Journal of Food Quality
Volume 2020, Article ID 4350274, 9 pages
https://doi.org/10.1155/2020/4350274

Research Article
Effect of Microwave Cooking on Quality of Riceberry Rice
(Oryza sativa L.)

 Lyda Chin, Nantawan Therdthai , and Wannasawat Ratphitagsanti
 Department of Product Development, Faculty of Agro-Industry, Kasetsart University, Bangkok 10900, Thailand

 Correspondence should be addressed to Nantawan Therdthai; faginwt@ku.ac.th

 Received 9 October 2019; Revised 8 August 2020; Accepted 13 August 2020; Published 28 August 2020

 Academic Editor: Marı́a B. Pérez-Gago

 Copyright © 2020 Lyda Chin et al. This is an open access article distributed under the Creative Commons Attribution License,
 which permits unrestricted use, distribution, and reproduction in any medium, provided the original work is properly cited.

 Microwaves have been applied for cooking, warming, and thawing food for many years. Microwave heating differs from
 conventional heating and may cause variation in the food quality. This study determined the quality of Riceberry rice (Oryza sativa
 L.) after microwave cooking using various rice-to-water ratios at three power levels (360, 600, and 900 W). The texture of all
 microwave-cooked samples was in the range 162.35 ± 5.86 to 180.11 ± 7.17 N and was comparable to the conventionally cooked
 rice (162.03 N). The total phenolic content (TPC) and the antioxidant activity of the microwave-cooked rice were higher than
 those of the conventional-cooked rice. Microwave cooking appeared to keep the TPC in the range 241.15–246.89 mg GAE/100 g
 db and the antioxidant activities based on DPPH and ABTS assays in the ranges 134.24–137.15 and 302.80–311.85 mg·TE/100 g db,
 respectively. Microwave cooking also maintained similar contents of fiber, ash, and total starch to those from conventional
 cooking. The glycemic index (GI) for all freshly cooked rice samples was not significantly different, and the rice was classified as a
 high-GI food. Microwave cooking could be recommended as an alternative technique for rice cooking due to its rapid heating
 regime and the comparable quality and maximized TPC and antioxidant activity of the cooked rice.

1. Introduction commercial food products, as well as in dietary supplements,
 cosmetics, and pharmaceuticals [3, 4].
Rice (Oryza sativa L.) is a vital staple food that is grown in To cook grains into a palatable, pleasant, and digestible
many countries including Thailand, which is known as one form, rice needs to be boiled or steamed to accomplish
of the highest rice producers. Thai rice has a great variety of suitable starch gelatinization and water absorption. Since
colors, ranging from black or dark purple to ruby red, golden people in different countries have different preferences, the
brown, and white. Regular consumption of some varieties cooking methods vary, resulting in two primary cooking
containing high antioxidant activities can benefit human techniques. The first involves cooking in large amounts of
health. Riceberry rice is a new crossbreed between Jao Hom water with subsequent drainage, commonly referred to the
Nin rice and Jasmine rice 105. It is a pigmented rice which excess or the American method, while the other is based on
has a deep purple whole grain with a unique aroma. Re- cooking the rinsed rice in a measured amount of water,
cently, Riceberry rice has become popular for local con- commonly known as the Pilaf or the oriental method or the
sumption due to its unique cooked grain characteristics such water-absorption method [5]. Europeans mostly prefer to
as fluffy texture, flavor, nutritional value, and health-pro- cook rice in excess water, while Asians typically use a rice
moting effects such as anti-inflammatory, anticancer, cooker with a limited amount of water.
hyperlipidemic, and hypoglycemic [1, 2]. Due to its health- Tamura et al. [6] mentioned that eating quality was not
enhancing substances, Riceberry rice has gained attention only affected by grain characteristics inherent in different
from researchers and food manufacturers as a waste product cultivars, but was also related to cooking procedures such as
(Riceberry bran) and as flour and whole grain. It has been the rice-to-water ratio and the cooking temperature. Over
used for developing new, natural, and healthy food and time, many heating appliances have evolved including three-
2 Journal of Food Quality

stone fires, electric cookers, microwave ovens, induction concentration of other antioxidant compounds after cook-
cookers, and other high-tech appliances. Shinde et al. [7] ing. For this reason, cooking Riceberry rice using micro-
reported 10–25% variation in the operation efficiency of waves could result in different profiles of anthocyanins,
conventional cooking. Currently, more emphasis is placed phenolic compounds, and biological activity, compared with
on energy conservation, being environmental friendly, and using an electric cooker.
on hygienic production; thus, microwave heating has be- Therefore, this study aimed to evaluate possible alter-
come more attractive than traditional heating. Microwaves native cooking methods for Riceberry rice in a domestic
are known to generate heat inside the penetrated medium microwave oven and the effect of microwave cooking on
because of the induced molecular friction in an alternating antioxidant activities and qualities. The study outcomes
electromagnetic field. The increased interest in microwaving would facilitate decisions on cooking rice to maximize its
foods has been encouraged by its faster heating features, nutrient content for everyday consumption.
lower energy consumption, convenience, and maintenance
of nutritional integrity [8]. The Ca, K, Mg, P, and Zn
contents of jalo and black bean species increased after do-
 2. Materials and Methods
mestic microwave cooking, while the contents of Cu, Fe, and 2.1. Materials and Chemical Reagents. The Riceberry rice
S did not change [9]. The antioxidant activity of some used was a commercial product purchased from a local
vegetables such as Momordica charantia and Moringa market in Thailand and stored in a cool room until use. A
oleifera could be also enhanced by microwave heating [10]. domestic microwave oven with a frequency of 2,450 MHz
Microwaves are mostly used for drying, blanching, and (MP-94825S, LG Electronics Inc., Korea) and an electric
pasteurization in food industries. The catering industry uses cooker (Model Sharp KSH-D06, Federal Electric Corp., Ltd,
microwave ovens mainly for reheating preprepared products Thailand) were used for this study.
[11]. Recently, traditional thermal processing has been All chemical reagents consisting of gallic acid,
replaced by microwave cooking due to the accelerated pace Folin–Ciocalteu reagent, 2,2-diphenyl-1-picrylhydrazyl
associated with the modern lifestyle. (DPPH), 6-hydroxy-2,5,7,8-tetramethylchromane-2-car-
 Conventional cooking using an electric cooker involves boxylic acid (Trolox), 2,2-azino-bis-3 ethylbenzothiazoline-
heating as a combination of conduction (between the heater 6-sulphonic acid diammonium salt (ABTS), methanol, and
and the bottom of the container), convection (between the ethanol were of analytical grade and purchased from Sigma-
liquid phase and the container), and convection (between Aldrich (St. Louis, MO, USA).
the water and rice grains). In contrast, microwave cooking
generated heat by dipolar rotations and ionic interactions
[5, 12, 13]. These different heating mechanisms could affect 2.2. Sample Preparation and Rice Cooking. Cooked rice was
the quality of the cooked food. For example, the firmness prepared in three steps, namely, washing, cooking, and
and chewiness of steamed nonglutinous rice were higher warming. A classical cooking procedure for rice was chosen
than those from boiling in an electric cooker. Interestingly, for the preliminary study. Rice grains were washed three
the anthocyanins in pigmented rice decreased by around times (1 min each time) to eliminate all dirt on the grains.
80% after cooking in an electric cooker, whereas the phenolic Two different cooking methods were used: microwave
compounds declined by 54% [4]. Ayimbila and Keawsom- cooking using a domestic microwave oven and conventional
pong [1] demonstrated that the slow digestion of the starch cooking using an electric cooker. When the cooker auto-
in Riceberry rice was accelerated depending on the cooking matically shifted to the warm setting, the rice was held for
method. The differences in the starch fractions were at- 10 min at that setting according to the cooker manual,
tributed to the processing conditions and variation in the whereas the rice was allowed to stand for 5 min after mi-
amount of water, which played a crucial role in starch ge- crowave cooking.
latinization and retrogradation mechanisms during cooking
and storage. Besides, the hydrolysate of Riceberry rice sig- The experiment used a completely randomized design.
nificantly enhanced the growth of probiotic strains during in There were nine treatments involving either conventional
vitro fermentation. cooking or microwave cooking. For conventional cooking,
 Chatthongpisut et al. [14] reported that the degradation 100 g of Riceberry rice grains were prepared in a cooker.
pathway of anthocyanins under microwave heating was Rice-to-water ratios of 1 : 1.8, 1 : 2.0, and 1 : 2.2 (w : v) were
different from conventional heating, resulting in different preliminarily determined to obtain the optimal quality with
degraded products. Although extremely high-temperature cooking times of 32 min, 34 min, and 37 min, respectively,
treatment promoted the degradation of anthocyanins in Thai and designated as EC1, EC2, and EC3, respectively. For
purple rice, it generated phenolic compounds such as microwave cooking, 50 g of rice was placed in a microwave
protocatechuic acid (PCA), vanillic acid, and ferulic that had rice-steaming container (Model Sistema 2.6 L, New Zealand)
an antiproliferative effect on Caco-2 cells. After cooking, the with a limited water ratio. Then, the rice-steaming container
concentration of PCA significantly increased, approximately was placed on the center of the turntable plate in the mi-
1.21–3 times, compared with the raw rice. Yamuangmorn crowave chamber and heated using three power levels
et al. [4] reported that the antioxidant capacity of cooked, (360 W, 600 W, and 900 W). Rice-to-water ratios of 1 : 2.8
purple, nonglutinous rice contrasted in its anthocyanin (L-MC1) and 1 : 3.0 (L-MC2) were used for microwave
concentration, indicating that there could be a higher cooking at 360 W. At 600 W, the rice-to-water ratio was
Journal of Food Quality 3

increased to two levels of 1 : 4.8 (M-MC1) and 1 : 5.0 (M- using the method by Wiriyawattana et al. [2]. A ground
MC2). With the maximum power at 900 W, the rice-to- sample was homogenized in 85% (v/v) methanol with a ratio
water ratio was further increased to 1 : 7.0 (H-MC1) and 1 : of 1 : 10 w/v under shaking at room temperature for 30 min.
 7.2 (H-MC2). The variation in the rice-to-water ratio ap- After centrifugation (Model Rotina 380R, Hettich, Tut-
plied was to balance evaporation loss during cooking. The tlingen, Germany) at 3,000 rpm for 10 min, the supernatant
cooking time for each condition was varied to yield palatable was decanted. The precipitate was re-extracted. The super-
cooked rice (Table 1). Rice samples were confirmed to be natant samples collected from three extractions were
completely cooked if there was no white core in the rice combined and made up using a solvent (methanol 85% v/v)
grains when compressed between two glass plates. The to the final volume of 50 mL. The extract was used to de-
cooked rice was immediately freeze-dried. Freeze-dried termine the total phenolic content (TPC) and antioxidant
samples were ground and kept at −18°C for chemical activities using the DPPH radical scavenging assay and the
analysis. The physical quality was analyzed in the freshly ABTS radical scavenging assay. Extractions were conducted
cooked form. in duplicate.
 The amount of TPC was determined using the
 Folin–Ciocalteu colorimetric method. The extract (200 µL)
2.3. Determination of Cooking Profiles and Texture of Cooked was mixed with 1.5 mL of sodium carbonate (75 g/L) and
 Rice 1.5 mL of the Folin–Ciocalteu solution (1 : 10 v/v). The mixed
 solution was incubated in the dark at a room temperature for
2.3.1. Determination of Temperature Profile and Water
 2 h. The absorbance was read using a UV-spectrophotometer
Uptake during Cooking. The temperature profile and water
 (Model 160A, Shimadzu, Japan) at 725 nm. Gallic acid was
uptake during cooking were observed every 2 min until the
 used as a standard. The results were expressed as milligrams
rice was cooked. The rice and water temperature was
 of the gallic acid equivalent per 100 g of the dry sample (mg
measured using a K-type thermocouple device connected to
 GAE/100 g·db).
a data logger (Digicon DP-72 Digital Thermometer, Thai-
 For the DPPH radical scavenging activity assay, the
land). The water uptake was determined by checking the
 extract (500 µL) was added with 3 mL of 0.1 mM DPPH
weight of the rice [15]. The weight of the rice before cooking
 methanol solution. The solution was kept at room tem-
(W1) was recorded. Twenty samples were prepared and
 perature for 30 min before the absorbance was measured at
cooked individually for different times to obtain palatable
 517 nm using the UV-spectrophotometer. The DPPH radical
eating quality (Table 1). After cooking, each rice sample was
 scavenging activity was calibrated based on a standard curve
left for 30 s on a filter paper to remove surface water before
 of Trolox and expressed as milligrams of the Trolox
being reweighed (W2). The water uptake ratio was calculated
 equivalent per 100 g of the dry sample (mg TE/100 g db).
using the following equation:
 The ABTS radical scavenging activity was determined
 W2 according to Chatthongpisut et al. [14] with some modifi-
 water uptake ratio � . (1)
 W1 cations. A sample of the extract (100 µL) was mixed with
 3.9 mL of the working solution. The absorbance was mea-
 Experiments for determination of both the temperature sured at 734 nm immediately after keeping in the dark for
profile and water uptake were carried out based on two 6 min. The results were expressed as milligram of the Trolox
replications. equivalent per 100 grams of the dry sample (mg TE/
 100 g·db).
2.3.2. Determination of Texture Profiles of Cooked Rice.
The texture of the cooked rice was analyzed using a texture 2.4.2. Proximate Analysis. The content of crude protein, fat,
analyzer (Model TA. XT. plus, Stable Micro Systems, UK), fiber, moisture, and ash in cooked rice samples was deter-
following the method by Wu et al. [16] with some modi- mined according to the Association of Official Analytical
fications. Twenty cooked rice grains were arrayed on the Chemists (AOAC) standard methods. The carbohydrate
platform and tested for 5 min after cooking had finished. A content was calculated by subtracting the moisture, protein,
two-cycle compression program (TPA) was run with speeds fat, fiber, and ash contents of cooked rice from 100 [17]. All
of 0.5, 0.5, and 5 mm/s for the pretest, test, and posttest, analyses were conducted in triplicate. These results were
respectively. A cylindrical probe (P/75) was used to achieve expressed on a dry weight basis.
60% compression. The experiment was repeated 10 times for
each sample. The textural parameters of TPA curves were
 2.4.3. Total Starch and Estimated Glycemic Index. The total
calculated using the Texture Expert Excede Version 1.0
 starch content of each sample was determined using a total
software (Stable Micro System Software, UK).
 starch assay kit (Megazyme International Ireland Ltd.,
 Ireland). The released glucose was measured as the absor-
2.4. Comparison of Chemical Qualities from Conventional bance of the coloration using the UV-spectrophotometer at
 Cooking and Microwave Cooking 510 nm. Total starch (%) was expressed on a dry weight basis
 [18].
2.4.1. Determination of Total Phenolic Content and Anti- Starch digestion was determined using a rapid in vitro
oxidant Activities. Free phenolic compounds were extracted digestibility assay based on glucometry [19]. The glucose
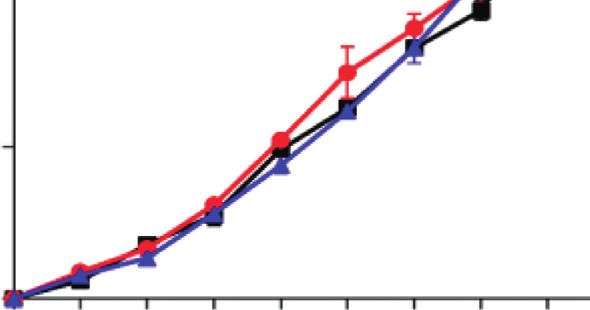
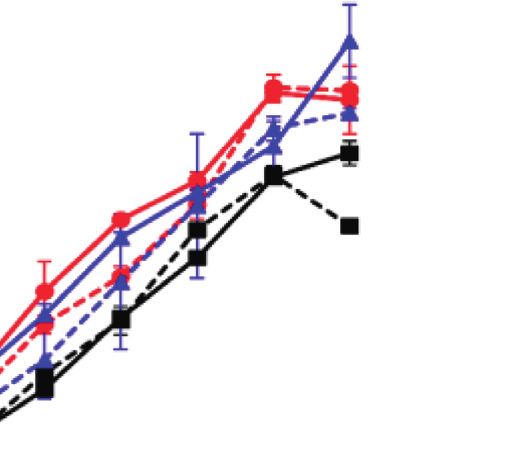
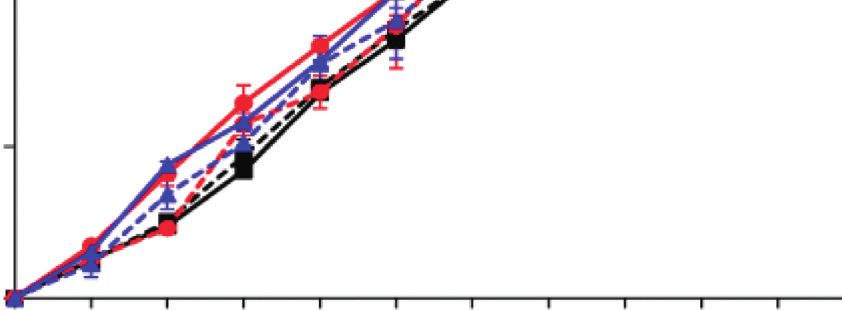
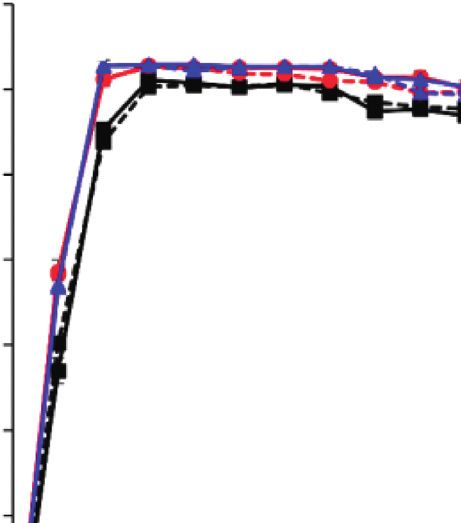
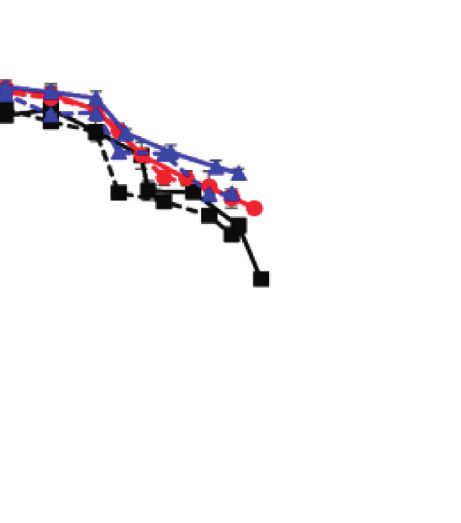
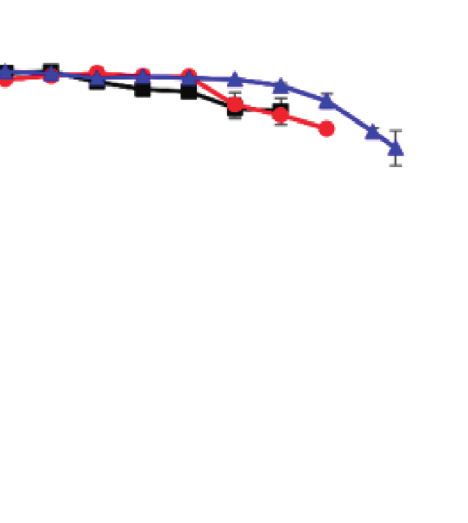
4 Journal of Food Quality

 Table 1: Experimental conditions for rice cooking.
Cooking method Power level (W) Rice-to-water ratio (w : v) Cooking time (min)
EC1 — 1 : 1.8 32
EC2 — 1 : 2.0 34
EC3 — 1 : 2.2 37
L-MC1 360 1 : 2.8 30
L-MC2 360 1 : 3.0 31.5
M-MC1 600 1 : 4.8 30
M-MC2 600 1 : 5.0 31
H-MC1 900 1 : 7.0 30
H-MC2 900 1 : 7.2 30.5
EC: conventional cooking using an electric rice cooker, L-MC: microwave cooking using low power level, M-MC: microwave cooking using medium power
level, and H-MC: microwave cooking using high power level; 1: low water ratio, 2: medium water ratio, and 3: high water ratio.

concentration in the digesta was measured using a blood (Figure 1). The rate constant (k-value) of the temperature
glucometer (Model Easymax, Hsinchu Science Park, Tai- increase was significantly different between the cooking
wan) after a specific time (0, 10, 20, 30, 45, 60, 90, 120, 150, methods. However, the rice-to-water ratio did not have a
180, 210, and 240 min). Digested starch (DS) per 100 g dry significant effect on the temperature increase during con-
starch was calculated using the following equation: ventional cooking. Likewise, under the same microwave
 0.9 × GG × 180 × V power, increasing the rice-to-water ratio did not affect the
 DS � , (2) rate constant (P > 0.05). The k-value decreased from
 W × S [100 − M]
 14.67°C·min−1 to 13.51°C·min−1 when the microwave power
where GG is the glucometer reading (mM/L), V is the decreased from 900 W to 360 W. Although the rate constant
volume of the digesta (mL), 180 is the molecular weight of at high and low power varied, the difference was much
glucose, W is the weight of the sample (g), S is the starch smaller than those between microwave cooking and con-
content of the sample (g/100 g sample), and 0.9 is the ventional cooking probably due to the variation in heating
stoichiometric constant for starch from glucose contents. modes. In the current study, the results indicated that high
 The hydrolysis index of each sample was calculated by microwave power required a greater water content for
dividing the area under its digestogram by the area under the cooking than low microwave power due to the increased
digestogram of white bread. Single-point measurement of evaporation at high power. Water is a dipolar molecule that
starch digestion at 90 min (HI90) in the samples was also can absorb microwave energy and transform it into heat due
used to calculate the glycemic index (GI). Hence, using the to its polar interaction. During the heating process, the vapor
parameter of the modified first-order kinetic model for both pressure is increased, contributing greatly to vapor loss from
the rice sample and white bread (reference), the average GI the system [13, 20]. Gavahian et al. [12] reported that the
(GIavg) for each sample was calculated using the following higher evaporation rate from microwave cooking led to a
equation [18]: greater rate of temperature increase than from the tradi-
 tional method.
 39.21 + 0.803HI90 +(39.51 + 0.573HI) In the water uptake profiles (Figure 2), the cooking
 GIavg � ,
 2 method had a significant effect on the rate constant, except
 (3) for EC3 (k � 0.033 min−1) and L-MC1 (k � 0.035 min−1). This
 was possibly due to the slight variations in the rice-to-water
where HI90 is hydrolysis at t � 90 min and HI is hydrolysis at ratio (from 2.2 to 2.8) and heating power (300 W from the
t � 120 min. electric cooker and 360 W from the microwave oven).
 However, the rapid water uptake with microwave cooking at
2.5. Statistical Analysis. Data were analyzed using one-way medium and high power could have been related to the
analysis of variance in the SPSS version 12.0 for Windows initial water content and the cooking temperature because
software (SPSS Inc., Chicago IL, USA). Duncan’s test was starch begins to gelatinize only when the water content in the
used to determine significant differences among means rice grain is above the critical water content [21].
(P ≤ 0.05). With microwave cooking, an increase in the rice-to-
 water ratio did not significantly affect the rate constant of
3. Results and Discussion water uptake. The hydration rates increased after increasing
 the microwave power from low to medium and high levels,
3.1. Effect of Rice-to-Water Ratio and Cooking Method on indicating that medium and high power resulted in rapid
Cooked Rice Quality. With the range of rice-to-water ratios hydration of the rice grains. This was supported by the
used in conventional cooking, the rice grains required temperature profile results (Figure 1). The temperature
10 min to reach the maximum temperature of 97.85°C increases for the medium and high power levels were sig-
compared to only 6 min using microwave cooking nificantly higher than for the low power level. Likewise, He
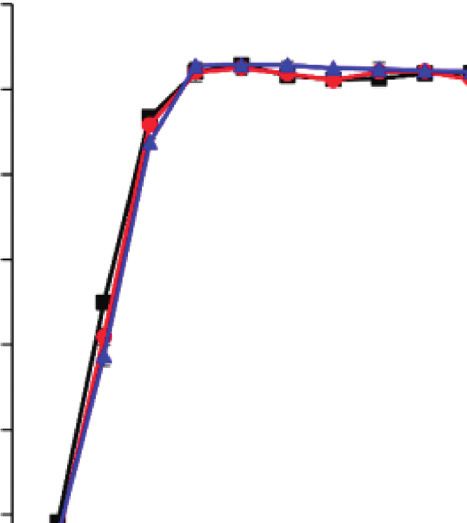
Journal of Food Quality 5

 105 105

 95 95

 85 85

 Temperature profile (°C)
 Temperature profile (°C)

 75 75

 65 65

 55 55

 45 45

 35 35

 25 25
 0 2 4 6 8 10 12 14 16 18 20 22 24 26 28 30 32 34 36 38 40 0 2 4 6 8 10 12 14 16 18 20 22 24 26 28 30 32 34 36 38 40
 Cooking time (min) Cooking time (min)
 EC1 L-MC1 M-MC2
 EC2 L-MC2 H-MC1
 EC3 M-MC1 H-MC2
 (a) (b)

Figure 1: Temperature profile during conventional cooking (a) and microwave cooking (b). EC: conventional cooking using an electric rice
cooker, L-MC: microwave cooking using low power level, M-MC: microwave cooking using medium power level, and H-MC: microwave
cooking using high power level. 1: low water ratio, 2: medium water ratio, and 3: high water ratio.

 2.0 2.0

 1.8 1.8
 Water uptake (g/g)

 Water uptake (g/g)

 1.6 1.6

 1.4 1.4

 1.2 1.2

 1.0 1.0
 0 2 4 6 8 10 12 14 16 18 20 22 24 26 0 2 4 6 8 10 12 14 16 18 20 22 24 26
 Cooking time (min) Cooking time (min)
 EC1 L-MC1 M-MC2
 EC2 L-MC2 H-MC1
 EC3 M-MC1 H-MC2
 (a) (b)

Figure 2: Water uptake during conventional cooking (a) and microwave cooking (b). EC: conventional cooking using an electric rice
cooker, L-MC: microwave cooking using low power level, M-MC: microwave cooking using medium power level, and H-MC: microwave
cooking using high power level. 1: low water ratio, 2: medium water ratio, and 3: high water ratio.

et al. [22] mentioned that water absorption in cooked rice claimed that the water diffusion rate was related to an in-
was influenced by the cooking temperature. The amount of crease in temperature, whereas the initial water content and
water uptake by starch granules increased at high temper- the temperature were the principle factors influencing starch
ature due to the effects of the crystalline structure of the gelatinization [13].
granules, the breaking of hydrogen bonds, and the release of Due to the nonsignificant difference in the rate constant
amylose and amylopectin into the surrounding area [12]. of the temperature profile and water uptake between con-
These results were in agreement with other studies that ventional cooking and the recommended cooking condition
6 Journal of Food Quality

from the Riceberry rice producer, EC3 was set as the control water ratio was used with high microwave power. By de-
and the benchmark for the texture of cooked Riceberry rice. creasing the rice-to-water ratio or the microwave power, the
Various microwave cooking settings were carried out to find chewiness was increased.
the conditions that could provide a similar texture to EC3. Alteration of the textural characteristics of cooked rice
The texture profiles of cooked rice from conventional and by microwave cooking might be attributed to the reduction
microwave cooking are shown in Table 2. in the degree of starch gelatinization [24]. The different
 EC3 had values for hardness, adhesiveness, springiness, heating patterns could cause some modifications in the
cohesiveness, and chewiness of 162.03 N, −671.58 g.sec, 0.40, physical structure of cooked rice. Moreover, the rate of
0.46, and 30.68, respectively (Table 2). Cooked rice obtained temperature increase may affect the kinetic constant, the rate
from low rice-to-water ratios for each power level (L-MC1, of starch hydrolysis, and the texture and pasting properties
M-MC1, and H-MC1) was not significantly different in due to differences in the starch microstructure [12, 25]. The
hardness. In contrast, the use of high rice-to-water ratios (L- texture of cooked rice was influenced by the availability of
MC2, M-MC2, and H-MC2) produced similar texture water during the early stage of cooking, which determined
profiles to that from EC3. Cooked rice with a high ratio of the hydration of the protein and the concentration of the
water produced a significantly soft texture. The hardness dispersed and viscous phases of the starch [26].
result was attributed to both the amylose content and the Based on no significant difference in hardness and the
amylose molecular size. Li et al. [23] reported that the similarity of the other texture attributes, the options using
hardness of cooked rice was determined by the inner microwave cooking with high initial rice-to-water ratios (L-
structure of the rice grain, especially the proportion of MC2, M-MC2, and H-MC2) were selected for further study.
amylose branches with a degree of polymerization (DP: the
average number of monomeric units per molecules) from
1,000 to 2,000. Thus, a smaller amylose molecular size and a 3.2. Comparison of Microwave Cooking and Conventional
higher proportion of amylose branches accelerated hardness, Cooking
as these structural features affected the amylose leaching and
the degree of starch granule swelling during cooking. 3.2.1. Changes in Total Phenolic Content and Antioxidant
 In the current study, the microwave-cooked rice had Activity after Cooking. After cooking under both conven-
higher adhesiveness than from conventional cooking, sug- tional and microwave conditions, the TPC of cooked rice
gesting that microwaving leached more components (total (214.41–246.89 mg GAE/100 g db) decreased substantially
solid loss, starch, amylose, and amylopectin) than from compared to that of the rice grain (302.22 mg GAE/100 g
conventional cooking because the microwave energy could db), as shown in Table 3. Conventional cooking (EC3)
weaken the interaction between the amylose and amylopectin resulted in a significant loss of 29.05% in the TPC in the
and improve their dispersion and separation. Li et al. [23] cooked rice, but the TPC loss was reduced by 18.31, 20.21,
mentioned that stickiness of cooked rice was affected by the and 18.86% for L-MC2, M-MC2, and H-MC2, respectively.
total amount of amylopectin, the proportion of short amy- The free radical scavenging activity of cooked rice was
lopectin chains, and the amylopectin molecular size in the measured using two different methods (DPPH and ABTS
leachate. Furthermore, the protein content in rice was con- assays), to reduce the interference by other substances in the
sidered as a secondary factor affecting the starch molecular test. The scavenging activities of rice grains were 157.09 and
structure and was related to cooked rice adhesiveness [5]. 407.03 mg·TE/100 g db for DPPH and ABTS, respectively.
 Conventionally cooked rice had the lowest springiness. The DPPH scavenging activity of the cooked rice
Cooking at low and medium microwave power (L-MC1, (117.01–137.15 mg·TE/100 g db) was lower than ABTS
L-MC2, M-MC1, and M-MC2) produced no significant scavenging activity (230.05–311.85 mg·TE/100 g db), as
differences in springiness, though at high microwave power shown in Table 3. The lower activity in the DPPH assays may
(H-MC1), springiness was higher than that for H-MC2 have been due to chemical mechanisms. The DPPH assay
(Table 2). Therefore, the rice-to-water ratio may influence generally measures hydrophilic antioxidants, while the ABTS
springiness only under high-power conditions. Cohesive- assay determines both lipophilic and hydrophilic antioxidants
ness is the internal force holding rice together and indicates [27]. Compared to rice grains, the loss of DPPH and ABTS
the amount of compression before breaking. Microwave activities in conventionally cooked rice was 25.52 and 43.48%,
cooking at high power (H-MC2) tended to result in similar whereas for microwave cooking, the ranges were
cohesiveness (0.47) and chewiness (36.15) to those obtained 12.69–14.55% and 23.38–25.61%, respectively. There was no
from the control (Table 2). It was noticeable that cohe- significant difference in the TPC and antioxidant activities of
siveness and chewiness values decreased with an increase in the cooked rice when cooked at either low or high microwave
the rice-to-water ratio, and these values varied depending on power. The decrease in the antioxidant activities after cooking
the rice-to-water ratios for both low and high power of was consistent with the reduction in the TPC. These results
microwave cooking. These results were in agreement with indicated that the TPC contributed to antioxidant activities in
the findings by Chusak et al. [24] that cohesiveness Riceberry rice. After cooking, the decrease in the TPC and the
depended on the nature of the food and the external factors scavenging activity of conventionally cooked rice was greater
such as the moisture content and the temperature. The than that from microwaving.
microwave-cooked rice had a low chewiness value, similar to The percentage loss could be related to cooking con-
the conventionally cooked rice, when the high initial rice-to- ditions such as the rice-to-water ratio, heating source, and

Journal of Food Quality 7

 Table 2: Texture profiles of cooked rice from conventional cooking and microwave cooking.
Treatment Hardness (N) Adhesiveness (g.sec) Springiness (−) Cohesiveness (−) Chewiness (−)
EC3 162.03 ± 4.08b −671.58 ± 42.64a 0.40 ± 0.05d 0.46 ± 0.00c 30.68 ± 3.58d
L-MC1 180.11 ± 7.17a −741.54 ± 47.13a 0.56 ± 0.07ab 0.51 ± 0.03a 53.62 ± 11.01ab
L-MC2 166.72 ± 4.62b −886.57 ± 42.81b 0.54 ± 0.05b 0.49 ± 0.01b 44.60 ± 6.39c
M-MC1 176.13 ± 5.42a −828.66 ± 81.00b 0.53 ± 0.09bc 0.50 ± 0.01ab 47.66 ± 9.82bc
M-MC2 166.35 ± 7.98b −1013.26 ± 182.22c 0.53 ± 0.06bc 0.49 ± 0.01b 44.39 ± 7.47c
H-MC1 175.21 ± 8.22a −1064.35 ± 67.01cd 0.62 ± 0.08a 0.50 ± 0.02ab 56.20 ± 12.07a
H-MC2 162.35 ± 5.86b −1118.02 ± 53.60d 0.47 ± 0.04c 0.47 ± 0.01c 36.15 ± 5.20d
Data expressed as mean ± standard deviation in triplicate; a–ddifferent superscript letters indicate a significant (P ≤ 0.05) difference. EC: conventional cooking
using an electric rice cooker, L-MC: microwave cooking using low power level, M-MC: microwave cooking using medium power level, and H-MC: microwave
cooking using high power level. 1: low water ratio, 2: medium water ratio, and 3: high water ratio.

Table 3: Total phenolic content and antioxidant activity of the rice grain and the cooked rice from conventional cooking and microwave
cooking.
 Total phenolic content Scavenging activity using DPPH Scavenging activity using ABTS
Sample
 (mg GAE/100 g db) (mg TE/100 g db) (mg TE/100 g db)
Riceberry rice grain 302.22 ± 2.47a 157.09 ± 0.02a 407.03 ± 2.26a
EC3 214.41 ± 4.78c 117.01 ± 2.64c 230.05 ± 11.58c
L-MC2 246.89 ± 4.68b 134.98 ± 1.21b 311.85 ± 2.90b
M-MC2 241.15 ± 2.68b 134.24 ± 1.13b 304.91 ± 1.52b
H-MC2 245.22 ± 1.97b 137.15 ± 0.99b 302.80 ± 12.52b
Data expressed as mean ± standard deviation in duplicate; a-cdifferent superscript letters indicate a significant (P ≤ 0.05) difference. EC: conventional cooking
using an electric rice cooker, L-MC: microwave cooking using low power level, M-MC: microwave cooking using medium power level, and H-MC: microwave
cooking using high power level; 1: low water ratio, 2: medium water ratio, and 3: high water ratio.

cooking time. The decline has also been attributed to the burnt on the bottom of the container used in electric cooking
oxidation of malvidin-3-glucoside and malvidin-3,5-diglu- as this would be the hottest area. In contrast, no rice layer
cosides as a long conventional cooking time (37 min), and was formed or deposited on the microwave rice-steaming
characteristics of individual phenolic compounds could affect container because no hot surface is required for microwave
the loss of antioxidants [14]. The yield of anthocyanins in the heating. Therefore, component leaching, thermal decom-
grape skin could be improved by using high microwave position, and interaction mainly with the protein content
energy since heat treatment partially breakdowns an ester were considered as possible factors responsible for the de-
bond between the bound phenolic compounds and cell walls crease in the phenolic content of the pigmented rice during
to release some free phenolic compounds. According to the conventional cooking. In addition, the presence of sugars
degradation pathway of malvidin-3-glucoside and malvidin- and phenolic acids could help to maintain anthocyanin
3,5-diglucoside under microwave treatment, the formation of stability [4]. Thus, the effect of cooking process on the
anthocyanone A, hydroxycoumarins, dihydroxy phenyl- degradation mechanism of anthocyanin and phenolic acid
acetaldehyde, and eight other compounds was detected in the should be carefully identified and quantified with the ex-
microwave-treated samples at 700 W. In contrast, those istent compounds in further study.
compounds were not found in samples heated using a water
bath at 98 ± 2°C. The direct microwave effect formed hy-
drogen peroxide, resulting in Baeyer–Villiger-type oxidation, 3.2.2. Changes in Chemical Composition. Changes in cooked
which was the main degradation pathway. With this reaction, rice composition such as the ash, fat, fiber, protein, and
anthocyanins were oxidized to form a derivative of the carbohydrate contents after different cooking conditions are
benzoyloxyphenyl acetic acid ester, which was named mal- shown in Table 4. Under all cooking conditions, there were
vone. Then, malvone was further hydrolyzed to form syringic no significant difference in the ash or total dietary fiber
acid and anthocyanone. At the same time of oxidation, the contents. However, conventional cooking (control) resulted
conventional degradation pathway of anthocyanins also oc- in the lowest protein content (11.11%) of any of the cooking
curred [28]. Therefore, the higher remaining TPC and an- conditions. Notably, there were no significant differences in
tioxidant activity in the microwave-cooked rice was attributed the protein content among all microwave-cooked rice
to the difference in the degradation pathway and the for- samples. This indicated that conventional cooking promoted
mation of new degraded products that may not be found in the leaching of protein from rice grains to the cooking water,
conventionally cooked rice. while microwave cooking slowed down biochemical reac-
 Another factor that may attribute to the great loss in tions and some changes in the molecular conformation of
conventionally cooked rice was from rice partially stuck and the protein [29].
8 Journal of Food Quality

Table 4: Chemical composition of the Riceberry rice grain (Oryza sativa L.) and the cooked rice from conventional cooking and microwave
cooking.
 Protein Carbohydrate Total starch
Sample Ash content (% db) Fat (% db) Fiber (% db) Estimated GI
 (% db) (% db) (% in db)
Raw riceberry rice grain 1.48 ± 0.02a 3.27 ± 0.02a 2.46 ± 0.04a 12.31 ± 0.03a 72.89 ± 0.03d — —
EC3 1.44 ± 0.01a 3.30 ± 0.03a 2.29 ± 0.07a 11.11 ± 0.07b 78.23 ± 0.18a 75.27 ± 1.84a 73.00 ± 0.04a
L-MC2 1.47 ± 0.02a 3.23 ± 0.03a 2.44 ± 0.16a 12.03 ± 0.30a 76.91 ± 0.16c 74.27 ± 1.26a 73.11 ± 0.43a
M-MC2 1.45 ± 0.00a 3.22 ± 0.04a 2.32 ± 0.09a 12.11 ± 0.26a 77.56 ± 0.24b 75.29 ± 0.84a 73.01 ± 0.29a
H-MC2 1.47 ± 0.01a 3.06 ± 0.10b 2.32 ± 0.09a 12.01 ± 0.04a 77.48 ± 0.13b 75.90 ± 0.75a 73.01 ± 0.83a
Data expressed as mean ± standard deviation in triplicate; a-ddifferent superscript letters indicate a significant (P ≤ 0.05) difference. EC: conventional cooking
using an electric rice cooker, L-MC: microwave cooking using low power level, M-MC: microwave cooking using medium power level, and H-MC: microwave
cooking using high power level. 1: low water ratio, 2: medium water ratio, and 3: high water ratio.

 Using high microwave power caused a significant re- antioxidant activity. This alternative to the conventional rice
duction in the fat content of the cooked rice compared with cooker method could reduce the cooking time by 14–18%
the other conditions. This might have been directly corre- and preserve nutritional quality. Consumption of Riceberry
lated to the loss of the detached oil bodies through a small rice cooked in a microwave oven could maximize health
opening between the paleal and lemma during the hydration benefits like antioxidant activity while producing a com-
of rice [30]. The conventionally cooked rice had a high parable textural quality.
proportion of carbohydrate (78.23%) since its protein
content was more affected than by microwave cooking. Data Availability
 The GI is a physiological measure used to classify food
rich in carbohydrate, based on the food’s potential to raise The data used to support the findings in this study are
the blood glucose level. Rice is considered to be a high-GI available from the corresponding author upon request.
food (GI > 70). The differences in the starch digestibility of
cooked rice have been attributed to the disruption of starch
gelatinization, structure modification, breakdown of the cell Conflicts of Interest
wall, and protein denaturation [31]. In the current study, the The authors have no conflicts of interest.
GI values of all cooked rice samples were in the range
73.00–73.11 and were not significantly different. Thus, as the
GI was greater than 70, the cooked Riceberry rice was Acknowledgments
classified as having a high glycemic index. Cooking possibly
 Financial support was provided by the Kasetsart University
increased the rate of hydrolysis, and the gelatinized starch of
 Research and Development Institute (KURDI), Bangkok,
the freshly cooked rice was readily available for the enzy-
 Thailand, and the Department of Product Development and
matic attack because cooking increased the space around
 Faculty of Agro-Industry, Kasetsart University.
crystallites through the swelling of starch grains and de-
creased the continuity in the construction of protein by
changing the structure of starch molecules [22, 32]. Thus, References
cooking using the electric cooker or the microwave oven did
 [1] F. Ayimbila and S. Keawsompong, “Effect of processing
not produce a significant change in the GI. This coincided
 procedures on in vitro digestibility and colonic fermentation
with that reported by Chapagai et al. [33] that there were no of Riceberry rice,” Journal of Microbiology, Biotechnology and
GI differences among different cooked rice samples although Food Sciences, vol. 8, no. 3, pp. 940–946, 2018.
there were some differences in the amount of amylose-lipid [2] P. Wiriyawattana, S. Suwonsichon, and T. Suwonsichon,
complexes. “Effects of drum drying on physical and antioxidant prop-
 erties of riceberry flour,” Agriculture and Natural Resources,
4. Conclusion vol. 52, no. 5, pp. 445–450, 2018.
 [3] M. Peanparkdee, R. Yamauchi, and S. Iwamoto, “Charac-
In general, rice is conventionally cooked in an electric terization of antioxidants extracted from Thai riceberry bran
cooker. However, by changing to microwave cooking, the using ultrasonic-assisted and conventional solvent extraction
rate constant of the temperature profile and increased water methods,” Food and Bioprocess Technology, vol. 11, no. 4,
uptake during cooking were significantly improved. The pp. 713–722, 2017.
initial rice-to-water ratio significantly influenced the texture [4] S. Yamuangmorn, B. Dell, and C. Prom-u-thai, “Effects of
of the cooked rice. Both microwave cooking and conven- cooking on anthocyanin concentration and bioactive anti-
 oxidant capacity in glutinous and non-glutinous purple rice,”
tional cooking produced similar results for the texture, total
 Rice Science, vol. 25, no. 5, pp. 270–278, 2018.
starch content, and GI. In terms of bioactive compounds, [5] H. Li and R. G. Gilbert, “Starch molecular structure: the basis
microwave cooking could retain higher levels of TPC and for an improved understanding of cooked rice texture,”
antioxidant activities in the cooked rice than from con- Carbohydrate Polymers, vol. 195, pp. 9–17, 2018.
ventional cooking. Therefore, microwave cooking could be [6] M. Tamura, T. Nagai, Y. Hidaka, T. Noda, M. Yokoe, and
recommended for Riceberry rice which has an inherent high Y. Ogawa, “Changes in histological tissue structure and

Journal of Food Quality 9

 textural characteristics of rice grain during cooking process,” [23] H. Li, J. Yang, M. Gao, J. Wang, and B. Sun, “Washing rice
 Food Structure, vol. 1, no. 2, pp. 164–170, 2014. before cooking has no large effect on the texture of cooked
 [7] Y. H. Shinde, A. Vijayadwhaja, A. B. Pandit, and J. B. Joshi, rice,” Food Chemistry, vol. 271, pp. 388–392, 2019a.
 “Kinetics of cooking of rice: a review,” Journal of Food En- [24] C. Chusak, J. A. Y. Ying, J. L. Zhien et al., “Impact of Clitoria
 gineering, vol. 123, pp. 113–129, 2014. ternatea (butterfly pea) flower on in vitro starch digestibility,
 [8] G. Mishra, D. C. Joshi, D. Mohapatra, and V. B. Babu, texture and sensory attributes of cooked rice using domestic
 “Varietal influence on the microwave popping characteristics cooking methods,” Food Chemistry, vol. 295, pp. 646–652,
 of sorghum,” Journal of Cereal Science, vol. 65, pp. 19–24, 2019.
 2015. [25] L. Yu, M. S. Turner, M. Fitzgerald, J. R. Stokes, and T. Witt,
 [9] A. S. T. Ferreira, J. Naozuka, G. A. R. Kelmer, and “Review of the effects of different processing technologies on
 P. V. Oliveira, “Effects of the domestic cooking on elemental cooked and convenience rice quality,” Trends in Food Science
 chemical composition of beans species (phaseolus vulgaris & Technology, vol. 59, pp. 124–138, 2017.
 l.),” Journal of Food Processing, vol. 2014, p. 6, Article ID [26] H. Li, J. Yang, S. Yan, N. Lei, J. Wang, and B. Sun, “Molecular
 972508, 2014. causes for the increased stickiness of cooked non-glutinous
[10] S. Subramaniam, M. H. B. Rosdi, and U. R. Kuppusamy, rice by enzymatic hydrolysis of the grain surface protein,”
 “Customized cooking methods enhance antioxidant, anti- Carbohydrate Polymers, vol. 216, pp. 197–203, 2019b.
 glycemic, and insulin-like properties of Momordica charantia [27] W. Daiponmak, C. Senakun, and S. Siriamornpun, “Anti-
 glycation capacity and antioxidant activities of different
 and Moringa oleifera,” Journal of Food Quality, vol. 2017,
 pigmented Thai rice,” International Journal of Food Science &
 Article ID 9561325, 9 pages, 2017.
 Technology, vol. 49, no. 8, pp. 1805–1810, 2014.
[11] A. M. Kalla and R. Devaraju, “Microwave energy and its
 [28] M. Zhao, Y. Luo, Y. Li et al., “The identification of degradation
 application in food industry: a reveiw,” Asian Journal of Dairy
 products and degradation pathway of malvidin-3-glucoside
 and Food Research, vol. 36, no. 1, pp. 37–44, 2017.
 and malvidin-3, 5-diglucoside under microwave treatment,”
[12] M. Gavahian, Y.-H. Chu, and A. Farahnaky, “Effects of ohmic
 Food Chemistry, vol. 141, no. 3, pp. 3260–3267, 2013.
 and microwave cooking on textural softening and physical [29] S. Zhao, S. Xiong, C. Qiu, and Y. Xu, “Effect of microwaves on
 properties of rice,” Journal of Food Engineering, vol. 243, rice quality,” Journal of Stored Products Research, vol. 43,
 pp. 114–124, 2019. no. 4, pp. 496–502, 2007.
[13] K. Kanjanapongkul, “Rice cooking using ohmic heating: [30] S. J. Kale, S. K. Jha, G. K. Jha, J. P. Sinha, and S. B. Lal, “Soaking
 determination of electrical conductivity, water diffusion and induced changes in chemical composition, glycemic index
 cooking energy,” Journal of Food Engineering, vol. 192, and starch characteristics of basmati rice,” Rice Science,
 pp. 1–10, 2017. vol. 22, no. 5, pp. 227–236, 2015.
[14] R. Chatthongpisut, S. J. Schwartz, and J. Yongsawatdigul, [31] S. Wang, P. Li, T. Zhang, J. Yu, S. Wang, and L. Copeland, “In
 “Antioxidant activities and antiproliferative activity of Thai vitro starch digestibility of rice flour is not affected by method
 purple rice cooked by various methods on human colon of cooking,” Lwt, vol. 84, pp. 536–543, 2017.
 cancer cells,” Food Chemistry, vol. 188, pp. 99–105, 2015. [32] M. Tamura, J. Singh, L. Kaur, and Y. Ogawa, “Impact of the
[15] B. O. Juliano, The Rice Grain and its Gross Composition, degree of cooking on starch digestibility of rice - an in vitro
 Chemistry and Technologypp. 17–58, Elsevier, Amsterdam, study,” Food Chemistry, vol. 191, pp. 98–104, 2016.
 Netherlands, 2nd edition, 1985. [33] M. K. Chapagai, N. A. Bakar, R. A. Jalil et al., “Glycaemic
[16] J. Wu, J. Chen, W. Liu et al., “Effects of aleurone layer on rice index values and physicochemical properties of five brown
 cooking: a histological investigation,” Food Chemistry, rice varieties cooked by different domestic cooking methods,”
 vol. 191, pp. 28–35, 2016. Functional Foods in Health and Disease, vol. 6, no. 8, p. 506,
[17] AOAC, Official Methods of Analysis of the Association of 2016.
 Official Analytical Chemists, AOAC, Washington DC, USA,
 Seventeen edition, 2000.
[18] C. Lerdluksamee, K. Srikaeo, J. A. M. Tutusaus, and
 J. G. Diéguez, “Physicochemical properties and starch di-
 gestibility of Scirpus grossus flour and starch,” Carbohydrate
 Polymers, vol. 97, no. 2, pp. 482–488, 2013.
[19] P. A. Sopade and M. J. Gidley, “A rapid in-vitro digestibility
 assay based on glucometry for investigating kinetics of starch
 digestion,” Starch—Stärke, vol. 61, no. 5, pp. 245–255, 2009.
[20] H. Ekka, D. Padhee, L. Sharma, M. Diwakar, R. Lahari, and
 S. Tiwari, “Study of cooking quality of selected varieties of rice
 at varying temperature using induction heater,” International
 Journal of Food Science and Nutrition, vol. 1, no. 2, pp. 4–7,
 2016.
[21] A. Briffaz, P. Bohuon, J.-M. Méot, M. Dornier, and C. Mestres,
 “Modelling of water transport and swelling associated with
 starch gelatinization during rice cooking,” Journal of Food
 Engineering, vol. 121, pp. 143–151, 2014.
[22] M. He, C. Qiu, Z. Liao, Z. Sui, and H. Corke, “Impact of
 cooking conditions on the properties of rice: combined
 temperature and cooking time,” International Journal of Bi-
 ological Macromolecules, vol. 117, pp. 87–94, 2018.
You can also read