Quantification of dissolved O2 in bulk aqueous solutions and porous media using NMR relaxometry
←
→
Page content transcription
If your browser does not render page correctly, please read the page content below
www.nature.com/scientificreports
OPEN Quantification of dissolved
O2 in bulk aqueous solutions
and porous media using NMR
relaxometry
Kurt Livo1*, Manika Prasad1 & Trent R. Graham2
Effects of dissolved paramagnetic oxygen (O2) in water on 1H nuclear magnetic resonance (NMR)
Carr-Purcell-Meiboom-Gill (CPMG) experiments is evaluated at a 1H Larmor frequency of 2 MHz.
Dissolution of O2 into water significantly reduces the 1H transverse relaxation coefficient (T2). For
deoxygenated water, T2 is 3388 ms, water at ambient atmospheric conditions (7.4 mg/L O2) exhibits
a T2 of 2465 ms, and dissolution of 2710 mg/L O2 further reduces T2 to 36 ms. The results were fit with
an empirical model to facilitate prediction of T2 times for bulk water as a function of paramagnetic
oxygen concentrations in solution. Dissolved O2 also greatly influences 1H NMR CPMG experiments
of confined water in a model system composed of Berea sandstone. For this system, 90 mg/L O2 in
H2O enhances T2 relaxation of bulk water such that the relaxation time is comparable to physically
confined water in the sandstone pores. Given the sensitivity of NMR T2 coefficients to paramagnetic
oxygen, low-field NMR-based characterization of fluid and porous media structure requires control of
dissolved oxygen, as geospatial variation in the partial pressure of O2 alone is expected to perturb fluid
and pore relaxation times by up to 60 and 36%, respectively.
Low-field (2 MHz) nuclear magnetic resonance (LF-NMR) relaxometry provides physical properties of hydrogen-
bearing fluids such as viscosity. LF-NMR experiments of porous media saturated with hydrogen proton bearing
fluids yield pore structure information such as porosity, pore size distribution, and p ermeability1–3 by prob-
ing interactions of fluids with grain surfaces4–7. In such porous media studies, surface relaxation mechanisms,
primarily controlled by paramagnetic elements such as iron and manganese associated with clay minerals and
sulfides on grain surfaces, yield faster relaxation times8–12. The paramagnetic surface properties of the grains
dominate proton relaxation at time scales greatly below bulk relaxation or diffusion-driven mechanisms leading
to a simplified NMR relaxation equation that ignores free fluid and diffusion responses.
Qualitative NMR studies suggest that the presence of oxygen molecules in solution alters both electron spin
and nuclear spin relaxation r ates10,13–15. In high-field NMR spectroscopy, enhanced relaxation due to para-
magnetic oxygen in proteins and lipids at elevated pressures yields information about protein structure and
interactions16–20. At low magnetic fields and in simple aqueous solutions of deoxygenated water, the experimental
1
H transverse relaxation coefficient (T2) is between 3400 and 3600 ms21,22. In LF-NMR studies, dissolved oxygen
in aqueous solutions disrupts proton precession and decreases relaxation times15,22–24. In addition to influenc-
ing nuclear spin relaxation in aqueous systems, dissolved oxygen in organic solutions has been found to reduce
the relaxation time of hydrocarbons with dependence on hydrocarbon molecular weight, correlating with the
dependence on the oil’s density and v iscosity25–27. A predictive understanding of the effects of dissolved oxygen
is similarly fundamental to the calculation of fluid properties and porous media structure.
To evaluate the sensitivity of dissolved oxygen on LF-NMR T2 based characterization of fluid properties and
porous media structure, T 2 relaxation times in bulk water were determined as a function of paramagnetic oxygen.
An empirical formula was then developed to relate the dissolved oxygen concentration to the T2 of bulk water. In
addition, the effects of dissolved O 2 were demonstrated in water saturated sandstone cores. The results demon-
strate that dissolved paramagnetic O 2 in water saturated sandstone cores alters the LF-NMR T 2 relaxation times
of water by two orders of magnitude to overlap with T2 relaxation times typically attributed to water interacting
with the surface. This work demonstrates that dilute amounts of dissolved oxygen produces significant errors in
1
Center for Rock & Fluid Multiphysics, Colorado School of Mines, Golden, CO 80401, USA. 2Pacific Northwest
National Laboratory, Richland, WA 99352, USA. *email: klivo@mymail.mines.edu
Scientific Reports | (2021) 11:290 | https://doi.org/10.1038/s41598-020-79441-5 1
Vol.:(0123456789)
www.nature.com/scientificreports/
Figure 1. 1H NMR T2 relaxation distributions of bulk H2O during O2 pressurization (blue) and
depressurization (red). Distributions are shifted vertically to prevent overlap in order to show relative changes at
each pressure step. The distributions sum to unity, with additional discussion of y-axis intensities detailed in the
main text.
calculation of pore size distributions and permeability, and that characterization of fluid properties and porous
media structure is best done under anoxic conditions.
Results
Studies of dissolved oxygen in bulk water. The initial results detail the effects of dissolved oxygen on
the T2 properties of bulk water. The T2 logarithmic mean (T2LM) of the distributions inverted from the NMR
magnetization decay were found to decrease systematically with pressure as shown in Fig. 1. Additional details,
such as the mole fraction of O2 in solution, are provided in Table S1 in the Supporting Information.
To provide a baseline T
2 value for water at laboratory pressure and temperature (PT) conditions, T 2 was meas-
ured for settled DI water in a pressure vessel under ambient atmosphere and ambient PT. As shown in Fig. 1 and
Table S1, the T2LM value of H2O at laboratory PT conditions (pO2 = 2.50 psia, where pO2 is the partial pressure
of oxygen) was 2465 ms. With application of vacuum, T2LM increased to 3129 ms at p O2 = 0.64 psia (vacuum
of − 18.0 in. Hg), and to 3388 ms at pO2 = 0.02 psia (− 24 in. Hg vacuum). Then by pressurization with 100 psig
O2 gas, the T2LM of H 2O decreased 91% to 294 ms, relative to the vacuumed state (− 18.0 in. Hg). Further O 2
pressurization up to 1000 psig yielded a final T2LM value of 37 ms.
The decrease in the breadth of the T2LM distribution at higher oxygen pressures can be attributed to the
logarithmic spacing of the inversion using the Lawson and Hanson method28 where more data sampling occurs
at smaller time intervals. This causes the bin size of the T 2 distribution to vary nonlinearly. The higher amount
of sampling steps at smaller time intervals leads to greater precision in T2LM calculations at small T2, which can
be seen by the narrower distributions at the higher oxygen pressures.
Repeated pressure steps in Fig. 2 demonstrate overall agreement between T2LM values during pressuriza-
tion and depressurization with oxygen. For example, the differences in T2LM are less than 4 ms at pressures
greater than 100 psig. However, there is imperfect hysteresis upon return to 0 psig. After depressurization and
subsequent vacuum to − 18.0 in. Hg to match the pressure of the initial state, the T2LM value was 2238 ms, more
than 890 ms shorter than the initial value of 3129 ms. The deviation between T2LM values at ambient pressure is
attributed to the presence of a mixture of dissolved gases from air, and is further detailed in “Discussion” section.
The systematic reduction in T2LM with absolute O2 partial pressure is well fit by a power law (Fig. 2). The
power law model to describe the T2LM – pressure relationship at 21.1 °C, is:
T2LM = 3503 ∗ pO−0.627
2 (1)
where, T2LM is T2 logarithmic mean with units of ms and pO2 is the absolute oxygen partial pressure with units
of psia.
Scientific Reports | (2021) 11:290 | https://doi.org/10.1038/s41598-020-79441-5 2
Vol:.(1234567890)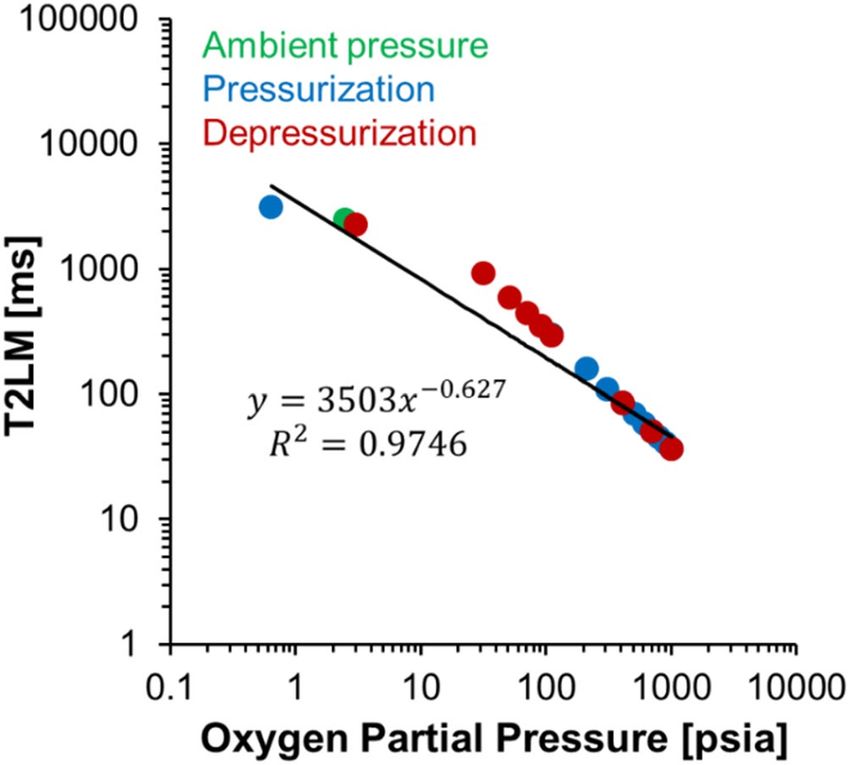
www.nature.com/scientificreports/
Figure 2. T2LM values of bulk H2O as a function of O 2 pressure shown on a log–log scale. Note the large
reduction in relaxation of the fluid within the first 100 psi. Good agreement is seen in the T2LM values at 700,
400, and 100 psig regardless of the pressure path. The empirical correlation presented utilizes only pressurization
data points following vacuuming of the sample. The line is the regressed power law function, which corresponds
to an R2 value of 0.9746.
Figure 3. 1H NMR T2 relaxation distributions of water-saturated Berea core samples with excess bulk fluid
surrounding the core under vacuum, at ambient pressure, and with an applied pressure of 10 psig O 2. A portion
of the distribution is magnified ×8 and offset to facilitate inspection of the components attributed to water in
large and small pores. The magnified portion is annotated and shown with greater transparency.
Studies of dissolved oxygen in water‑saturated Berea sandstone. Next, the effect of p O2 vari-
ation on T 2 relaxation was evaluated for a water-saturated Berea sample with excess free-fluid. The bulk fluid
surrounding the core prevents drying at varying oxygen pressures and comprised 91.46% of the total detectible
water fraction in the pressure vessel at ambient conditions. Due to the multi-exponential decay of NMR signals,
discrete portions of the T2 distributions can be identified for the bulk fluid, large pores, and small pores of the
Berea core.
The bulk fluid portion resides in between the pressure vessel and core surfaces, and exhibits a smaller T2
than bulk water (Fig. 1) likely due to surface interactions. NMR measurements of the Berea core at ambient
pressure in air ( pO2 = 2.50 psia) resulted in a T2LM of 2407 ms for bulk water, 264 ms for water in the large
diameter pores, and 53 ms for water in small diameter pores (Fig. 3). When subjected to vacuum of − 24.0 in. Hg
Scientific Reports | (2021) 11:290 | https://doi.org/10.1038/s41598-020-79441-5 3
Vol.:(0123456789)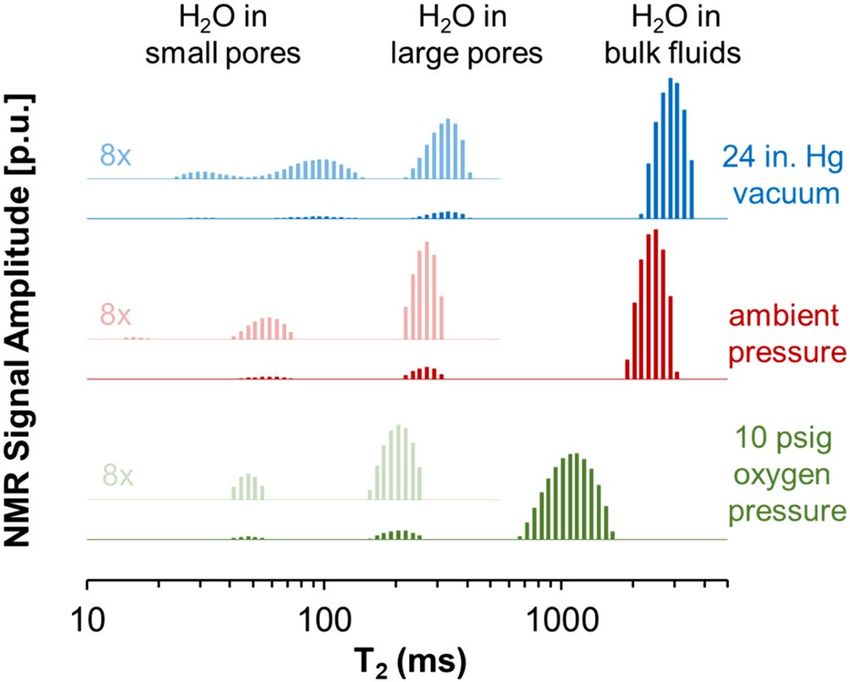
www.nature.com/scientificreports/
( pO2 = 0.02 psia), the T2LM of the bulk fluid increased to 2872 ms. Similarly, T2LM of water in the pore fractions
also increased to 317 ms in large pores and to 72 ms in small pores. As tabulated in Table S2 in the Supporting
Information, measurements performed with 10 psig ( pO2 = 21.90 psia) of oxygen decreased the T2LM values to
values of 1086 ms for bulk fluid, 204 ms for water in large pores and 48 ms for water in small pores. Notably, in
addition to changes in T2LM values, there was also a reduction in the total detectable pore fluid by about 11.3%
following O2 pressurization.
Discussion
Paramagnetic properties of O 2 are known to decrease 1H NMR T2 relaxation t imes14,15,23,24,29. Mechanistically,
this is caused by a disruption of the hydrogen precession by dissolved O214,22,27 controlled by the distribution
and magnetic susceptibility of paramagnetic agents in solution. The number of molecular collisions between the
paramagnetic oxygen and hydrogen bearing molecules of the DI water during Brownian motion can dominate
relaxation pathways even with dissolved oxygen concentrations at pressures as low as 20 psig. The oxygenated
free water relaxation time can coincide with relaxation times typical of surface relaxation mechanisms in porous
media.
Changes in solution composition due to pressurization with O 2 can be estimated from Multiflash calculations
where an increase in oxygen from the vacuumed state to 100 psig yields a molar fraction of oxygen in solution
of only 2.00 × 10⁻⁴ mol O2/mole H2O. Therefore, even trace amounts of dissolved O2 lead to a massive 90.62%
reduction in relaxation time (Figs. 1 and 2). The increase in gas in solution from atmospheric pressure to 100
psig results in an increase in oxygen concentration from 2.43 × 10⁻⁵ to 1.68 × 10⁻⁴ mol O2/mole H2O (43.25 to
297.97 mg O2/L H2O) and an order of magnitude reduction in the 1H NMR transverse relaxation coefficient.
Oxygen pressures greater than 100 psi results in smaller changes in relaxation times because the addition of more
O2 molecules in solution is above a critical concentration where increased collision rate yields little additional
relaxation.
We can characterize the number of collisions between O 2 and H 2O molecules in solution due to Brownian
motion using a characteristic distance traveled by an O 2 molecule in solution during a time increment equivalent
2 relaxation coefficient. Using the diffusion coefficient ( D ) of O2 in water of 2 × 1 0–5 cm2/s30, the charac-
to the T
teristic diffusion length of O2, L [cm], is:
√
L = 6 ∗ D ∗ T2LM, (2)
Using the intermolecular oxygen distances of water in a stable dimer configuration of 2.97 Å31, the number
of total collisions between water and oxygen molecules during the timespan of T2LM (C ) was calculated for
each pressure per volume using Eq. (4):
C = (L ∗ n)/d, (3)
3 -3
where C is the number of O 2 collisions with water molecules per cm of volume [cm ], L is the aforementioned
characteristic diffusion length of O 2 in solution during T 2 relaxation [cm], d is the intermolecular oxygen dis-
tances of water [cm], n is the number of O2 molecules per volume of water [ cm−3].
The total number of collisions increases from 2.35 × 10²²/cm3 H2O at − 18.0 in. Hg vacuum (pO2 = 0.64 psia),
to 3.60 × 1024/cm3 H2O at an oxygen pressure of 1000 psig. The increase in the number of molecular collisions
between H2O and O2 in solution results in the reduction of NMR T2LM from 3129 to 37 ms. The reduction
in relaxation time occurs with a linear increase in the solubility of oxygen. As a result, the main mechanism of
surface relaxation observed in NMR studies of porous media can be masked by fluid effects in oxygenated fluid
systems, even at O2 pressures below 100 psig.
The imperfect hysteresis of T2LM in bulk water following pressurization and depressurization is next dis-
cussed (Fig. 2). The imperfect hysteresis can be attributed to the greater partial pressure of oxygen in the head-
space relative to that in air, which occupied the headspace in the initial measurement. In addition, other gases
in air can be more soluble than O 2. For example, Fig. 4 shows that C O2 in aqueous solution is approximately 30
times more soluble than O 2 at comparable pressures. Conversely, the solubility of O 2 is only about twice that of
N2 and ethane and methane in solution at corresponding pressures showing that other gas fractions compete
with O2 in solution. The vacuumed sample prior to pressurization still contains trace amounts of N2, O2, CO2
and other trace amounts of gases from the atmosphere. As pressurization with pure O 2 occurs, these trace frac-
tions are replaced with higher relative percentages of O 2 in solution. Following the depressurization of the DI
water sample, higher relative percentages of oxygen in solution account for the difference in the starting value of
3129 ms (pO2 = 0.64 psia) to 2238 ms ( pO2 = 3.06 psia) values of relaxation at an applied vacuum of − 18 in. Hg.
The empirical relation presented in this work provides a correlation between NMR relaxation and O2 in
solution as a function of pressure that could be well fit by a power model. This is observed by the linear trend
of the line of best fit on the log–log plot (Fig. 2) where an increase in relative concentrations of O2 results in a
proportional inverse relative change in relaxation time of water, a trend well described by power law relationships.
Similarly, power law relationships are well established to model behaviors in fluid properties such as viscosity.
Here, our power law relation describes the increased disruptions in precessional relaxation of hydrogen in solu-
tion with introduced paramagnetic O2 due to reduced O 2 diffusional distance and time before proton interaction
occurs, increased frequency of random molecular interaction between O2 and H2O due to Brownian motion, and
increased total paramagnetism of the fluid. In this fitting equation, the power law constant of − 0.627 is defined
by these multivariate interactions that result in enhanced fluid relaxation in NMR controlled by temperature,
viscosity modification with introduced O2, and paramagnetic properties of the gas in water. Our empirical rela-
tion similarly shows a lack of well-defined T2LM values at low pressures, a limitation typical of many power law
systems. However, our experimental maximum relaxation time of oxygen-free water (3.4 s), is in agreement with
Scientific Reports | (2021) 11:290 | https://doi.org/10.1038/s41598-020-79441-5 4
Vol:.(1234567890)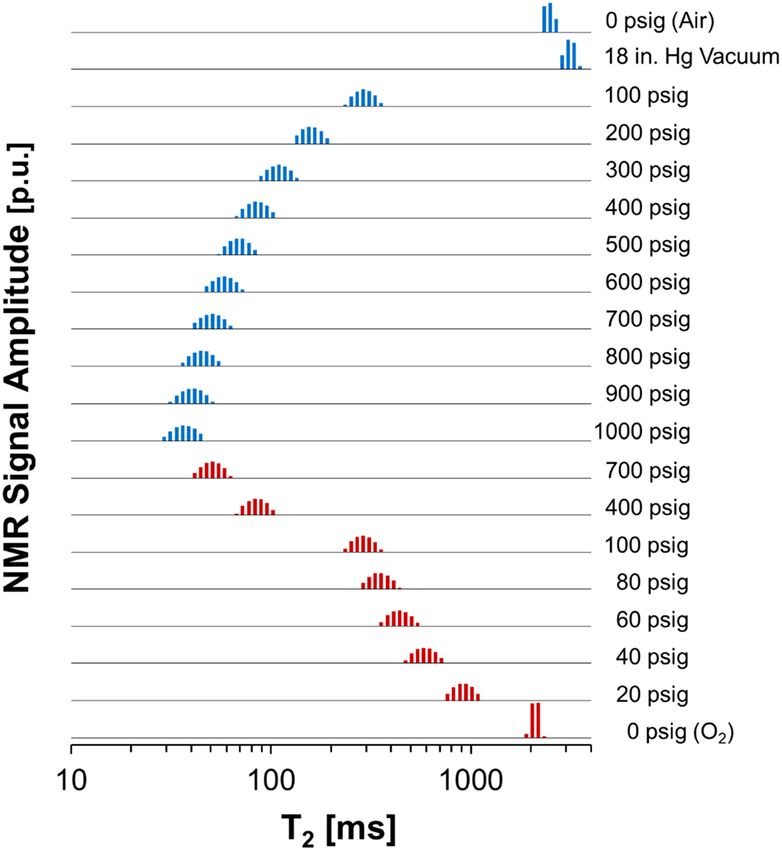
www.nature.com/scientificreports/
Figure 4. Solubility of different gases as a function of pressure in DI water generated using Multiflash advanced
thermodynamic modeling software. The inset image is used to show the lower solubility values of common
hydrocarbon and non-hydrocarbon gases: oxygen, methane, ethane, and nitrogen over the pressure range of the
calculated values. The inflection of the solubility curves from near linear trends (Ethane and Carbon Dioxide) is
caused by conversion of the gases into the liquid or critical phase at that pressure step.
Figure 5. Global T2LM values calculated from topographic elevations and calculated partial oxygen pressures
in 1 Degree Longitudinal and Latitudinal steps (generated using MATLAB Software Version 9.4, https://www.
mathworks.com/products/compiler/matlab-runtime.html). Values range from 1728 ms at sea level to 2775 ms in
the Himalayan region resulting in a 60.59% variation in water T2LM globally.
the Chiarotti et al. value of 3.6 s and the theoretical relaxation of water = 3.4 s from Debye’s relaxation m odel22.
The high R 2 value of 0.9746 in the experimental data shows good fit of the power law equation used to describe
T2LM with an increase in O2 pressure across the pressure steps of our study.
Utilizing this empirical relation, the partial pressures of oxygen in the location of this study (Golden, CO with
a pO2 of 2.50 psi) corresponds to a T2LM value of 1973 ms for bulk H2O, whereas in Houston, TX (pO2 = 3.08 psi)
the expected T2LM value would be 1732 ms. Discrepancies between these predicted values with our experimental
values result from the choice of a power-law empirical model, as models with additional parameters could bet-
ter fit data collected at O2 pressures below1 atm used. Based on the power law model and assuming isothermal
conditions, values of T2LM can be estimated globally from elevation data (Fig. 5). The estimated geospatially
dependent T2LM varies between 1728 ms at sea level to 2775 ms on top of the Himalayan Mountains. The partial
pressure differences in oxygen in the atmosphere can cause changes in T2LM relaxation times of up to 60.59%
depending on global geographic location.
Demonstration of these changes in relaxation time due to changes in oxygen concentration is also observed
in porous samples where surface relaxation is commonly attributed as the main mechanism of NMR relaxa-
tion. Reduction in the partial pressure of oxygen by 2.48 psi yields a 53 ms increase in the relaxation time for
large pores and a 19 ms increase in the small pores of a Berea sample going from the ambient state to vacuum
state. This yields an increase in relaxation time of 19.93% in the larger pores and 36.02% for the smaller pores
Scientific Reports | (2021) 11:290 | https://doi.org/10.1038/s41598-020-79441-5 5
Vol.:(0123456789)www.nature.com/scientificreports/
Pressure
relief valve
1 MPa 200 cc 390 cc Pressure
vessel
Gas
bottle
Syringe VAC
pump
Figure 6. Laboratory schematic of the NMR pressure setup for pressurization of DI water samples used in this
study. Gas was pressurized by charging an ISCO syringe pump from the gas cylinder and applying pressure to
the pressure vessel. Valves mark shutoff values to control gas flow to the system. The NMR pressure vessel was
placed into a low-field (2 MHz) Magritek NMR. A fluid trap was utilized to prevent fluid from entering the
vacuum pump. The vacuum pump was used to evacuate atmospheric air from the system prior to pressurization
with oxygen.
respectively. Similarly, pressurization of oxygen from the vacuum state ( pO2 = 0.02 psi) to 10 psig ( pO2 = 21.90
psi) results in a reduction of T2LM in the larger pores of 113 ms and a reduction of 24 ms in the smaller pores.
This yields a reduction in relaxation times of 35.69% and 33.36% in the larger and smaller pores, respectively.
Similarly, the 11.3% reduction in the detectable pore fluid signal further indicates that relaxation enhancements
of the interstitial fluid result in proton relaxation times of faster environments (such as in surface dominated
relaxation of small pore fractions) that are undetectable at our instrument resolution. Thus, we find that variations
in pore relaxation time of sandstones up to 36% can occur with changes in O2 partial pressure of less than 3 psi.
Conclusions
This work provides a quantitative relationship between NMR relaxation of water with O 2 concentration in solu-
tion at different pressure steps, and demonstrates that T2LM can be well predicted by a power law equation. The
theoretical T2LM of bulk water without the presence of oxygen is approximately 3500 ms, which is in good agree-
ment with values found in the literature. Variations of up to 61% in T2LM of bulk water can occur depending on
global location, and variations in pore relaxation of up to 36% in simple porous media can occur with changes
in O2 partial pressure of less than 3 psi. This work demonstrates how trace impurities of paramagnetic gases in
solutions cause great changes in the NMR relaxation at low magnetic fields. The impurity-altered relaxation time
of pure fluids that are controlled by bulk relaxation mechanisms approach and mask surface dominated relaxa-
tion effects in porous media. We suggest that models of pressure and temperature dependent NMR response of
porous media correct for oxygen content that may skew the NMR spectra due to enhanced relaxation caused by
the paramagnetism of the gas. Similarly, variation of oxygen in solution with temperature, salinity, or other gases
could result in appreciable differences in the NMR response that should be accounted for with our empirical
relationship for more accurate predictions of pore properties with low-field NMR relaxometry.
Experimental methods
Experimental setup. NMR Transverse ( T2) relaxation times of DI water with dissolved research grade O2
was measured as a function of O2 pressure up to 1000 psi (about 6.9 MPa) and modeled oxygen solubility for
each pressure step. NMR T2 relaxation was also collected in water saturated Berea sandstone cores as a function
of oxygen pressure in an experimental setup consisting of a gas cylinder connected to a syringe pump, supplying
gas to a pressure vessel placed in a low-field NMR (Fig. 6). The pressure vessel consisted of a machined, 2 in.
outside diameter Torlon rod with a 1-in. inner diameter. The pressure vessel was sealed with a Swagelok cap with
2 fluid flow through lines: the pressure line, and a vent line opened to atmosphere. The entire pressure vessel
was placed in the NMR probe. A gas cylinder was connected to the inlet of a syringe pump (ISCO Teledyne) to
supply gas to the system and the syringe pump was used for pressurization of the supplied gas. A vacuum pump
and fluid trap was connected to the setup via a vacuum line to evacuate the pressure vessel and pressure lines
prior to introduction of gas.
Sample preparation. DI water (Type 2 ACS Grade) was prepared from filtered tap water. Conductivity of
the DI water (6.3 × 10⁻⁵ S/m) was determined from DC conductivity probe measurements and the total dissolved
solids (TDS) content of the DI water was 28 parts per billion. The DI water was allowed to settle in a sealed con-
tainer without agitation to allow maximum degassing (at laboratory pressure prior to the experiment). A known
volume of this so-called settled DI water was decanted into the pressure vessel with minimal agitation to mini-
mize any oxygenation from the atmosphere. A volume of 25.0 mL (containing approximately 2.8 g of hydrogen)
ensured high signal-to-noise (SNR) measurements.
Scientific Reports | (2021) 11:290 | https://doi.org/10.1038/s41598-020-79441-5 6
Vol:.(1234567890)www.nature.com/scientificreports/
Pressurization and depressurization. An ambient absolute pressure of 11.90 psia was derived for
atmospheric pressure in Golden, Colorado at an elevation of 5675 ft (1730 m). In determination of O2 partial
pressure from the atmosphere, air and oxygen gases are treated as ideal gas mixtures. Assuming a concentration
of O2 in air as 21%32, a partial pressure of O
2 (pO2) = 2.50 psi was used for calculation of oxygen pressure at ambi-
ent state. Atmospheric pressure (11.90 psia) was added to gauge pressure values for calculation of applied oxygen
pressure at each pressure step. An additional study used a more efficient vacuum pump connected to the system
to achieve pressures of − 24 in. Hg vacuum pressure. The value from this separate study is included here for
reference to this work. Oxygen partial pressures were determined to be 0.64 psi and 0.02 psi at vacuum steps of
− 18.0 in. Hg and − 24 in. Hg (where 1 psi = 2.03602 in. Hg), respectively. Henceforth in this paper, references to
pressure are provided in absolute oxygen partial pressure (psia) unless otherwise noted as gauge pressures (psig).
Research grade, 99.99% pure, O 2 (Airgas) was introduced into the pressure vessel containing the degassed
water sample. O 2 pressure was increased using the syringe pump in 100 psi increments up to 1000 psig. Depres-
surization steps were also controlled by the syringe pump, and the spent gas was vented to atmosphere. Pressure
was decreased from 1000 to 100 psig in steps of 300 psi to document the changes in T2LM values between 100
and 1000 psig. Below 100 psig, pressure was decreased in smaller pressure steps of 20 psi for higher resolution
of T2LM changes from 0 to 100 psig. Finally, a vacuum of − 18 in. Hg ( pO2 = 3.06 psia following pressurization
in a pure oxygen environment) was applied to the system. Pressure values were taken by agreement with the
syringe pump and pressure gauge. Pressure was maintained with the syringe pump until the NMR readings sta-
bilized. Gentle rocking of the pressure vessel facilitated gas entering (pressurizing) or leaving (depressurizing)
the solution. Continuous fluid phases have no change in T2 spectra following formation of discrete bubbles of
differing fluid composition33. Similarly, Scardina and Edwards show negligible nucleation of bubbles in water
without temperature or pH changes at pressures higher than 1 atm.34, allowing us to ignore the effects of bubble
formation in our NMR results.
NMR experiments. NMR measurements were performed with a low-field (2 MHz) NMR (Magritek Rock
Core Analyzer (RCA)) with a 2-in. probe aperture. T 2 relaxation was acquired using Carr-Purcell-Meiboom-Gill
(CPMG) pulse s equences35,36. The data were inverted using Laplace non-negative least square (NNLS) fi tting28,37
for 200 logarithmically spaced time steps across the bulk relaxation time range (0.01–10,000 ms). Prospa Pro-
gramming by Magritek was utilized for inversions.
The T2 signals were collected with a minimum SNR of 100. Sufficiently long inter-experimental delay times
(1000–20,000 ms), number of echoes (2500–100,000), at an echo spacing (TE) of 100 µs were collected until full
decay of the magnetic signals was observed in the NMR CPMG measurements. A background reading of the
empty pressure vessel was collected at a SNR of 200 for increased measurement resolution of the background
signal. This background was subtracted from each fluid measurement to ensure inverted magnetic decay trains
were solely the result of the fluid response. Measurements were collected on the as-introduced sample of DI
water. A vacuum of − 18.0 in. Hg was applied to the entire system by opening all valves and closing the vent
valve of the pressure vessel (Fig. 6). Gently rocking the pressure vessel at discrete intervals helped remove gas
from the fluid during the degassing process. NMR measurements were made at discrete time intervals between
pressure steps until the relaxation time did not change—typically after a wait time of 36 h. The solution was
deemed fully degassed when successive NMR measurements showed no change in the relaxation time of the
sample based on T 2 relaxation distribution shape and the logarithmic mean of the NMR transverse relaxation
data (T2LM) value, given by:
i a
i ln (T2i )
T2LM = exp (4)
i ai
where, T2LM = NMR logarithmic mean of the spectra [ms], a i = amplitude of spectra at inversion step i, and
T2i = Transverse NMR relaxation time at inversion step i [ms].
Solubility modeling. We quantified the amount of O
2 and other gases commonly dissolved in DI water
in solution at each pressure step, by modeling their solubility in water at the laboratory temperature of 70 °F
(21.1 °C) with Multiflash advanced thermodynamic modeling software that uses Cubic-Plus-Association (CPA)
equation of state calculations (Fig. 4). Oxygen solubility shows a linear increase from 43.25 mg O2/L H2O at 1
atmosphere of pure oxygen pressure to 2723.29 mg O2/L H2O at 1000 psi, neglecting compressibility effects. At
ambient atmospheric air pressure (14.7 psi), the equilibrium concentration of oxygen in water due to partial
pressure is approximately 9.2 mg O2/L H2O (pO2 = 3.08 psia).
The amount of O 2 dissolved in water can vary with changes in atmospheric composition and pressure, and by
solubility modification due to temperature, salinity, and salt type38,39. We use changes in these conditions to vary
dissolved O2 in water (aqueous solutions) and measure the corresponding changes in NMR fluid relaxation time.
Pressurization of a Berea sandstone core with O2. We evaluated effect of dissolved oxygen on T2LM
in porous media using a Berea sandstone core (length = 2 in., diameter ≈ 0.75 in.). The core was fully saturated in
a vacuum chamber with DI water prior to the experiment and put in the NMR pressure vessel. A minimal head
space of a few mm of DI water was added to the top of the core to prevent gas drying when pressurized. NMR
measurements were made at ambient pressure (11.9 psi, pO2 = 2.50 psia), at a vacuum of − 24 in. Hg (pO2 = 0.02
psia), and at an oxygen gauge pressure of 10 psig (pO2 = 21.90 psia). Due to the multi-exponential decay of the
NMR magnetization and the difference in relaxation times of the bulk fluid and pore fluid, pore fluid relaxation
Scientific Reports | (2021) 11:290 | https://doi.org/10.1038/s41598-020-79441-5 7
Vol.:(0123456789)www.nature.com/scientificreports/
was distinguishable from relaxation of the free fluid head, and was used to evaluate pore fluid changes due to
pO2 effects.
Received: 6 October 2020; Accepted: 3 December 2020
References
1. Seevers, D. O. A nuclear magnetic method for determining the permeability of sandstones. Presented at the SPWLA 7th Annual
Logging Symposium, Tulsa, OK, 9–11 May 1966.
2. Timur, A. Effective porosity and permeability of sandstones investigated through nuclear magnetic principles. Log Anal. 10(1), 3
(1969).
3. Coates, G. R., Xiao, L. & Prammer, M. G. NMR Logging Principles and Applications (Halliburton Energy Services, Houston, 1999).
4. Korringa, J., Seevers, D. O. & Torrey, H. C. Theory of spin pumping and relaxation in systems with a low concentration of electron
spin resonance centers. Phys. Rev. 127(4), 1143–1150 (1962).
5. Kleinberg, R. L., Kenyon, W. E. & Mitra, P. P. Mechanism of NMR relaxation of fluids in rock. J. Magn. Reson. Ser. A 108(2), 206–214
(1994).
6. Watson, A. T. & Chang, C. T. P. Characterizing porous media with NMR methods. Prog. Nucl. Magn. Reson. Spectrosc. 31(4),
343–386 (1997).
7. Godefroy, S., Fleury, M., Deflandre, F. & Korb, J. P. Temperature effect on NMR surface relaxation in rocks for well logging applica-
tions. J. Phys. Chem. B 106(43), 11183–11190 (2002).
8. Glasel, J. A. & Lee, K. H. On the interpretation of water nuclear magnetic resonance relaxation times in heterogeneous systems. J.
Am. Chem. Soc. 96(4), 970–978 (1974).
9. Foley, I., Farooqui, S. A. & Kleinberg, R. L. Effect of paramagnetic ions on NMR relaxation of fluids at solid surfaces. J. Magn.
Reson. Ser. A 123(1), 95–104 (1996).
10. Mitchell, J., Stark, S. C. & Strange, J. H. Probing surface interactions by combining NMR cryoporometry and NMR relaxometry.
J. Phys. D Appl. Phys. 38(12), 1950–1958 (2005).
11. Keating, K. & Knight, R. A laboratory study to determine the effect of iron oxides on proton NMR measurements. Geophysics
72(1), E27–E32 (2007).
12. Saidian, M. & Prasad, M. Effect of mineralogy on porosity, pore size distribution and surface relaxivity on nuclear magnetic
resonance characterizations: A case study of Middle Bakken and Three Forks Formations. J. Fuel 161, 197–206 (2015).
13. Benedekt, G. B. & Purcell, E. M. Nuclear magnetic resonance in liquids under high pressure. J. Chem. Phys. 22(12), 2003–2012
(1954).
14. Nestle, N., Baumann, T. & Niessner, R. Oxygen determination in oxygen-supersaturated drinking waters by NMR relaxometry.
Water Res. 37(14), 3361–3366 (2003).
15. Shikhov, I. & Arns, C. H. Temperature-dependent oxygen effect on NMR D-T2 relaxation-diffusion correlation of n-alkanes. Appl.
Magn. Reson. 47(12), 1391–1408 (2016).
16. Horvath, I. T. & Millar, J. M. NMR under high gas pressure. Chem. Rev. 91(7), 13339–21351 (1991).
17. Kamatari, Y. O., Kitahara, R., Yamada, H., Yokoyama, S. & Akasaka, K. High-pressure NMR spectroscopy for characterizing folding
intermediates and denatured states of proteins. Methods 34(1), 133–143 (2004).
18. Bezonova, I., Forman-Kay, J. & Prosser, R. S. Molecular oxygen as a paramagnetic NMR probe of protein solvent exposure and
topology. Concepts Magn. Reson. Part A 32(4), 239–253 (2008).
19. Prosser, R. S. & Evanics, F. Paramagnetic effects of dioxygen in solution NMR—studies of membrane immersion depth, protein
topology, and protein interactions. In Modern Magnetic Resonance (ed. Webb, G. A.) 475–483 (Springer, Dordrecht, 2008).
20. Erriah, B. & Elliot, S. J. Experimental evidence for the role of paramagnetic oxygen concentration on the decay of long-lived nuclear
spin order. R. Soc. Chem. Adv. 9, 23418–23424 (2019).
21. Debye, P. Polar Molecules (New York, 1945).
22. Chiarotti, G., Cristiani, G. & Giulotto, L. Proton relaxation in pure liquids and in liquids containing paramagnetic gases in solution.
Il Nuovo Cimento 1(5), 863–873 (1955).
23. Mirhej, M. E. Proton spin relaxation by paramagnetic molecular oxygen. Can. J. Chem. 43(5), 1130–1138 (1964).
24. Parker, D. S. & Harmon, J. F. Dipolar spin-lattice relaxation in water containing oxygen. Chem. Phys. Lett. 25(4), 505–506 (1974).
25. Morriss, C. E. et al. Hydrocarbon saturation and viscosity estimation from NMR logging in the Belridge Diatomite. Log Analyst
38(2), 44–72 (1997).
26. Lo, S. W., Hirasaki, G. J., House, W. V. & Kobayashi, R. Mixing rules and correlations of NMR relaxation time with viscosity, dif-
fusivity, and gas/oil ratios of methane/hydrocarbon mixtures. SPE J. 7(1), 24–34 (2002).
27. Mutina, A. R. & Hurlimann, M. D. Effect of oxygen on the NMR relaxation properties of crude oils. Appl. Magn. Reson. 29, 503–516
(2005).
28. Lawson, C. L. & Hanson, R. J. Solving Least Square Problems (Prentice-Hall, Englewood Cliffs, 1974).
29. Hirasaki, G. J., Lo, S. & Zhang, Y. NMR properties of petroleum reservoir fluids. Magn. Reson. Imaging 21(3–4), 269–277 (2003).
30. Ferrell, F. T. & Himmelblau, D. M. Diffusion coefficients of nitrogen and oxygen in water. J. Chem. Eng. Data 12(1), 111–115 (1967).
31. Niesar, U., Corongiu, G., Clementi, E. & Bhattacharya, D. K. Molecular dynamics simulations of liquid water using the NCC
ab initio potential. J. Phys. Chem. 94(20), 7949–7956 (1991).
32. Martin, D., McKenna, H. & Livina, V. The human physiological impact of global deoxygenation. J. Physiol Sci. 67(1), 97–106 (2017).
33. Majid, A., Saidian, M., Prasad, M. & Koh, C. A. Measurement of water droplets in water-in-oil emulsions using low field nuclear
magnetic resonance for gas hydrate slurry application. Can. J. Chem. 93(9), 1007–1013 (2015).
34. Scardina, P. & Edwards, M. Prediction and measurement of bubble formation in water treatment. J. Environ. Eng. 17(11), 968–973
(2001).
35. Carr, H. & Purcell, E. Effects of diffusion on free precession in nuclear magnetic resonance experiments. Phys. Rev. 94(3), 630–638
(1954).
36. Meiboom, S. & Gill, D. Modified spin echo method for measuring nuclear relaxation times. Rev. Sci. Instrum. 29(8), 668–691
(1958).
37. Buttler, J. P., Reeds, J. A. & Dawson, S. V. Estimating solution of first kind integral equations with non-negative constraints and
optimal smoothing. Siam J. Numer. Anal. 18(3), 381–397 (1981).
38. Benson, B. B. & Krause, D. The concentration and isotopic fractionation of oxygen dissolved in freshwater and seawater in equi-
librium with the atmosphere. Am. Soc. Limnol. Oceanogr. 29(3), 620–632 (1984).
39. Geng, M. & Duan, Z. Prediction of oxygen solubility in pure water and brines up to high temperatures and pressures. Geochim.
Cosmochim. Acta 74(2010), 5631–5640 (2010).
Scientific Reports | (2021) 11:290 | https://doi.org/10.1038/s41598-020-79441-5 8
Vol:.(1234567890)www.nature.com/scientificreports/
Acknowledgements
This work is funded by the OCLASSH and DHI/Fluids Consortia at the Colorado School of Mines. We thank
Carolyn Koh and Ahmad Majid from the Center for Hydrate Research for providing Multiflash advanced ther-
modynamic model generated gas solubility curves. T.R.G.’s contribution was supported by IDREAM (Interfacial
Dynamics in Radioactive Environments and Materials), an Energy Frontier Research Center funded by the U.S.
Department of Energy (DOE), Office of Science, Basic Energy Sciences (BES). This paper has benefitted greatly
from input and comments from Jyoti Behura, Justin Birdwell, Katerina Yared, Ridvan Akkurt, and Mathias Pohl.
Author contributions
K.L. contribution includes conceptualization, methodology, investigation, writing-original draft, writing-review
and editing, data curation, validation. M.P. contribution includes conceptualization, writing-review and editing,
validation, resources, supervision, project administration, funding acquisition. T.R.G. contribution includes data
interpretation, writing, editing, and drafting the figures.
Competing interests
The authors declare no competing interests.
Additional information
Supplementary Information The online version contains supplementary material available at https://doi.
org/10.1038/s41598-020-79441-5.
Correspondence and requests for materials should be addressed to K.L.
Reprints and permissions information is available at www.nature.com/reprints.
Publisher’s note Springer Nature remains neutral with regard to jurisdictional claims in published maps and
institutional affiliations.
Open Access This article is licensed under a Creative Commons Attribution 4.0 International
License, which permits use, sharing, adaptation, distribution and reproduction in any medium or
format, as long as you give appropriate credit to the original author(s) and the source, provide a link to the
Creative Commons licence, and indicate if changes were made. The images or other third party material in this
article are included in the article’s Creative Commons licence, unless indicated otherwise in a credit line to the
material. If material is not included in the article’s Creative Commons licence and your intended use is not
permitted by statutory regulation or exceeds the permitted use, you will need to obtain permission directly from
the copyright holder. To view a copy of this licence, visit http://creativecommons.org/licenses/by/4.0/.
© The Author(s) 2021
Scientific Reports | (2021) 11:290 | https://doi.org/10.1038/s41598-020-79441-5 9
Vol.:(0123456789)You can also read