THE EVALUATION OF DYNAMIC COMPACTION ANALYSIS AS A QBD TOOL FOR PAEDIATRIC ORODISPERSIBLE MINITABLET FORMULATION
←
→
Page content transcription
If your browser does not render page correctly, please read the page content below
FARMACIA, 2020, Vol. 68, 6
https://doi.org/10.31925/farmacia.2020.6.6                                                          ORIGINAL ARTICLE

THE EVALUATION OF DYNAMIC COMPACTION ANALYSIS AS A
QBD TOOL FOR PAEDIATRIC ORODISPERSIBLE MINITABLET
FORMULATION

SONIA IURIAN *, LARISA ILIE, MARCELA ACHIM, IOAN TOMUȚĂ

Department of Pharmaceutical Technology and Biopharmacy, Faculty of Pharmacy, “Iuliu Hațieganu” University of
Medicine and Pharmacy, 41 Victor Babeș Street, Cluj-Napoca, 400012, Romania

*corresponding author: sonia.iurian@umfcluj.com
                                                                                                   Manuscript received: May 2020

Abstract
The formulation of orodispersible minitablets (ODMTs) usually targets the disintegration time and mechanical strength, but
should also consider a series of technological issues related to powder flow and compression behaviour. In this regard, the
present study aimed to evaluate the contribution of dynamic compaction analysis as Quality by Design (QbD) tool in
ODMTs’ formulation. Placebo tablets were prepared by direct compression following a design of experiments (DoE). Each
powder blend was subjected to dynamic compaction analysis; the work of compression, the elastic recovery, the detachment
stress, the ejection stress as well as the disintegration time and crushing strength were determined. The effects of input
variables on the responses were quantified as regression models and two sets of constraints were applied for Design Space
(DS) development: one regarding tablet characteristics and the second one including compression performance parameters.
The DS was validated and the robust point and negative control were used to prepare ODMTs. Their characteristics
confirmed the benefits of including the compression parameters into the early formulation stages of ODMTs.

Rezumat
Formularea minicomprimatelor orodispersabile (ODMT) vizează de obicei optimizarea timpului de dezagregare și a rezistenței
mecanice, dar ar trebui să ia în considerare și o serie de probleme tehnologice legate de curgerea amestecului de pulbere și de
performanță a comprimării. În această privință, studiul de față a urmărit să evalueze contribuția analizei dinamice a
comprimării ca instrument al conceptului de Calitate prin Design (QbD) în formularea ODMT. S-au preparat comprimate
placebo prin comprimare directă după un plan experimental (DoE). Fiecare amestec de pulbere a fost supus unei analize
dinamice de compactare; s-au determinat lucrul mecanic al comprimării, revenirea elastică, tensiunea de detașare, tensiunea
de ejecție, precum și timpul de dezagregare și rezistența mecanică. Efectele variabilelor de intrare asupra răspunsurilor au fost
cuantificate ca modele de regresie și s-au aplicat două seturi de constrângeri pentru dezvoltarea Domeniului Optim (DS):
unul cu privire la caracteristicile tabletei, iar al doilea adăugând parametrii de performanță ai comprimării. DS a fost validat,
iar punctul robust și controlul negativ au fost utilizate pentru prepararea ODMT. Caracteristicile lor au confirmat avantajele
includerii parametrilor de performanță a comprimării în etapele de formulare a ODMT.

Keywords: Quality by Design, DoE, formulation development, tableting performance

Introduction                                                         between 7% and 51.7% and could be associated with
                                                                     an increased risk of adverse drug reactions [16]. On
Paediatric therapy has drawn the attention of regulatory
                                                                     the other hand, the pharmaceutical industry has been
authorities in the drug domain because of the frequency
                                                                     reluctant to perform clinical trials in children due to the
of off-label and unauthorized medicines use in
                                                                     ethical issues, the decreased commercial interest and
paediatric population. Drug prescribing in children
                                                                     the supplementary costs. As a response, the regulatory
is often based on extrapolation of results from data
                                                                     environment reformed the legislation to stimulate
obtained in clinical trials performed on adults, because
                                                                     the research of child-appropriate medicines through
of the missing relevant data on children. Paediatric
                                                                     the paediatric research equity act issued in USA in
population is often deprived of adequate dosage forms
                                                                     2002 and EMA guidelines for paediatric medicines
and as a consequence, parents or caregivers refer to
                                                                     adopted in 2006 [6]. EMA defines age-appropriate
modifications to licensed drugs such as dispensing the
                                                                     medication as products whose pharmaceutical design
drug in a different form, prepare drugs extemporaneously,
                                                                     makes them suitable for use in the target age groups,
crush tablets to prepare a suspension etc. Inpatient
                                                                     with respect to composition, dosage form, dosing
studies reported that off-label and unlicensed drug
                                                                     frequency and packaging [21]. Their most important
prescriptions in children ranged from 36.3% to 97%,
                                                                     features are the efficacy and ease of use, the safety
while in outpatient studies the proportion was lower,
                                                                     and accessibility for the patient [23].
                                                              999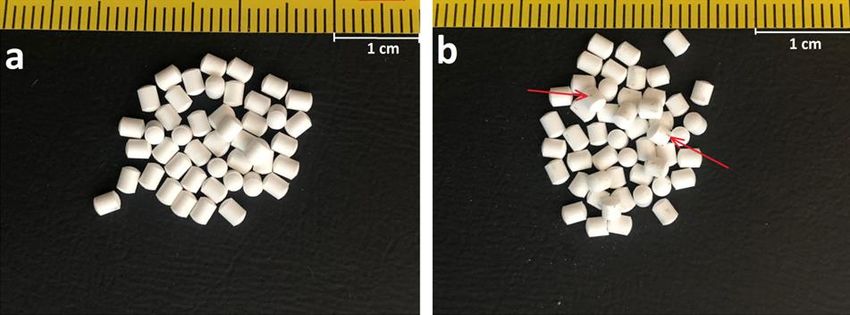
FARMACIA, 2020, Vol. 68, 6
The decision-making regarding the choice of the                         stages of formulation development. It started with the
appropriate dosage form is difficult because of age-                    elaboration of the QTPP, the identification of the critical
related physiological differences and preferences [21].                 quality attributes (CQAs) of the product and their
A key consideration when children are involved is                       relations with the formulation factors and process
the acceptance of the medication, when factors like                     parameters through an Ishikawa diagram. The preparation
palatability and swallowability have to be well thought-                of placebo orodispersible tablets was guided by a
out [2]. In this respect, the research media points out                 DoE from which the effects of the input variables on
that a risk- based approach aligned with the principles                 the CQAs of the product but also of the compression
of Quality by Design (QbD) is essential at the development              process were quantified. The validation of the experimental
of a new product [25].                                                  plan was achieved by generating a Design Space (DS)
Oral liquid dosage forms used to be the gold standard                   to ensure the quality of the tablets, but also the smooth
for drug administration in children, in spite of the risk               running of the compression. Finally, ODMTs were
of inaccurate dosing, low stability, the large number                   prepared in order to test the resulting hypotheses.
of excipients and difficult transportation. Therefore,
recent research works stated that solid oral dosage                     Materials and Methods
forms as multiparticulates, minitablets and orodispersible
                                                                        Materials
forms are more appropriate options, with flexible dosing
                                                                        Ludiflash was kindly donated by BASF (Germany),
and high stability [6]. Orodispersible minitablets were
                                                                        magnesium stearate was purchased from Merk (Germany)
first reported by Stoltenberg and Breitkreutz (2011)
                                                                        and sodium stearylfumarate was obtained from JRS
as 2 - 3 mm diameter tablets that disintegrate in the
                                                                        PHARMA (Germany).
oral cavity in a few seconds [24]. The risks associated
                                                                        Risk management procedure
to their administration like choking or aspiration are
                                                                        In the need to gain a more systematic understanding of
low and their acceptability and swallowability were
                                                                        pharmaceutical products and processes, the International
confirmed in paediatric patients below 6 years of
                                                                        Conference for Harmonization document Q8 defined
age [1].
                                                                        the QTPP as the first element of pharmaceutical
However, a series of technological issues with impact
                                                                        development. It contains features of the pharmaceutical
on the balance between stability, mechanical properties
                                                                        product related to its quality, safety and efficacy [9].
and disintegration should be considered at the development
                                                                        The QTPP led to the choice of CQAs which were
of orodispersible minitablets, as well as the processability
                                                                        further investigated for their dependence on Critical
of the selected excipients and the compression
                                                                        Process Parameters and Critical Material Characteristics
performance.
                                                                        through Ishikawa diagrams.
The QbD approach in drug development is always in
                                                                        DoE
the search of new methods for a better characterization
                                                                        A design of experiments was developed for a better
and understanding of products and processes. It relies
                                                                        understanding of the effects of lubricants and of the
on a series of tools such as risk assessment strategies,
                                                                        compression force on the powders’ and tablets’
design of experiments (DoE), NIR spectroscopy and
                                                                        characteristics. Two lubricants were included into the
Raman spectroscopy that grant the thorough knowledge
                                                                        study: sodium stearylfumarate (NaSf) and magnesium
of products and processes [22]. Dynamic compaction
                                                                        stearate (MgSt), as a qualitative input variable (X1).
analysis offers details on the compressibility, compactibility
                                                                        Their ratios were evaluated in the domain 1% - 4%,
and tabletability of a powder, and enables the calculation
                                                                        as a quantitative factor (X2). The compression load, a
of parameters related to the compression process
                                                                        process parameter with a high impact on the QTPP,
performance, such as the detachment and ejection
                                                                        was selected as a quantitative variable and ranged
stress. Pitt et al. demonstrated its ability to predict
                                                                        from 200 kg and 400 kg on three levels. A D-Optimal
tablet failure on rotary presses by measuring the ejection
                                                                        optimization design was generated (Modde 12.1, Sartorius,
shear stress on small amounts of powder blends [20].
                                                                        Sweden) with 19 runs, comprised of 15 individual
The development of a product in the QbD concept
                                                                        experiments and 4 replicated centre points, as shown
begins with establishing the Quality Target Product
                                                                        in the experimental design matrix, Table I. As response,
Profile (QTPP) and the more detailed and precise the
                                                                        a CQA corresponding to the powder blend was selected:
quality profile, the lower the risks of failure. The
                                                                        the compressibility index (Y1). Four parameters that
QTPP usually includes essential characteristics of the
                                                                        resulted from the compaction analysis were included
finished pharmaceutical product [11]. However, the
                                                                        as responses in the experimental design: the work of
inclusion of relevant performance parameters of the
                                                                        compression (J) (Y2), the elastic recovery (%) (Y3),
preparation process could be useful in preventing
                                                                        the detachment stress (MPa) (Y4) and the ejection
manufacturing errors and material loss. This study
                                                                        stress (MPa) (Y5). The disintegration time (s) of the
aims at applying a risk reduction strategy for the
                                                                        tablets and their hardness (N) were set as responses
optimization not only of tablet characteristics, but
                                                                        Y6 and Y7. The same software was used for statistical
also of process performance parameters derived from
                                                                        calculations and data fitting. The influences of independent
the dynamic compaction analysis, from the early
                                                                 1000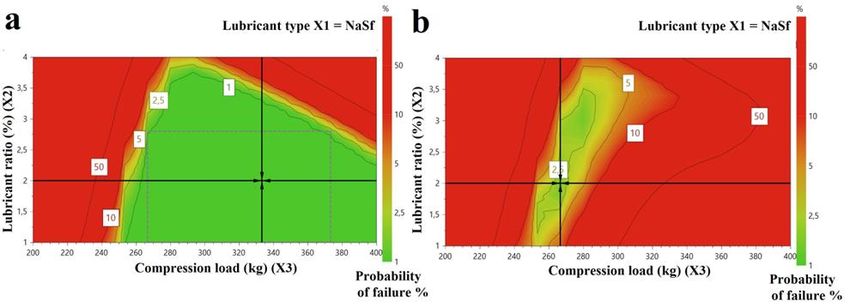
FARMACIA, 2020, Vol. 68, 6
variables on the responses were assessed using Multiple           Flow properties of powders
Linear Regression (MLR) method. Further, the same                 Powder flow was assessed according to the European
software was used to generate Design Spaces applying              Pharmacopoeia (Eur. Ph.) 10.0, 2.9.36 [7]. The bulk
to different sets of constraints. A Design Space (DS)             density and the tapped density were determined for
is described by a complex mathematical function and               the further calculation of the compressibility Index
represents an area from the experimental domain                   (Carr’s Index) (Y1).
where the input variables interact in such a way that             Tablet preparation
the responses fit into the desired quality profile. Its           Tablet preparation was performed using Gamlen tablet
calculation relies on the regression model equations              press (GTP, series D, Gamlen Tableting Ltd. Biocity
and the estimation of the probability of failure (%),             Nottingam, UK). 100 mg of each powder mixture
meaning the probability of making predictions outside             listed in Table I were compressed using a flat punch
the specifications [11]. DoE validation requires the              with a diameter of 6 mm, descending at a speed of
testing of formulations from both inside and outside              60 mm/min. Six samples of each formulation were
of the DS and the assessment of the experimental                  compressed at three different loads: 200, 300 and
values compared to the predicted ones.                            400 kg.
Powder blend preparation                                          ODMT preparation was performed using an eccentric
100 g of each of the powder mixtures were prepared                tablet press (Korsch EK0, Germany) equipped with a
using the corresponding quantities of Ludiflash®                  2 mm diameter set of punches adjusted at an average
and lubricant, blended in a Y-shaped mixing vessel                weight of 10 mg/ODMT using the powder blends and
(Erweka Y5, Germany) with a capacity of 5 L, at                   process parameters revealed by the optimization
30 rpm for 10 minutes.                                            process.
                                                                                                               Table I
                                                                                           Experimental design matrix
  Experiment name       Run order    Lubricant type (X1)     Lubricant ratio (%) (X2)    Compression load (kg) (X3)
        N1                 12              MgSt                         1                          200
        N2                 5               MgSt                         1                          400
        N3                 17               NaSf                        1                          200
        N4                 2                NaSf                        1                          400
        N5                 9                NaSf                        1                          300
        N6                 18              MgSt                         2                          300
        N7                 15               NaSf                        2                          200
        N8                 14               NaSf                        2                          400
        N9                 6               MgSt                         4                          200
        N10                10              MgSt                         4                          400
        N11                16              MgSt                         4                          300
        N12                11               NaSf                        4                          200
        N13                13               NaSf                        4                          400
        N14                7               MgSt                         3                          200
        N15                8               MgSt                         3                          400
        N16                1                NaSf                        3                          300
        N17                19               NaSf                        3                          300
        N18                3                NaSf                        3                          300
        N19                4                NaSf                        3                          300

Compaction analysis                                               In the compression phase, the work of compression
Dynamic compaction analysis was performed on                      (Y2) was calculated as the area under the force vs.
benchtop single-punch Gamplen tablet press (GTP,                  displacement curve and was determined using the
series D, Gamlen Tableting Ltd. Biocity Nottingam,                areas of rectangles, as described by Draskovic et al.
UK). 100 mg of each powder mixture were compressed                The elastic recovery (Y3) was evaluated indirectly
using a flat punch with a diameter of 6 mm, descending            from the punch position at maximum load in relation
at a speed of 60 mm/min. Six samples of each formulation          to the punch position at minimum compression load [5].
were compressed at three different loads: 200, 300                In the detachment phase, detachment stress (MPa) (Y4)
and 400 kg.                                                       was calculated as a ratio between the maximum
The analysis comprised three stages: compression,                 detachment force and the compact surface area [5].
detachment and ejection, during which the real time               In the final stage, ejection stress (MPa) (Y5) was
upper punch position and force were recorded. The                 determined as the highest ejection force in the cycle
Gamlen software returned the force vs. displacement               divided by the compact diameter multiplied to the
profile for each of the three stages which was further            in-die thickness and to constant π [5].
used for various parameter calculation.

                                                           1001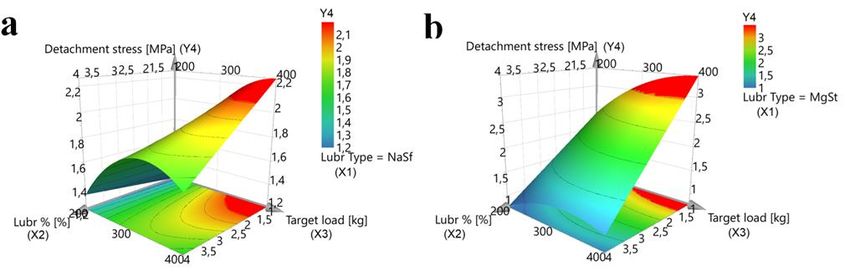
FARMACIA, 2020, Vol. 68, 6
The solid fraction, compaction pressure (MPa) and                   Results and Discussion
tensile strength (MPa) were calculated as described
                                                                    Risk management
by Draskovic in order to plot the compressibility,
                                                                    The development, manufacturing and administration
compactibility and tabletability of the mixtures. The
                                                                    of paediatric solid oral dosage forms are associated to
obtained compacts were evaluated for their thickness
                                                                    certain degrees of risk, starting with the formulation
and diameter using a caliper.
                                                                    selection, process robustness and ending with product
Disintegration test
                                                                    acceptance and safety [3]. In this respect, the research
The disintegration test was performed according to Eur.
                                                                    media points out that a risk-based approach following
Ph. method, in 800 mL distilled water at 37 ± 0.5°C,
                                                                    the principles of QbD is essential at the development
using the compendial disintegration apparatus (Pharmatest,
                                                                    of new products, especially when paediatric patients
Germany). The test was performed in triplicate and
                                                                    are targeted [25]. Risk management strategies start by
the disintegration time values (Y6) were expressed
                                                                    defining the QTPP of the desired product that gathers
as mean ± standard deviation.
                                                                    the quality attributes needed to meet its intended use.
Crushing strength test
                                                                    The QTPP shown in Table II was established by the
Crushing strength (Y7) was measured using the Pharma-
                                                                    authors after a thorough review of the published papers
Test (Germany) hardness tester on three samples of
                                                                    on minitablets and ODMTs.
each formulation. The values were expressed as mean
                                                                    Minitablets or ODMTs were feasible at diameters
± standard deviation.
                                                                    between 1 mm and 3 mm, although Tissen et al. reported
Weight variation
                                                                    processability issues for the 1 mm tablets as tablet
Twenty ODMTs were weighed on an analytical balance
                                                                    bisection by the scraper affecting 25% of the batch
(Kern ABS, Germany), in order to determine the weight
                                                                    [15, 26]. Acceptable mechanical properties of the
variations. The results were expressed as mean ±
                                                                    tablets were reported at crushing strengths above 7 N
standard deviation.
                                                                    or tensile strengths over 2 MPa [15, 24].
                                                                                                                 Table II
                                                                                                  QTPP of placebo ODMTs
      QTPP element                                Target                                     Observations
 Route of administration      Oral
 Dosage form                  Orodispersible minitablet
 Dosage strength              Placebo
 Product quality attributes   Diameter                                    2 - 3 mm
                              Crushing strength                           ≥ 7 N (Stoltenberg et al. 2011)
                              Disintegration time                         ≤ 3 minutes (Eur. Ph.), ≤ 30 s (USP)
                              Assay                                       Placebo product, not applicable
                              Dissolution                                 Placebo product, not applicable
                              Weight uniformity                           Weight variation within the ± 10 % limit (Eur. Ph.)
                              Content uniformity                          Placebo product, not applicable
                              Taste, palatability                         Pleasant taste, high palatability
 Container closure system     Suitable for storage in normal conditions   Ensures product integrity during shelf life
                                                                          Enables easy ejection and administration

The development and manufacturing of ODTs are                       the poor flowing properties, but it could also impact
often challenging tasks because of the need to establish            the disintegration and mechanical characteristics of
a balance between the good disintegration properties                compacts.
in small volumes of liquid and sufficient mechanical                Compaction pressure could influence the compression
resistance to withstand packaging, transport and                    process performance, detachment stresses, ejection
administration. Therefore, most of the research studies             stresses, but also the tablet’s mechanical and disintegration
found crushing strength, disintegration time and the                characteristics.
active pharmaceutical ingredient’s (API) release [4, 12]            The aforementioned sources of variability are the main
as critical quality attributes (CQAs) for these products.           risks at the preparation of ODMTs and one way to
The weight uniformity is also critical for ODMTs                    diminish their effects on the product is to evaluate
as previous studies showed that weight variability                  them through an experimental design.
increases when the tablet diameter decreases.                       DoE
The Ishikawa diagram shown in Figure 1 lists the                    The correlation between formulation and process
process, formulation and analytical method related                  parameters and the powders’ and tablets’ CQAs were
factors that could influence the CQAs. One of the factors           investigated through a DoE. The input variables that
that could ensure consistent die filling and good weight            contributed to the DoE construction were chosen to
uniformity in the case of ODMT preparation is good                  impact both tablets’ characteristics and the process
flowability. Appropriate lubrication can overcome                   performance. Ludiflash was chosen as a representative
                                                             1002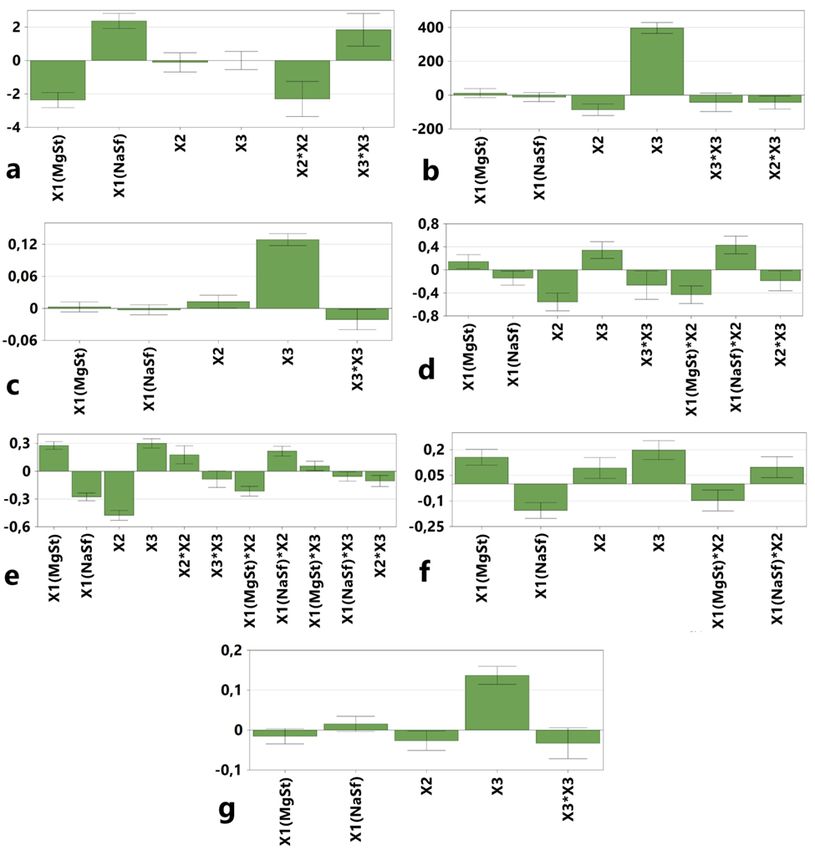
FARMACIA, 2020, Vol. 68, 6
of ODT direct compression co-processed fillers, as                 1% and 4%. Their use was previously mentioned in
most of the ODT co-processed excipients like                       ODMTs’ lubrication, MgSt is the most commonly used
Pharmaburst® 500, Parteck® ODT or Pearlitol® Flash,                lubricant, while NaSf is a fatty acid ester which showed
Ludiflash® contain mannitol as asoluble and pleasant               less interference with the tablet properties (tensile
tasting filler. It also contains polyvinyl acetate as              strength and disintegration) when compared to MgSt
binder and crospovidone as superdisintegrant which                 [27]. The use of MgSt was reported at concentrations
enables fast disintegration [14, 24]. Two lubricants               between 0.25 % and 5 % w/w, and the ratios of NaSf
were tested, magnesium stearate (MgSt) and sodium                  typically range between 0.5% and 2 % w/w [27].
stearylfumarate (NaSf) at levels comprised between

                                                       Figure 1.
                                                   Ishikawa diagram

The powder flow expressed as compressibility index                 But R2 alone is not enough to affirm the validity of a
was evaluated as a response in the experimental design             model, therefore Q2, the goodness of prediction was
because of its dependence on the type and ratio of                 calculated to estimate the predictive power of the
lubricant and also on its impact on the ODMTs’ CQAs.               model. All the obtained values for Q2 were beyond
The tablets were prepared using a fully instrumented               0.5 and the differences between the corresponding R2
compression simulator in order to provide a full                   and Q2 were not higher than 0.2 - 0.3 which shows
description of the compression, detachment and ejection            appropriate models. The model validity was above
stages. The calculated parameters were analysed as                 0.25 for all responses, while the reproducibility was
responses in the DoE, as well as the ODMTs’ mechanical             beyond 0.5 and showed a small replicate error in
and disintegration properties.                                     relation to the variability seen across the design.
Quality of fit of experimental results                             The outcome of the experimental design analysis is
The experimental data were fitted using Multiple Linear            a model comprised of regression coefficients used
Regression (MLR) which leads to models that link                   to interpret the influence of factors. The regression
process performance parameters and ODMTs’ CQAs                     coefficients were represented as scaled and cantered
to the input variables. MLR finds the regression model             and indicate the response’s variation when the factors
which minimizes the residual sum of squares of the                 are raised from their zero levels to their maximum
response variable [8]. The responses and the parameters            levels.
that indicate the quality of the obtained models are               Powder flow
listed in Table III. The R2 parameter represents the               The powder flow was assessed by an indirect method
goodness of fit and reveals how well the regression                that measures the bulk density compared to the tapped
model fits the raw data. It varies between 0 and 1,                density of the powder. The compressibility index (Y1)
where 1 indicates a perfect model and 0 indicates no               was calculated according to the European Pharmacopoeia
model at all [8]. As shown in Table III, the regression            and the results were compared to those listed into the
models obtained for the responses are over 0.9, excepting          scale of flowability [7]. They ranged from 12.7%
the R2 for the disintegration time, which was 0.822.               which shows good flow properties to 21.4% for powders

                                                            1003
FARMACIA, 2020, Vol. 68, 6
with passable flowability. As shown in Figure 2a, the range (the lowest and the highest) led to the best flow
type of lubricant (X1) had the most important effect on properties for both of the lubricants which is in
Y1 with a negative influence from MgSt and a positive accordance to other results that have reported higher
influence from NaSf. The use of MgSt led to the lubrication efficiency for both MgSt and NaSf at ratios
lowest Y1 values from the data set, 12.7%, associated of 1%, with a slightly better performance for MgSt [18].
to the best powder flow, while using NaSf determined Draskovic et al. (2018) reported a compressibility
high Y1 values, from 17.4% to 21.4%. A non-linear index of 21% for Ludiflash alone, associated to particles
correlation was obtained between Y1 and the lubricant with irregular shapes [5].
ratio that shows that the extreme values from the tested
Table III
Response matrix and quality of fit parameters
Compressibility Work of Elastic Detachment Ejection Disintegration Crushing
Experiment
Index compression recovery stress stress time strength
Name
(Y1) (Y2) (Y3) (Y4) (Y5) (Y6) (Y7)
N1 14.2 1145.33 6.07 2.08 1.7 41 27.55
N2 14.2 2162.85 9.98 3.63 2.66 105.5 63.8
N3 17.4 1237.72 5.59 1.24 0.74 13.5 36.4
N4 17.4 1978.73 10.98 2.14 1.52 26.18 68.65
N5 17.4 1597.89 8.36 2.12 1.23 25.57 51.35
N6 13.8 1671.73 9.04 2.78 1.62 77.5 54.8
N7 21.4 1123.83 6.51 1.42 0.7 17.6 36.85
N8 21.4 1974.48 10.94 1.95 1.1 57.1 65.1
N9 12.7 1095.82 6.23 0.8 0.57 34 31.3
N10 12.7 1818.71 11.6 1.32 1.07 134 53.65
N11 12.7 1475.05 8.93 1.05 0.85 233 42.65
N12 18.9 1100.19 6.13 1.34 0.44 36.76 31.05
N13 18.9 1813.76 11.36 1.79 0.79 84.12 58.9
N14 15.6 1134.56 6.11 1.25 0.69 48.7 30.8
N15 15.6 1848.9 11.42 1.42 1.3 78.5 54.2
N16 18.3 1543.92 8.64 1.76 0.74 34.2 48.85
N17 18 1500 8.8 1.6 0.82 28 46
N18 18.8 1563 8.4 1.74 0.76 42 51
N19 17.5 1580 8.2 1.9 0.7 33 42
Statistical parameter
Goodness of fit, R2 0.928 0.983 0.978 0.915 0.988 0.915 0.928
R2 adjusted 0.900 0.976 0.971 0.873 0.979 0.889 0.908
Goodness of 0.839 0.955 0.957 0.741 0.946 0.832 0.861
prediction, Q2
Model validity 0.594 0.635 0.702 0.480 0.597 0.753 0.857
Reproducibility 0.961 0.989 0.984 0.964 0.991 0.926 0.909
Dynamic compression analysis compressed at high target loads reduces the work of
The dynamic compression analysis assessed the three compression.
phases of the compression process and several parameters The elastic recovery (Y3) was first influenced by the
were calculated from the force-displacement curves target load, meaning that increasing the target load
and analysed as responses in the DoE (Y2 – Y5). The led to high values of Y3. A significant effect was
work of compression (Y2) and elastic recovery (Y3) also obtained for the lubricant ratio, showing that high
were calculated out of the profiles generated in the lubricant contents generated higher Y3. However, no
compact consolidation phase. The total work necessary differences were seen between MgSt and NaSf.
for particle rearrangement, deformation, fragmentation The most important effect on the detachment stress
and new bond forming was calculated as the total (Y4) was generated by the lubricant content: higher
work of compression. As expected, the most important ratios of lubricants determined the decrease of the
effect was obtained from the applied target load, whose Y4, but the behaviour of the tested lubricants was not
increase generated a significantly higher work of similar: when using MgSt the Y4 values ranged from
compression. The type of lubricant did not impact Y2, 0.8 to 3.63 MPa, while the use of NaSf led to Y4
but the lubricant ratio increase determined a slight values comprised between 1.24 and 2.14 MPa (Figure
decrease in the response, with a lower magnitude 2d). The interactive effect between X1 and X2 showed
compared to the effect of the target load. A significant that high target loads of compression applied on mixtures
interaction was also found between X2 and X3 which with inferior percentages of MgSt generated important
shows that increasing lubricant ratios in mixtures detachment stresses, but as the MgSt ratio raised, Y4
1004FARMACIA, 2020, Vol. 68, 6
decreased significantly down to values close to 1 MPa lubricant ratio. However, all values were in the accepted
(Figure 3). The variation range of Y4 is narrower when range, below 3 MPa. Detachment stresses can be
NaSf is used, with the lowest values reached for minimized either by applying low target loads, or by
minimum target load of compression or maximum using high percentages of lubricants.
Figure 2.
The influence of input variables on: a, the compressibility index (Y1); b, the work of compression (Y2); c, elastic
recovery (Y3); d, detachment stress (Y4); e, ejection stress (Y5); f, disintegration time (Y6); g, crushing strength
(Y7), where X1 is the type of lubricant, X2 represents the lubricant ratio and X3 is the target load of compression
Figure 3.
Response surfaces of detachment stress (Y4) as a function of the lubricant ratio (X2) and the target load of
compression (X3) for the two lubricants: NaSf (a) and MgSt (b)
1005FARMACIA, 2020, Vol. 68, 6
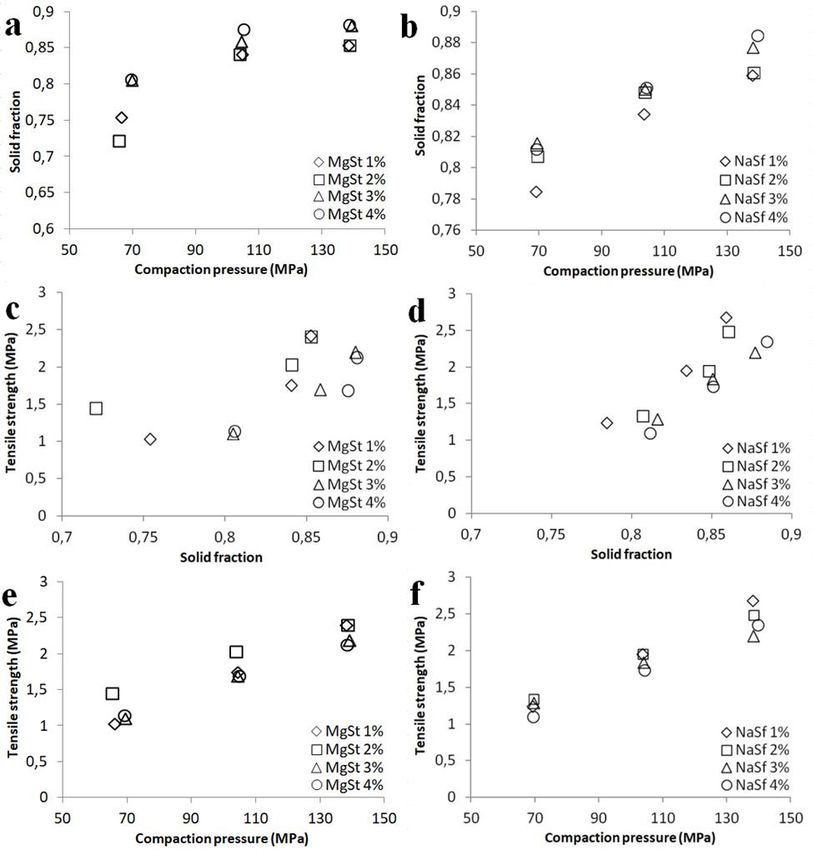
Figure 4.
Compressibility (a, b), compactibility (c, d) and tabletability (e, f) profiles of the evaluated mixtures
The ejection stresses (Y5) ranged between 0.44 and pressure (Figure 4). It is well known that compaction
2.66 MPa and displayed a very similar effect pattern pressure increase associated to high compact density
when compared to the one corresponding to the and low porosity generates wetting and disintegration
detachment stress (Figure 2e). The lubricant ratio exerted difficulties. To acquire fast disintegration, compact
the most important influence on Y5: for both lubricants, with low solid fractions should be obtained, in a range
the ratio increase led to Y5 decrease. The positive of 0.7 - 0.8 [17]. The tested formulations displayed
influence of MgSt is related to the coverage of the solid fractions between 0.72 and 0.89, with the lowest
superior interval of Y5 variation, while NaSf produced value attained for the mixture containing 2% MgSt.
mixtures with low Y5. The target load increase had The 2% MgSt, as well as the 1% NaSf mixtures showed
a higher impact on mixtures with MgSt comparing the highest compressibilities that go along with the
with NaSf. good flow properties indicated by Carr’s Index. Moreover,
Out of the force vs. displacement profiles returned when force vs. displacement profiles were evaluated
by the dynamic compression evaluation, the solid (data not shown), high displacement values were
fraction, compaction pressure (MPa) and tensile strength recorded for intermediate ratios of MgSt and low ratios
(MPa) were calculated, as they best indicate the material of NaSf, which indicates a high volume reduction
compaction properties. Compressibility, compactibility ability for those formulations.
and tabletability profiles were plotted as solid fraction The ability of powders to yield resistant compacts when
vs. compaction pressure, tensile strength vs. solid exposed to a compression pressure is returned as a
fraction and respectively tensile strength vs. compaction compactibility profile (Figures 4c and 4d), and the
1006FARMACIA, 2020, Vol. 68, 6
best compactibility was obtained when low ratios of was of 20 s, with an accepted maximum value of 60 s.
both lubricants were used. Ludiflash also contains As for the crushing strength, it was set for 55 N, with
polyvinyl acetate as a binder, which contributes to a minimum value of 40 N. The obtained DS covered
enhance compactibility and could be responsible of more than half of the experimental domain and the
levelling the lubricant effects [24]. risk to get predictions outside the specifications was
Tensile strength limits are not officially defined by the assessed by the probability of failure (%), which was
pharmacopoeias, however ideally they should exceed below 2.5% in the green area (Figure 5a). The robust
2 MPa for highly robust products, or 1 MPa for products point (RP1) with 0% probability of failure was obtained
that do not undergo important mechanical stresses [20]. at X1 = NaSf, X2 = 2% lubricant ratio and X3 = 333.3
The resulting compacts showed tensile strengths over kg compression load.
2 MPa at solid fractions around 0.85, while values Further, a second optimization was performed, adding
over 1 MPa were obtained at solid fractions between constraints on the responses derived from the dynamic
0.7 and 0.8. Formulations with 2% MgSt and 1% NaSf compaction analysis and powder flow evaluation
had the best tabletability profiles (Figures 4e and (Table IV). Both detachment stresses and ejection
4f). Apparently, high contents of lubricants do not stresses were limited to a maximum of 2 MPa. The
improve tabletability, which is a measure of plastic compressibility index was set at a maximum value of
deformation capacity. 20%. As, a result, the optimum area was significantly
Tablets’ CQAs reduced (Figure 5b) and the robust point (RP2) was
The measured disintegration times (Y6) were between identified at X1 = NaSf, X2 = 2,2% and X3 = 266,6 kg.
13.5 s and 233 s, while the maximum value allowed Both of the generated DSs had NaSf as lubricant, which
by the Eur. Ph. for orodispersible tablets is of 180 s. is in agreement with the findings of Stoltenberg et al.;
Only one formulation containing 4% MgSt out of 19 applying the same constraints in the experimental
tested formulations was outside the accepted interval. domain obtained with MgSt led to an area with no
As expected, the target load (X3) was the factor robust points that meet the disintegration criteria [24].
whose influence showed the highest magnitude, as An arbitrarily chosen point from that domain was used
its increase determined slower disintegration due to as negative control (NC) with X1 = MgSf, X2 = 1.2%
the high solid fraction determined by the load increase. and X3 = 400 kg. Table V reveals the results of the
The lubricant ratio (X2) also had a positive influence evaluation of the two optimal formulations, as well as
on the disintegration time: the increase in lubricant those obtained for the negative control. The prediction
ratio led to long disintegration time, but this effect capacity of the models was challenged by calculating
was stronger when high target loads were applied on the residual values; the differences between the
the compressed blend, because of the low porosity experimental and the predicted values were small, usually
that prevents water from wetting the structure. below 10%, except for the disintegration time, which
MgSt led to the highest disintegration times, while is understandable due to the subjective evaluation of
NaSf gave formulations with fast disintegration (Figure the disintegration endpoint (Table V). Both RP1 and
2f). The large surface area of MgSt combined with RP2 comply with the conditions imposed by the QTPP
its hydrophobicity, hinder wetting and prevent water for the orodispersible tablets, but the compression
from penetrating the structure [13, 27]. performance parameters were slightly higher for RP1.
The effects on crushing strength (Y7) are similar to Usually, detachment and ejection stresses below 3
those discussed for the tensile strength with the highest MPa ensure good mechanical properties and allow
magnitude obtained for the compression load and a easy packaging and handling [5, 20]. Even values
slight decrease at high amounts of lubricants. comprised between 3 MPa and 5 MPa are considered
Design Space development and DoE validation acceptable if the product does not undergo coating
The experimental domain of a study is defined by or other stressful processes. Therefore, considering
the variation limits of the input factors. Out of the that the detachment and ejection stress values of
experimental domain, the Design Space (DS) represents formulations RP1 and RP2 do not surpass the limit of
a sum of factor combinations that lead to the desired 3 MPa, important differences with respect to compression
responses. The refined model equations obtained for process performance are not expected.
each of the dependent variables are able to predict The NC formulation chosen from outside of the DS
the responses with a particular degree of certainty, showed a long disintegration time of 102.33 s and a
depending on their predictive capacity. DS development detachment stress over 3 MPa, which confirms the
involves applying a series of constraints to the CQAs validity of the DS.
of the product, so that it complies with the Quality Up to this point of the study, the DSs were validated,
Target Product Profile. which confirms the accuracy of the model equations
As shown in Table IV, the first optimization regarded and their predictive power. However, it is still unclear
the tablets’ characteristics: disintegration time and if the obtained results are relevant for the direct
crushing strength. The targeted disintegration time compression of minitablets.
1007FARMACIA, 2020, Vol. 68, 6
Table IV
Optimization criteria
Response Optimization 1 Optimization 2
Criterion Minimum Target Maximum Criterion Minimum Target Maximum
Compressibility Index (Y1) Excluded - - - Minimize - 11 18
Work of compression (Y2) Excluded - - - Excluded - - -
Elastic recovery (Y3) Excluded - - - Excluded - - -
Detachment stress (Y4) Excluded - - - Minimize - 0.6 2
Ejection stress (Y5) Excluded - - - Minimize - 0.4 2
Disintegration time (s) (Y6) Minimize - 20 60 Minimize - 20 60
Crushing strength (Y7) Maximize 40 55 - Maximize 50 55 -
Table V
Design Space validation results
Optimization 1 - Robust point Optimization 2 - Robust point Negative control
(RP1) (RP2) (NC)
Predicted Experimental Residual Predicted Experimental Residual Predicted Experimental Residual
Compressibility Index 18.84 19.10 0.26 18.98 19 0.02 14.31 14.03 -0.28
(%) (Y1)
Detachment stress 2.01 2.13 0.12 1.73 1.68 -0.05 3.25 3.36 0.11
(MPa) (Y4)
Ejection stress 1.00 0.92 -0.08 0.77 0.72 -0.05 2.46 2.46 0.00
(MPa) (Y5)
Disintegration time 30.41 34.00 3.59 23.78 25.33 1.55 98.54 102.33 3.79
(s) (Y6)
Crushing strength 55.43 57.00 1.57 44.55 46.87 2.32 61.50 63.27 1.77
(N) (Y7)
Figure 5.
Design Space for the placebo orodispesible tablets that meet the specifications for disintegration time and crushing
strength (a) and for compressibility index, detachment stress, ejection stress, disintegration time and crushing
strength (b), expressed as probability of failure as a function of the lubricant ratio (X2) and compression load (X3)
Practical implications of the study uniformity. As shown in Table VI, the disintegration
Previous literature reports confirm that data provided time was significantly higher for the NC minitablets
by the dynamic compaction analysis coincide with than for the RP2 formulation, which is in accordance
those obtained with rotary tablet presses, despite with the previous results.
important differences in tablet weight and shape; The crushing strength was higher for the NC formulation,
however it seems that the incidence of defects was but the values displayed a larger variation range. Also,
lower on the rotary press [20]. In order to establish it should be considered that this crushing strength of
whether the DoE approach and the previously described 33.84 N was attained at a high compression load that
DSs are efficient in guiding the preparation of oro- in the long run could be damaging for the sensitive
dispersible minitablets by direct compression, mini- multiple punches [24].
tablets with a diameter of 2 mm were prepared, starting RP2 minitablets displayed a uniform aspect, matte,
from the two formulations, RP2 from the DS and with no colour variations and regular sizes (Figure 6a).
NC from outside the DS. NC minitablets had a glossy, compact appearance, with
Minitablets were evaluated for the same CQAs, crushing black marks on the outer surface (Figure 6b), which
strength and disintegration time and for their weight indicate strong interactions between the compression
1008FARMACIA, 2020, Vol. 68, 6
material and the walls of the dye and difficulties in keeping the process safe within the limits of the
ejection. These phenomena can be correlated to the Design Space. Therefore, these results suggest that
high values of detachment and ejection stresses that the parameters derived from the dynamic compaction
left the NC formulation outside the DS and ignoring analysis could be useful from the early phases of the
them could lead to more serious compression defects development to predict and avoid further manufacturing
like capping or lamination. Such compression errors errors and material loss.
could be avoided by designing the formulation and
Table VI
Evaluation of minitablets prepared out of the RP2 and NC formulations
RP2 minitablets RSD (%) NC minitablets RSD (%)
Crushing strength (N) 17.69 ± 1.22 6.94 33.84 ± 4.70 13.9
Disintegration time (s) 20.5 ± 3.27 15.95 121.63 ± 10.14 10.14
Average weight (mg) 9.59 ± 0.19 1.98 10.29 ± 0.18 1.76
* Results are expressed as mean ± standard deviation; RSD, relative standard deviation.
Figure 6.
Orodispersible minitablets prepared according to the Design Space validation results: RP2 minitablets contain
X1 = NaSf, X2 = 2.2% and were compressed at X3 = 266.6 kg compression load (a) and NC minitablets contain
X1 = MgSf, X2 = 1.2% and were compressed at X3 = 400 kg compression load (b)
Of course, the study has a number of limitations, functions, but nevertheless exert different effects on
primarily the absence of the drug substance. However, the associated powders. MgSt led to powders with
it is known that each product has its own particularities, significantly better flow than NaSf, but also led to
depending on the properties of the active substance increased forces required for detachment and ejection
(particle size, size distribution, particle shape, crystallinity), of the compact and disintegration times. So it could
on the excipients and on the interactions between them. ensure complete filling of the mould, respectively
For example, Ludiflash was previously associated with uniformity of weight and content, but the resulting
APIs known for their different compression properties, tablets could be subjected to fractures and slow
with herbal extracts and with solid lipid pellets and disintegration.
each time different results were obtained in terms of Regarding the selection of the percentage of lubricant
disintegration and resistance [19], but the compression in the mixture, the results indicate the possibility of
variables were more or less neglected. correcting a high elastic recovery, but also the forces
of detachment and ejection, by supplementing the
Conclusions lubricant. On the contrary, the disintegration time can
be kept to a low value by using a small percentage
This study aimed to test the hypothesis that the inclusion
of any of the lubricants, but the one that produces a
of compression performance parameters in the design
weaker hydrophobic effect is NaSf.
as critical features is useful from the earliest stages of
formulation and it confirmed that dynamic compression
Acknowledgement
analysis makes this possible in a short time and with
low substance use, when integrated into a risk based This paper was published under the frame of European
QbD approach. The proposed strategy fits perfectly Social Found, Human Capital Operational Programme
into the QbD concept since the process functioning 2014-2020, project no. POCU/380/6/13/125171.
and the product quality are predicted in the first phases
of the design. Conflict of interest
Other practical information revealed by this study is The authors declare no conflict of interest.
related to the differences between the behaviours of
the two lubricants. Apparently they perform the same
1009FARMACIA, 2020, Vol. 68, 6
References characteristics of orally disintegrating tablets manufactured
using the phase transition of sugar alcohol. Eur J
1. Bajcetic M, de Wildt SN, Dalinghaus M, Breitkreutz J, Pharm Biopharm., 2008; 69(3): 986-992.
Klingmann I, Lagler FB, Keatley-Clarke A, Breur 14. Lura A, Luhn O, Gonzales JS, Breitkreutz J, New
JMPJ, Male C, Jovanovic I, Szatmari A, Ablonczy L, orodispersible mini-tablets for paediatric use – A
Burckhardt BB, Cawello W, Kleine K, Obarcanin E, comparison of isomalt with a mannitol based co-processed
Spatenkova L, van der Meulen M, Wagner P, Walsh J, excipient. Int J Pharm., 2019; 572: 118804: 1-11.
Laer S, Orodispersible minitablets of enalapril for use 15. Mitra B, Thool P, Meruva S, Aycinena JA, Li J,
in children with heart failure (LENA): Rationale and Patel J, Patel K, Agarwal A, Karki S, Bowen W,
protocol for a multicentre pharmacokinetic bridging Decoding the small size challenges of mini-tablets
study and follow-up safety study. Contemp Clin Trials for enhanced dose flexibility and micro-dosing. Int
Commun., 2019; 15: 100393: 1-8. J Pharm., 2020; 574: 118905: 1-11.
2. Bowles A, Keane J, Ernest T, Clapham D, Tuleu C, 16. Moulis F, Durrieu G, Lapeyre-Mestre M, Off-label
Specific aspects of gastro-intestinal transit in children and unlicensed drug use in children. Therapie,
for drug delivery design. Int J Pharm., 2010; 395(1-2): 2018; 73(2): 135-149.
37-43. 17. Mullarney MP, Hancock BC, Improving the prediction
3. Casian T, Iurian S, Bogdan C, Rus L, Moldovan M, of exceptionally poor tableting performance: an
Tomuta I, QbD for pediatric oral lyophilisates development: investigation into Hiestand’s “special case”. J Pharm
risk assessment followed by screening and optimization. Sci., 2004; 93(8): 2017-2021.
Drug Dev Ind Pharm., 2017; 43(12): 1932-1944. 18. Paul S, Sun CC, Systematic evaluation of common
4. Casian T, Bogdan C, Tarta D, Moldovan M, Tomuta I, lubricants for optimal use in tablet formulation. Eur
Iurian S, Assessment of oral formulation-dependent J Pharm Sci., 2018; 117: 118-127.
characteristics of orodispersible tablets using texture 19. Petrovick GF, Kleinebudde P, Breitkreutz J, Orodispersible
profiles and multivariate data analysis. J Pharm Biomed tablets containing taste-masked solid lipid pellets
Anal., 2018; 152: 47-56. with metformin hydrochloride: Influence of process
5. Draskovic M, Djuris J, Ibric S, Parojcic J, Functionality parameters on tablet properties. Eur J Pharm Biopharm.,
and performance evaluation of directly compressible 2018; 122: 137-145.
co-processed excipients based on dynamic compaction 20. Pitt KG, Webber RJ, Hill KA, Dey D, Gamlen MJ,
analysis and percolation theory. Powder Tech., 2018; Compression prediction accuracy from small scale
326(3): 292-301. compaction studies to production presses. Powder
6. Drumond N, van Riet-Nales DA, Karapinar-Carkit F, Tech., 2015; 270: 490-493.
Stegemann S, Patients’ appropriateness, acceptability, 21. Ranmal SR, O’Brien F, Lopez F, Ruiz F, Orlu M,
usability and preferences for pharmaceutical preparations: Tuleu C, Walsh J, Liu F, Methodologies for assessing
results from a literature review on clinical evidence. the acceptability of oral formulations among children
Int J Pharm., 2017; 521(1-2): 294-305. and older adults: a systematic review. Drug Discov
7. Edqm.eu. European Pharmacopoeia, 10th ed. EDQM, Today, 2018; 23(4): 830-847.
European Pharmacopoeia, Council of Europe, 2019, 22. Rus LM, Iurian S, Kacso I, Borodi G, Porav S, Hegheş
www.edqm.eu/en/european-pharmacopoeia. SC, Iuga CA, Tomuţă I, Development of meloxicam
8. Eriksson L, Johansson E, Kettaneh-Wold N, Wikstrom oral lyophilisates: role of thermal analysis and
C, Design of experiments, principles and applications, complementary techniques. Farmacia, 2019; 67(1):
3rd edition, Umetrics Academy, Umea, 2008. 56-67.
9. Fda.gov., Guidance for Industry Q8(R2) Pharmaceutical 23. Standing JF, Tuleu C, Paediatric formulations-getting to
Development. Silver Spring: U.S. Department of Health the heart of the problem. Int J Pharm., 2005; 300(1-2):
and Human Services Food and Drug Administration; 56-66.
2016, www.fda.gov/media/71535. 24. Stoltenberg I, Breitkreutz J, Orally disintegrating
10. Hirschberg C, Sun CC, Rantanen J, Analytical method mini-tablets (ODMTs) – A novel solid oral dosage
development for powder characterization: Visualization form for paediatric use. Eur J Pharm Biopharm.,
of the critical drug loading affecting the processability 2011; 78(3): 462-469.
of a formulation for direct compression. J Pharm 25. Ternik R, Liu F, Bartlett JA, Khong YM, Thiam Tan
Biomed Anal., 2016; 128: 462-468. DC, Dixit T, Wang S, Galella EA, Gao Z, Klein S,
11. Iurian S, Tomuta I, Bogdan C, Rus L, Tokes T, Barbu- Assessment of swallowability and palatability of oral
Tudoran L, Achim M, Moldovan M, Leucuta S, dosage forms in children: report from an M-CERSI
Defining the design space for freeze-dried orodispersible pediatric formulation workshop. Int J Pharm., 2018;
tablets with meloxicam. Drug Dev Ind Pharm., 2016; 536(2): 570-581.
42(12): 1977-1989. 26. Tissen C, Woertz K, Breitkreutz J, Kleinebudde P,
12. Iurian S, Bogdan C, Tomuta I, Szabo-Revesz P, Chvatal Development of mini-tablets with 1mm and 2mm
A, Leucuta SE, Moldovan M, Ambrus R, Development diameter. Int J Pharm., 2011; 416(1): 164-170.
of oral lyophilisates containing meloxicam nanocrystals 27. Wang J, Wen H, Desai D, Lubrication in tablet
using QbD approach. Eur J Pharm Sci., 2017; 104: formulations. Eur J Pharm Biopharm., 2010; 75(1):
356-365. 1-15.
13. Kuno Y, Kojima M, Nakagami H, Yonemochi E,
Terada K, Effect of the type of lubricant on the
1010You can also read