IMPACT OF CLIMATE CHANGE AND VARIABILITY ON IRRIGATION REQUIREMENTS: A GLOBAL PERSPECTIVE
←
→
Page content transcription
If your browser does not render page correctly, please read the page content below
IMPACT OF CLIMATE CHANGE AND VARIABILITY ON IRRIGATION
         REQUIREMENTS: A GLOBAL PERSPECTIVE

                                          PETRA DÖLL
       Center for Environmental Systems Research, University of Kassel, Kurt-Wolters-Str. 3,
                                   D-34109 Kassel, Germany
                                 E-mail: doell@usf.uni-kassel.de

Abstract. Anthropogenic climate change does not only affect water resources but also water de-
mand. Future water and food security will depend, among other factors, on the impact of climate
change on water demand for irrigation. Using a recently developed global irrigation model, with
a spatial resolution of 0.5◦ by 0.5◦ , we present the first global analysis of the impact of climate
change and climate variability on irrigation water requirements. We compute how long-term average
irrigation requirements might change under the climatic conditions of the 2020s and the 2070s, as
provided by two climate models, and relate these changes to the variations in irrigation requirements
caused by long-term and interannual climate variability in the 20th century. Two-thirds of the global
area equipped for irrigation in 1995 will possibly suffer from increased water requirements, and on
up to half of the total area (depending on the measure of variability), the negative impact of climate
change is more significant than that of climate variability.

                                        1. Introduction

Anthropogenic climate change not only affects runoff and thus water availability
but also the demand for water. If a region becomes drier and warmer, the decreased
water availability will be exacerbated by an increased water demand. The water use
sector that will be influenced most by climate change is irrigation. Irrigation is by
far the largest use sector; today about 67% of the current global water withdrawal
and 87% of the consumptive water use (withdrawal minus return flow) is for ir-
rigation purposes (Shiklomanov, 1997). Irrigated agricultural land comprises less
than one-fifth of the total cropped area but produces about two-fifths of the world’s
food. It is generally expected that irrigated agriculture will have to be extended in
the future in order to feed the world’s growing population. However, it is not yet
known whether there will be enough water available for the necessary extension.
One step towards evaluating how much water will be needed for irrigation in the
future is to quantify how climate change will affect irrigation water requirements
(IR – the amount of water that must be applied to the crop by irrigation in order
to achieve optimal crop growth). In the next step, the estimated impact of climate
change on the plant-physiological water requirements could serve as input to a
global agro-economic model which computes the economic demand for irrigation
water by taking into account crop yields and prices, costs and water availability.

      Climatic Change 54: 269–293, 2002.
      © 2002 Kluwer Academic Publishers. Printed in the Netherlands.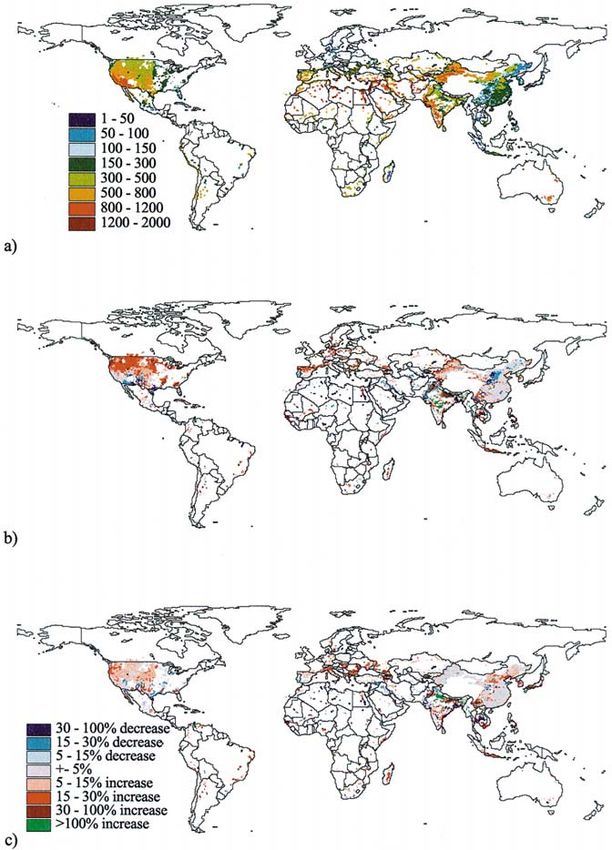
270                                 PETRA DÖLL

    There are many studies on the impact of climate change on runoff, mostly at
the river basin scale, but the impact of climate change on irrigation has rarely been
explored. Adams et al. (1990) and Allen et al. (1991) used crop growth models
for wheat, maize, soybean and alfalfa at typical sites in the USA and the output
of two General Circulation Models (GCMs) to compute the change of IR under
doubled CO2 conditions. Results depend highly on the GCM; in three of the six
agricultural regions defined by Adams et al., the GCM scenarios do not even agree
on whether there is a decrease or an increase of water use. Allen et al. (1991) also
computed a climate-driven change in growing periods, which highly influences
IR. They concluded that the direct effect of increased CO2 concentrations on crop
transpiration and thus IR cannot be quantified yet because of insufficient knowledge
about the various, often counteracting effects. (Decreased stomatal conductance
decreases the transpiration, but increased leaf mass due to CO2 fertilization and
increased leaf temperature increase it.) Like other researchers (e.g., McCabe and
Wolock, 1992; Ramirez and Finnerty, 1996), they performed a mere sensitivity
analysis of the CO2 effect and determined that any increases of IR due to climate
change is moderated or even nullified by a decrease in bulk stomatal conductance;
this depends also on the crop type. In their integrated economic assessment of
climate change impacts on Egypt, Yates and Strzepek (1996) used the same crop
models as Adams et al. and Allen et al. and also found that applying two different
GCMs resulted in relevant differences in the predicted changes of IR. In addition,
by using economic models, both Adams et al. and Yates and Strzepek computed
the change of irrigated areas due to global climate change. To account for the high
uncertainty of future climate, Jones (2000) constructed probabilities of temperature
and precipitation change based on local and global climate scenarios and computed
how often a certain irrigation requirement will be exceeded due to climate change;
this procedure, however, was only applied to a single farm in Australia.
    On the global scale, scenarios of future irrigation water use were developed
by Seckler et al. (1997) and Alcamo et al. (2000). In both studies, the impact
of climate change was not taken into account. In the work of Seckler et al., the
smallest computational units were countries, while Alcamo et al. employed the
raster-based global irrigation model GIM of Döll and Siebert (2001), with a spatial
resolution of 0.5◦ by 0.5◦ .
    In this paper, GIM is applied to explore the impact of climate change on the
irrigation water requirements IR of those areas on the globe that were equipped for
irrigation in 1995. Estimates of long-term average climate change for the 2020s
and 2070s are taken from two different GCMs. In addition, the impact of climate
change is compared to the impact of interannual and multidecadal climate variabil-
ity in the 20th century. This gives an indication of the severity of the impact of
climate change on IR. The comparison to the impact of interannual climate vari-
ability reflects the notion that farmers might not suffer much from climate change
if the (long-term average) climate change impact is small compared to the impact
of current climate variability, to which they are accustomed. The comparison to
CLIMATE IMPACT ON IRRIGATION REQUIREMENTS 271
the impact of long-term climate variability in the 20th century shows whether the
future changes of IR are more significant than the past climate-induced changes.
In our study, climate change is defined as changes in the long-term averages
of precipitation and temperature only. Likely future changes in climate variability
could not be taken into account as GCMs cannot provide reliable estimates of such
changes. In our agro-climatological approach, climate change is assumed to modify
the starting date of the growing season (but not its length) and, in a very simplified
manner, the cropping pattern. Any change in size and location of the irrigated
areas due to an adaptation to climate change or for any other reason is neglected.
(Such changes could have been included, for example, by applying a global agro-
economic model, which was beyond the scope of out research.) Furthermore, the
direct effects of increased CO2 concentrations on crop transpiration, in particular
via a decreased bulk stomatal conductance, had to be ignored due to insufficient
quantitative knowledge.
2. Global Model of Irrigation Requirements
The global model of irrigation requirements GIM (Global Irrigation Model) of
Döll and Siebert (2001) computes net and gross irrigation water requirements in
all 0.5◦ by 0.5◦ raster cells with irrigated areas. ‘Gross irrigation requirement’
is the total amount of water that must be applied by irrigation such that evapo-
transpiration may occur at the potential rate and optimal crop productivity may
be achieved. Only part of the applied water is actually ‘used’ by the plant and
evapotranspirates; this amount, the difference between the potential evapotranspi-
ration and the evapotranspiration that would occur without irrigation, is the ‘net
irrigation requirement’. The other part of the added water serves to leach salts
from the soil, leaks or evaporates unproductively from irrigation canals, or runs
off; this amount depends on irrigation technology and management. The ratio of
the net irrigation water requirement and the total amount of water that needs to be
withdrawn from the source, the gross irrigation requirement, is called ‘irrigation
water use efficiency’. Under conditions of restricted water availability, farmers may
choose to irrigate at a lower than optimal rate. Then, the actual water withdrawal
is less than the gross irrigation requirement, and, equally, the actual consumptive
water use for irrigation is less than the net irrigation requirement IRnet .
GIM is a module of WaterGAP, a global model of water availability and water
use that has been developed to assess the impact of global change on the problem of
water scarcity (Döll et al., 1999). It is based on a global map of irrigated areas that
shows the fraction of each 0.5◦ by 0.5◦ cell that was equipped for irrigation around
1995 (Döll and Siebert, 2000). On the global scale, there is little information about
what crops are grown under irrigated conditions where and when. Therefore, only
two crop types can be distinguished, rice and non-rice; the cropping patterns and
the growing seasons are simulated by GIM, based on information about irrigated272 PETRA DÖLL rice areas, cropping intensity, soil suitability and climate. IRnet per unit irrigated area is then computed as a function of climate and crop type, while the gross irrigation requirement is calculated by dividing IRnet by the irrigation water use efficiency. 2.1. GLOBAL MAP OF IRRIGATED AREAS The digital global map of irrigated areas shows the irrigation density in 1995, i.e., the percentage of each 0.5◦ by 0.5◦ cell area that was equipped for controlled irrigation around 1995. Flood recession cropping areas and cultivated wetlands are not included in the map. The map was generated by combining information from large-scale maps, FAO data on total irrigated area per country in 1995 and, where available, national data on total irrigated area per county, drainage basin or federal state. The data base of the map is rather uncertain. In spite of the uncertainties, we consider the generated global map of irrigated areas to be appropriate for use in global and continental assessments. A discussion of the map quality as well as a description of the data sources and the map generation process can be found in Döll and Siebert (2000); the data set is available from the authors. 2.2. CROPPING PATTERN The cropping pattern for each cell with irrigated land describes (1) whether only rice, only non-rice or both are irrigated there and (2) whether, within one year, there are one or two growing seasons for rice and non-rice. We assume that the growing period for both rice and non-rice is 150 days. The data used to model the cropping pattern are: total irrigated area, long-term average temperature and soil suitability for paddy rice (FAO, 1995) in each cell, harvested area of irrigated rice in each country (IRRI, 1988) and cropping intensity in each of 19 world regions (Table II). In general, ‘cropping intensity’ refers to the average number of crops that are consecutively grown within a year. In GIM, it refers to the average number of growing periods of 150 days duration each. If, for example, on one-half of the irrigated area of a world region, crops were grown only once a year, and on the other half two crops, one after the other, the average cropping intensity would be 1.5. The assumed cropping intensities are rough estimates which, however, strongly influence irrigation requirements. 2.3. GROWING SEASON Once the cropping pattern of a cell is defined, the start date of each growing sea- son is computed for each crop and growing season. Each moving 150-day period within a year is ranked according to its long-term average daily temperature and precipitation values (Döll and Siebert, 2001). The temperature criterion reflects that in each growing stage, rice and non-rice crops require a certain temperature range for optimum yield, while the precipitation criterion mirrors farmers’ preference to
CLIMATE IMPACT ON IRRIGATION REQUIREMENTS                       273

start irrigated cropping during the wet season while harvesting is best done if it
does not rain. The growing season is then defined to be the most highly ranked
150-day period; in case of two consecutive growing periods, the combination with
the highest total number of ranking points is chosen.

2.4. NET IRRIGATION REQUIREMENT

Following the CROPWAT approach of Smith (1992), the net irrigation requirement
per unit irrigated area during the growing season is computed, with a daily time
step, as the difference between the crop-specific potential evapotranspiration and
the effective precipitation as
    IRnet = kc Epot − Peff     if kc Epot > Peff
                                                                                     (1)
    IRnet = 0                  otherwise
with IRnet = net irrigation requirement per unit area [mm/d]; Peff = effective
precipitation [mm/d]; Epot = potential evapotranspiration [mm/d]; kc = crop
coefficient [dimensionless].
    Crop coefficient kc is a function of the crop type (rice and non-rice) and the day
of the growing season. Peff is the fraction of the total precipitation P that is avail-
able to the crop and does not run off. Without detailed site-specific information,
Peff is very difficult to determine. We use a simple approximation following the
USDA Soil Conservation Method, as cited in Smith (1992, p. 21), with
    Peff = P (4.17 − 0.2P )/4.17        for P < 8.3 mm/d
                                                                                     (2)
    Peff = 4.17 + 0.1P                  for P ≥ 8.3 mm/d .
   CROPWAT uses monthly precipitation data from which 10-day-averages are
derived as input for the calculations (Smith, 1992). Application of Equation (1)
with daily precipitation values, i.e., with days with and without precipitation, would
lead to a gross overestimation of IRnet . In this case, the relatively high precipitation
on the wet days in excess of the daily potential evapotranspiration would be lost,
while a temporal averaging of the precipitation simulates the capacity of the soil
to store the precipitation. Therefore, in GIM, the daily precipitation values are
averaged over either 10 or 3 days. The averaging period of 3 days simulates the
operation of paddy rice fields in Asia, where due to inundation and water-saturated
soils only little precipitation can be stored, which leads to a higher IRnet .

2.5. MODEL VALIDATION

The accuracy of the model results can be assessed only in a rough manner, which
is due to limited independent data available at the scale of the model. The simu-
lated cropping patterns (in particular the rice growing areas) and growing seasons
generally appear to reflect reality, but given the simplicity of the model, only the
dominant features are represented and some discrepancies certainly occur (Döll
274 PETRA DÖLL
and Siebert, 2001). The evaluation of the quality of the computed irrigation re-
quirements is hampered by the high uncertainty of most published information;
irrigation water use is generally not measured or even registered. Besides, even the
value of the total irrigated area within a country is, for most countries, rather un-
certain (Döll and Siebert, 2000). Comparisons of simulated irrigation requirements
to independent data on irrigation water use in countries with apparently reliable
information indicate that the irrigation model tends to somewhat overestimate the
actual water use. This might be consistent with the model approach of computing
optimal water requirements, and not actual (suboptimal) water uses. Independent
data are, in general, only available for withdrawal water use (gross irrigation re-
quirements) such that an additional source of uncertainty, the assumed irrigation
water use efficiency, affects the comparison to independent data. In the case of
Israel, the model would underestimate IRnet by 50% if we assumed an irrigation
water use efficiency of 0.6, but by only 15% with an efficiency of 0.8 (Döll and
Siebert, 2001). Egypt’s irrigation requirement is underestimated by 28%, while
China’s is overestimated by 13% (Döll and Siebert, 2001).
Only for the U.S.A., there exists detailed information on irrigated areas as well
as on consumptive and withdrawal water use for irrigation (for each county). There,
the computed IRnet of 112 km3 /yr (1961–1990 climate normal) fits amazingly well
to the observed consumptive use value of 113 km3 /yr (Solley et al., 1998). In order
to check whether this correspondence is due to a canceling of errors, state averages
of IRnet are compared, too. Also on the state level, the simulation results fit the inde-
pendent data well, at least for states with a high net irrigation requirement (model
efficiency of 0.975, 48 states, Döll and Siebert, 2001). The good correspondence
in the case of the U.S.A., with the best information on irrigation water use world-
wide, is encouraging. In conclusion, we think that the presented irrigation model is
accurate enough for continental-scale or global-scale modeling.
3. Climatic Input: Defining Climate Change and Climate Variability
In order to assess the impact of climate change and climate variability on irrigation
requirements, the irrigation requirements under the following climatic conditions
are computed:
• present-day long-term average climatic conditions, i.e., the climate normal
1961–1990 (‘baseline climate’),
• future long-term average climatic conditions of the 2020s and 2070s (‘climate
change’),
• 1-in-10 dry and wet years under climate conditions of 1901 to 1995 (‘interan-
nual climate variability’),
• long-term average climatic conditions, climate normals 1901–1930 and 1931–
1960 (‘long-term multidecadal climate variability’).CLIMATE IMPACT ON IRRIGATION REQUIREMENTS 275
The global irrigation model requires information on precipitation, temperature
and potential evapotranspiration for each 0.5◦ grid cell. Potential evapotranspira-
tion Epot is computed according to Priestley and Taylor (1972) as a function of
net radiation and temperature; net radiation is calculated following Shuttleworth
(1993) based on the day of the year, latitude, sunshine hours and short-wave albedo.
The albedo of irrigated land is here assumed to be 0.23. We follow the recommen-
dation of Shuttleworth (1993) to set the Priestley–Taylor coefficient α to 1.26 for
areas with relative humidity of approx. 60% or more and to 1.74 for other areas.
Shuttleworth states that the resulting potential evapotranspiration is acceptable to
an accuracy of 15% for estimating the evapotranspiration of the reference crop
(short grass).
The climatic input of the global irrigation model is based on long time series of
observed monthly values of precipitation, temperature, sunshine hours and number
of wet days. These climate data that were collected and interpolated onto a grid of
0.5◦ by 0.5◦ by New et al. (2000). While for sunshine only the long-term average
values of the period 1961–1990 are provided, the complete time series between
1901 and 1995 is available for precipitation, temperature and number of wet days.
We corrected the precipitation values for measurement errors using the monthly
0.5◦ by 0.5◦ correction factors of Legates and Willmott (1990) based on a model for
estimating the bias in precipitation gauge measurements caused by wind, wetting
and evaporation losses.
Daily values of temperature and sunshine are calculated from the monthly val-
ues using cubic splines. Synthetic daily precipitation values are generated from
the corrected monthly values by using the information on the number of wet days
per month, such that there are days with and without precipitation. Following the
approach of Geng et al. (1986), the sequence of wet and dry days in each month is
simulated; then, the total monthly precipitation is distributed equally over all wet
days of the month.
Long-term average IRnet under present climatic conditions is computed for
the climate normal 1961–1990 (baseline climate). Cropping patterns and growing
seasons are computed based on 30-year climatic averages, which reflects that in
most cases, farmers cannot base their decision on when to start cropping on the
unknown climate of the growing season that is about to begin. Long-term average
irrigation requirements, however, are calculated by averaging 30-year time series
of irrigation requirements. This averaging procedure leads to a more realistic esti-
mate of the long-term average irrigation requirement than a calculation based on
average climatic conditions. In the latter case, the irrigation requirement may be
underestimated because it is not linear with respect to precipitation and potential
evapotranspiration (comp. Equation (1)). In Japan, for example, with a low irriga-
tion requirement per unit irrigated area, the error is 50%. On the global average,
the underestimation would amount to only 2.4%.276 PETRA DÖLL
3.1. CLIMATE CHANGE
In order to derive scenarios of future climate in the 2020s and the 2070s, the cell-
values of observed monthly precipitation and temperature from New et al. (2000)
were scaled by changes in precipitation and temperature calculated by two state-
of-the-art GCMs: (1) the ECHAM4/OPYC3 model (Röckner et al., 1996; transient
greenhouse gas and sulfate aerosol integration with forcing according to the IPCC
IS92a scenario, see Leggett et al., 1992) and (2) the HadCM3 model (Gordon
et al., 1999; transient all-anthropogenic forcing integration HC3AA with forcing
similar to IS92a). In both cases, the decadal averages of mean monthly values of
precipitation and temperature of the years 2020–2029 and 2070–2079 as well as,
for present climate, the 1950–1979 (ECHAM4) and 1960–1989 (HadCM3) aver-
ages were used for scaling the observed values. Applying a simple interpolation
procedure, the GCM results were interpolated from their original resolutions to the
GIM resolution of 0.5 by 0.5◦ . Future changes in sunshine hours were not taken
into account.
In order to compute long-term average IRnet under the climatic conditions of
the 2020s and the 2070s, the monthly temperature and precipitation values of the
each year of the climate normal 1961–1990 are scaled by the climate change as
computed by the GCMs. In the case of temperature, the observed values are scaled
by adding to them the difference of the GCM values of future and present-day
temperature, while the 30-year perturbed precipitation time series was produced by
multiplying the observed values with the future GCM precipitation as a ratio of the
present-day GCM precipitation. This methodology implies that possible effects of
climate change on climate variability are not taken into account; until now, GCMs
cannot model well observed climate variability, and therefore they do not reliably
simulate future climate variability.
3.2. CLIMATE VARIABILITY
IRnet in the typical dry and wet years is determined by first calculating the annual
IRnet -values under the climatic conditions in each year between 1901 and 1995.
For determining the cell-specific 1-in-10-dry-year irrigation requirement, the 9th
highest IRnet -value that is computed for this time series is selected. This value
will only be exceeded in 1 out of 10 years. For the 1-in-10-wet-year irrigation
requirement, the 9th lowest IRnet -value is picked. Long-term average IRnet for the
climate normals 1901–1930 and 1931–1960 is computed like IRnet for the baseline
climate 1961–1990.
4. Results
Climate change has a two-fold effect on long-term average irrigation requirements
per unit irrigated area. On the one hand, the optimal cropping patterns and growingCLIMATE IMPACT ON IRRIGATION REQUIREMENTS 277
seasons differ from those under baseline climatic conditions, and, on the other
hand, the irrigation requirement of a certain crop on a given day of the year
changes. The impact of interannual climate variability on irrigation requirements is
modeled to be due to the latter effect only. The results obtained with the ECHAM4
climate change scenarios are presented first, followed by a comparison to the im-
pacts computed with the HadCM3 climate change scenario; this sequence does not
imply any value judgement on the quality of two GCMs.
4.1. IMPACT OF CLIMATE CHANGE ON CROPPING PATTERNS AND GROWING
SEASONS
The cropping patterns and growing seasons of an irrigated area are strongly
influenced by temperature and precipitation conditions. In GIM, temperature de-
termines whether rice can be grown and which areas within a world region are
best suited for multicropping, and the growing seasons are identified based on
optimal temperature and precipitation conditions. For selected cells around the
globe, Table I shows how cropping patterns and the starting dates of the grow-
ing seasons could change by the 2020s due to climate change as computed by
ECHAM4. The cropping pattern changes in only one out of the ten cells: in the
cell in the southeast of the U.S.A., rice is replaced by non-rice, which is due to
higher temperatures and thus improved rice growing conditions elsewhere in the
U.S.A. The growing seasons shift in all but two cells, often by approximately one
month. Looking at larger-scale patterns, there are climate-dependent shifts of the
areas with multicropping in Egypt and South Asia. In Egypt, for example, modeling
of the cropping pattern results, for the baseline climate, in two crops per year in the
southern part and only one crop per year in the central part, and vice versa for
the 2020s. In the northern part of Egypt, multicropping is modeled to occur both
today and in the future. The starting dates of the growing seasons are simulated to
shift by at least a week in most of the irrigated cells world-wide. Particularly in the
subtropical zones, the growing season, i.e., the season of the year with the optimal
climate conditions for crop growth, is typically shifted into the (warmer) winter
season.
4.2. IMPACT OF CLIMATE CHANGE ON NET IRRIGATION REQUIREMENTS
Optimal cropping patterns or growing seasons under the climate conditions of the
2020s differ from those under baseline climate, and these changes alone lead to
different values of the annual IRnet . The example of the cell in SE-England (Table I)
shows that even if cropping pattern and growing season remain the same, IRnet may
change significantly due to climate change.
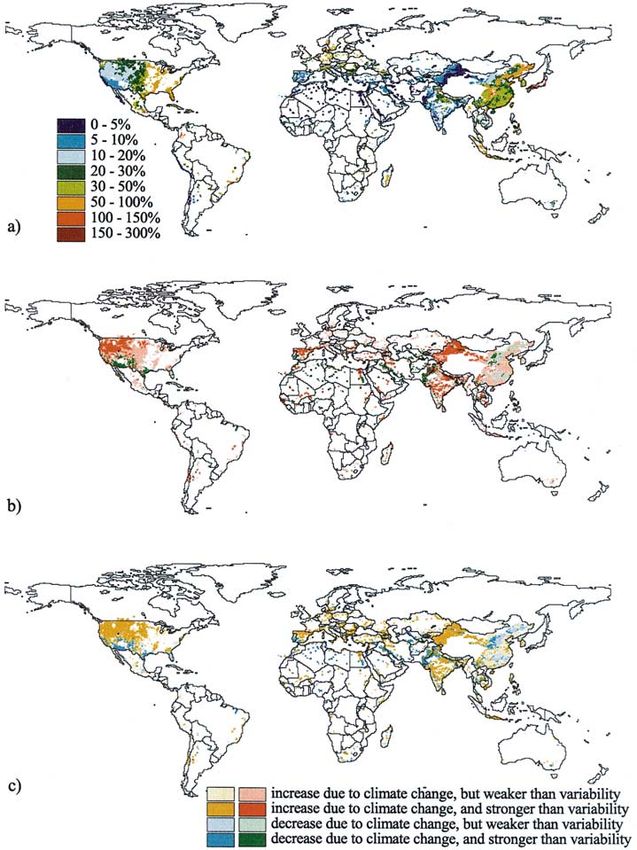
Figure 1a provides a global map of IRnet per unit irrigated area for the baseline
climate. Only cells with a significant total irrigation requirement are shown, i.e.,
cells with irrigated areas in 1995 in which IRnet averaged over the total cell area
was higher than 1 mm/yr. Clearly, the current climatic conditions are reflected,278 PETRA DÖLL
Table I
Impact of climate change on cropping patterns, growing seasons and net irrigation require-
ments IRnet per unit irrigated area in selected cells
Grid cell First day of growing season(s) a IRnet , mm/yr
Baseline 2020s Baseline 2020s
SE-England nr: May 19 nr: May 19 77 129
52.75◦ N, 0.75◦ E
N-Germany nr: May 19 nr: May 31 72 99
52.75◦ N, 10.25◦ E
NE-China nr: May 23 nr: May 23 16 16
◦ ◦
42.75 N, 125.75 E
W-Spain nr: April 11 nr: March 8 771 701
39.25◦ N, 5.75◦ W
N-Egypt r/nr: April 1/Aug. 29 r/nr: March 30/Aug. 27 1393 1460
31.25◦ N, 30.75◦ E nr/nr: Jan. 15/June 14 nr/nr: Feb. 15/July 15
S-China r/nr: April 7/Sept. 4 r/nr: March 24/Aug. 21 234 238
28.75◦ N, 115.75◦ E
SE-U.S.A. r: May 27 nr: June 20 87 54
27.25◦ N, 81.25◦ W
NE-Brazil r/r: Jan. 28/July 6 r/r: Jan. 28/July 6 252 298
4.75◦ S, 37.75◦ W nr: Jan. 18 nr: Jan. 31
Chile nr: Nov. 8 nr: Oct. 26 725 771
28.75◦ S, 70.75◦ W
S-Australia nr: Sept. 21 nr: Aug. 23 652 587
37.75◦ S, 144.75◦ E
a nr: non-rice, r: rice, r/nr: rice in the first growing season, non-rice in the second.
Irrigated areas of 1995, under 1961–1990 average observed climate (‘baseline’), and scaled
with ECHAM4/OPYC3 climate scenario for 2020–2029 (‘2020s’).
with IRnet being highest in hot and arid regions such as Northern Africa and lowest
in cold or humid regions such as Northern Europe and Southeast Asia. Figure 1b
presents the percent changes of IRnet by the 2020s as computed with the ECHAM4
climate scenario. In order to interpret these changes, it is helpful to look at the
changes in the climate variables. While annual average temperature will increase
in all regions with irrigation, the precipitation change patterns are much more com-
plex. Figure 2 (top) indicates the changes of annual precipitation that ECHAM4
computes for the 2020s. Note, however, that it is not the annual precipitation valuesCLIMATE IMPACT ON IRRIGATION REQUIREMENTS 279
that affect IRnet but the monthly ones, as they determine the start of the growing
season and the situation during the growing season. Therefore, even in regions
where annual precipitation decreases, IRnet may decrease, too, due to the following
reasons: (1) more precipitation during the growing period, (2) a shift in the mod-
eled growing period due to the change in temperature and precipitation in the cell
(e.g., towards the winter when temperatures rise above optimal temperatures in the
summer, see Section 2.3), (3) a change in the modeled cropping pattern due to the
change in temperature and precipitation within the world region.
Until the 2020s, irrigation requirements increase in most irrigated areas north of
40◦ N, by up to 30% (Figure 1b), which is mainly due to decreased precipitation, in
particular during the summer. South of this latitude, the pattern becomes complex.
For most of the irrigated areas of the arid northern part of Africa and the Middle
East, IRnet decreases. In Egypt, a decrease of about 50% in the southern part is
accompanied by an increase of about 50% in the central part. These changes are
mainly due to the climate-dependent shift of the areas in which multicropping is
done (see Section 4.1). Similarly, in India cells with a strong increase border cells
with a strong decrease, which is also due to changing cropping pattern. In central
India, baseline IRnet -values of 250–350 mm are computed to more than double
by the 2020s. In large parts of China, the impact of climate change is negligible
(less than 5%), with decreases in northern China, as precipitation is assumed to
increase (Figure 2). In general, climate change impacts are simulated to increase in
magnitude by the 2070s (not shown).
When the cell-specific net irrigation requirements (in km3 /yr) are summed up
over the world regions, increases and decreases of the cell values caused by climate
change average out, at least to a large degree (Table II). The irrigation requirement
increases in 11 out of the 17 world regions by the 2020s, but not more than 10%
(except Southeast Asia with 19%). By the 2070s, an increase will have occurred
in 12 regions, 10 of which also showed an increase by the 2020s. The highest
absolute increases are predicted for South Asia (Pakistan, India and Bangladesh),
and the highest relative increases for Southeast Asia where per hectare IRnet is low.
IRnet in Northern Africa and the Middle East is computed to decrease by about
5% until the 2020s and by about 15% until the 2070 even though temperatures
increase and precipitation decreases in the major irrigated regions (e.g., the Nile
and the Euphrates/Tigris basins, see Figure 2 and Table III). This is explained by
the climate-induced shift of the (optimal) growing seasons to the winter months
when solar radiation and thus potential evapotranspiration is lower; global warm-
ing causes the summer temperatures to exceed the optimal temperatures for crop
growth. The global net irrigation requirement is computed to increase by 3.3% in
the 2020s and by 5.5% in the 2070s, from 1092 km3 /yr for the baseline climate.
According to our computations, IRnet will increase on 66% of the irrigated area of
1995 until the 2020s, and on 62% until the 2070s. Thus climate change, with a
global increase in temperature and precipitation, might result in a global increase280 PETRA DÖLL Figure 1. (a) Net irrigation requirement IRnet per unit irrigated area under baseline climate (1961–1990) [mm/yr]. (b) Change of IRnet between baseline climatic condition and the 2020s, due to climate change as computed by ECHAM4. (c) Like (b), but due to climate change as computed by HadCM3. Only those cells are shown in which IRnet per unit cell area was more than 1 mm/yr (baseline climate, 1995 irrigated areas).
CLIMATE IMPACT ON IRRIGATION REQUIREMENTS                             281

Figure 2. Change of annual precipitation between baseline climatic condition and the 2020s/2070s,
as computed by ECHAM4 and HadCM3.
Table II
                                                                                                               282

           Impact of climate change on computed net irrigation requirements IRnet of world regions

                    Irrigated    Cropping    Long-term average IRnet , km3 /yr
                    area 1995,   intensity   Baseline 2020s                           2070s
                    1000 km2                            ECHAM4 HadCM3                 ECHAM4         HadCM3

 Canada                7.1       1.0            2.4         2.9          2.7             3.3            2.9
 U.S.A.              235.6       1.0          112.0       120.6        117.9           123.0          117.9
 Central America      80.2       1.0           17.5        17.0         17.6            18.1           19.7
 South America        98.3       1.0           26.6        27.1         27.5            28.2          29.1
 Northern Africa      59.4       1.5           66.4        62.7         65.3            56.0           57.7
 Western Africa        8.3       1.0            2.5         2.2          2.4             2.4            2.6
 Eastern Africa       35.8       1.0           12.3        13.1         12.2            14.5           14.3
 Southern Africa      18.6       1.0            7.1         7.0          7.4             6.4            7.2
 OECD Europe         118.0       1.0           52.4        55.8         55.2            56.5           57.8
                                                                                                               PETRA DÖLL

 Eastern Europe       49.4       1.0           16.7        18.4         19.0            19.7           22.1
 Former U.S.S.R.     218.7       0.8          104.6       106.6        112.1           104.4          108.7
 Middle East         185.3       1.0          144.7       138.7        142.4           126.5          137.8
 South Asia          734.6       1.3          366.4       389.8        400.4           410.7          422.0
 East Asia           492.5       1.5          123.8       126.0        126.6           131.3          127.1
 Southeast Asia      154.4       1.2           17.1        20.3         18.8           30.4            28.6
 Oceania              26.1       1.5           17.7        17.8         17.6            18.2           19.7
 Japan                27.0       1.5            1.3         1.3          1.8             1.4            1.5

 World              2549.1                   1091.5      1127.5       1147.0          1151.0         1176.8

Irrigated areas of 1995, under 1961–1990 average observed climate (‘baseline’), and scaled with ECHAM4/OPYC3
or HadCM3 climate change scenarios for 2020–2029 (‘2020s’) and 2070–2079 (‘2070s’).
CLIMATE IMPACT ON IRRIGATION REQUIREMENTS 283
of IRnet and, concurrently, an increase of IRnet on two thirds of the area equipped
for irrigation in 1995.
In order to assess the problem of water scarcity, and for water management
decisions, the appropriate averaging units for irrigation requirements are not world
regions or countries but river basins. Table III lists a few large river basins with
extensive irrigation and their total long-term average irrigation requirements for
baseline and changed climatic conditions. Even today, the water quantity situation
in all the basins can be regarded as stressed. Climate change has almost no effect
on total IRnet in three of the nine basins (Colorado, Huangho/Tientsin and Mur-
ray/Darling). It leads to a decrease of IRnet in two (Nile, Euphrates/Tigris) and to an
increase in four basins (Indus, Ganges, Godavari, Mississippi). The high increase
in the Godavari basin, by more than 50%, is mainly due to the shift of areas with
multicropping within South Asia to the basin. In the Mississippi basin, where no
multicropping is assumed to occur, IRnet increases by 15%, or 6 km3 /yr, in the
2020s and by 13% in the 2070s.
4.3. IMPACT OF CLIMATE VARIABILITY ON NET IRRIGATION REQUIREMENTS
For an assessment of water scarcity, it is necessary to consider not only the situation
under long-term average climatic conditions but also in typical dry years. Regions
with a high interannual climate variability suffer more from water scarcity than
comparable regions with a more even climate. Figure 3a shows how much IRnet in
a 1-in-10 dry year is increased compared to the baseline climate. Only in 1 out of
10 years will IRnet even be higher. The 1-in-10 dry year is cell-specific, i.e., that the
high demands do not occur simultaneously in a river basin. The increase of IRnet
in the 1-in-10 dry year is a measure of the climate variability to which the farmer
and the irrigation water supply has to respond. In such years, the water supply must
be increased by the amount shown in Figure 3a, as compared to average climatic
conditions, or the farmer cannot irrigate the total irrigated area with the optimal
amount of water. In general, the higher the long-term average IRnet is, the lower the
percentage increase in the cell-specific 1-in-10 dry year will be. However, there are
regional differences; for the same average values, the variability is higher in North
America and Southern Africa than in Europe and Northern Africa. In regions with
a high average IRnet (above 800 mm/yr), where essentially all the water necessary
for crop growth must be provided by irrigation, the increase of IRnet in a 1-in-10
dry year is low (e.g., in Northern Africa less than 10% or 20–70 mm/yr). In regions
with an average IRnet of 300–800 mm/yr, the increase is more significant (e.g., in
Southeast Europe 10–30% or 60–100 mm/yr, and in the western U.S.A. 10–50% or
80–240 mm/yr). Where the average IRnet is between 150 and 300 mm/yr, increases
of 30–50% may occur, such as in southeastern China (corresponding to 50–150
mm/yr) or even of 50–100%, such as in the eastern U.S.A. (corresponding to 70–
200 mm/yr). It is rather seldom that IRnet in a cell-specific 1-in-10 dry year is more
than double the value under average climatic conditions. This occurs in regions284
Table III
Impact of climate change on computed net irrigation requirements IRnet of large river basins
Irrigated Long-term average IRnet , km3 /yr
area Baseline 2020s 2070s
1995, ECHAM4 HadCM3 ECHAM4 HadCM3
1000
km2
Murray/Darling (Australia) 16.2 12.6 12.4 12.1 12.9 14.0
Huangho/Tientsin Basin (China) 94.3 31.4 31.1 32.7 35.7 32.0
PETRA DÖLL
Indus (Pakistan) 146.5 85.6 88.2 92.4 77.8 96.2
Ganges 189.3 61.5 63.4 93.5 74.6 66.4
Godavari (India) 33.5 13.5 20.9 13.9 24.2 23.0
Euphrates/Tigris 65.2 53.4 50.1 48.1 40.3 45.5
Nile 49.8 47.0 47.0 46.6 41.5 41.5
Mississippi (U.S.A.) 105.4 39.2 45.2 42.0 44.1 44.4
Colorado (U.S.A./Mexico) 12.5 7.7 7.2 7.8 7.5 7.4CLIMATE IMPACT ON IRRIGATION REQUIREMENTS 285 Figure 3. (a) Increase of net irrigation requirement IRnet in cell-specific 1-in-10 dry year as compared to IRnet under baseline climate (irrigated areas of 1995). (b) and (c) Impact of climate change according to ECHAM4 vs. impact of climate variability on IRnet . (b) Change of IRnet between baseline climatic condition and the 2020s compared to the difference of IRnet under baseline climate and in the 1-in-10 dry (or wet) year (interannual variability). (c) Change of IRnet between baseline climatic condition and the 2020s as compared to the maximum difference of IRnet for the three climate normals 1901–1930, 1931–1960 and 1961–1990 (multidecadal variability). Only those cells are shown in which IRnet per unit cell area was more than 1 mm/yr (baseline climate, 1995 irrigated areas).
286 PETRA DÖLL
with rather small requirements per unit irrigated area (average IRnet 40–60 mm/yr)
such as in Japan, northeastern China and Mexico.
4.4. COMPARISON OF THE IMPACT OF CLIMATE CHANGE TO THE IMPACT OF
CLIMATE VARIABILITY
To compare the impact of climate change on irrigation requirements to the im-
pact of climate variability such that the severity of climate change impacts can be
assessed, a precise definition of both terms is necessary. The impact of climate
change on IRnet in decade X is expressed as the difference to the average IRnet for
the climate normal 1961–1990:
IRnet_avg (X) − IRnet_avg (1961–90) . (3)
There are a variety of measures of climate variability. Here, the impact of cli-
mate variability is defined by two measures, one expressing interannual variability
and one expressing the long-term multidecadal variability. Interannual climate
variability is expressed in terms of the 1-in-10 dry or 1-in-10 wet year as
IRnet_1−in−10−dry−year (1901–95) − IRnet_avg (1961–90) if
IRnet_avg (X) ≥ IRnet_avg (1961–90)
(4)
IRnet_avg (1961–90) − IRnet_1−in−10−wet−year (1901–95) if
IRnet_avg (X) < IRnet_avg (1961–90) .
If the cell-specific IRnet increases due to climate change, the climate change impact
is compared to the impact of a 1-in-10 dry year, and if IRnet decreases due to
climate change, climate variability is defined in term of a 1-in-10 wet year. The
multidecadal climate variability measure reflects the long-term variability of irri-
gation requirements (per unit irrigated area) during the 20th century and is defined
in terms of the three climate normals of the 20th century as
|IRnet_avg (1961–90) − IRnet_avg (1931–60)| ,
max |IRnet_avg (1961–90) − IRnet_avg (1901–30)| , . (5)
|IRnet_avg (1931–60) − IRnet_avg (1901–30)| ,
Figures 3b,c compare the impact of climate change by the 2020s as computed
by ECHAM4 with the impact of interannual and multidecadal climate variability,
respectively. In most of Europe, China and Australia and in the Midwest of the
U.S.A., the impact of climate change on IRnet is smaller than that of interannual
climate variability as defined by the 1-in-10 year (Figure 3b). The opposite is true
e.g. for the western U.S.A., for Spain, Egypt and most of India. The differences
between the IRnet -values for the three 30-year climate normals of the 20th century
are smaller than the differences between the IRnet -values for the baseline climate
and the IRnet -values in the 1-in-10 year; in Figure 3c, climate change impacts areCLIMATE IMPACT ON IRRIGATION REQUIREMENTS 287
Table IV
Impact of climate change vs. impact of climate variability on net irrigation requirement
Percent of global irrigated area
Variability: Variability:
1-in-10 dry/wet year multidecadal
2020s 2070s 2020s 2070s
Increase of IRnet due to climate change 46 28 24 13
but weaker than impact of climate 50 25 27 11
variability
Increase of IRnet due to climate change 20 34 42 49
and stronger than impact of climate 19 39 42 53
variability
Decrease of IRnet due to climate change 16 13 9 8
but weaker than impact of climate 18 14 12 8
variability
Decrease of IRnet due to climate 18 25 25 30
change and stronger than impact of 13 22 19 26
climate variability
100 100 100 100
100 100 100 100
Irrigated areas of 1995, ECHAM4 (top) and HadCM3 (bottom, in italics) climate change
scenarios.
seen to dominate most irrigated areas of the globe (except in China). This shows
that the expected anthropogenic climate change in the first decades of the 21st
century will have a larger impact on irrigation requirements almost worldwide than
the long-term climate variations that occurred during the 20th century.
Table IV indicates the percentages of the global irrigated area for which the
impact of climate change is stronger or weaker than the impact of climate vari-
ability. Considering the interannual variability of the 1-in-10 year, in the 2020s
climate change dominates over climate variability on 38% of the areas equipped for
irrigation in 1995, and on 59% in the 2070s. On 20% of the area, in the 2020s, and
on 34%, in the 2070s, IRnet will have increased compared to the baseline climate,
and the increase will be larger than the differences between IRnet in the 1-in-10 dry
year and under baseline climate. Looking at the long-term climate variability of
the 20th century, this critical area increases to 42% (2020s) and 49% (2070s) of the
total irrigated area.288 PETRA DÖLL
4.5. INFLUENCE OF THE SELECTED CLIMATE MODEL
Ideally, the ECHAM4 and the HadCM3 climate change scenarios should be similar
as they are computed based on very similar scenarios of anthropogenic emis-
sions. However, the calculated values of future precipitation and temperature differ
significantly; the reasons for this are concisely discussed in Arnell (1999). On
the global average, ECHAM4 predicts a warmer but much wetter climate than
HadCM3 for the 2020s, and an even wetter climate for the 2070s with smaller
temperature changes than HadCM3, in particular at low latitudes. In particular,
the spatial patterns of precipitation changes of the two climate scenarios differ
considerably (Figure 2). Both, however, predict, for the 2020s, strongly decreased
precipitation in Egypt and the Arabian Peninsula, Northeast Brazil and the eastern
part of Southern Africa. In North America and most of Europe, the precipitation
decrease is less pronounced in the HadCM3 scenario than in the ECHAM4 sce-
nario, while the opposite is true for Italy, Southeast Europe and southern parts
of the former Soviet Union. In northern China, the ECHAM4 model results in a
strong precipitation increase while the HadCM3 model computes, in some areas, a
precipitation decrease. These differences in precipitation changes are reflected by
the respective computed changes of IRnet shown in Figures 1b (ECHAM4) and 1c
(HadCM3).
Under the HadCM3 scenario for the 2020s, IRnet -values of 11 out of the 17
world regions are higher than those under the ECHAM4 scenario (Table II). The
global IRnet increases are approximately 50% larger under the HadCM3 scenario as
compared to the ECHAM4 scenario (increases of 5.1% vs. 3.3% until the 2020 and
5.5% vs. 7.8% until the 2070s). Looking at the river basins (Table III), both climate
scenarios agree well for the Nile. For the Euphrates/Tigris basin, both scenarios
result in a decrease of IRnet , but show different dynamics. The differences in the
Indus basin can be explained mainly by different precipitation scenarios. The very
different estimates for the Godavari and Ganges basins result from both different
estimates of precipitation change and multicropping (the latter due to different
estimates of temperature change).
When comparing the impact of climate change to the impact of climate variabil-
ity, the spatial pattern resulting from the two different climate scenarios correspond
to those in Figures 1b,c. For the global totals, the differences between the results
for the two GCMs are small (Table IV). Under both climate scenarios, the area
dominated by climate increases from the 2020s to the 2070s.
5. Discussion and Conclusions
This global-scale study examines and quantifies the impacts of climate change
and climate variability on net irrigation requirements IRnet and thus provides new
information required for addressing the issues of water and food scarcity in theCLIMATE IMPACT ON IRRIGATION REQUIREMENTS 289
21st century. Applying the Global Irrigation Model GIM, it combines the best
information currently available on the global scale into a first model-based analysis.
For areas that were equipped for irrigation in 1995, GIM does not only simulate
the effect of climate change on IRnet during the present-day growing seasons, but
also the climate-induced change in cropping patterns and growing seasons. The
severity of the climate change impact on IRnet is assessed by comparing the impact
of climate change to the impact of climate variability.
To evaluate the significance of the results of this study, it is necessary to dis-
cuss the many sources of uncertainty. First of all, (almost) the same scenarios of
greenhouse gas emissions result in rather different climate change scenarios, if
simulated by different GCMs (see Figure 2). Thus, irrigation modeling can only
aim at providing the best estimate of the impact of GCM-specific climate scenarios
on irrigation requirements, and not at a direct estimate of the impact of certain
anthropogenic greenhouse gas emissions.
Another type of uncertainty is related to the way how GCM results are applied
in the study. Due to the low spatial resolution of GCMs and their inability to re-
produce current climate appropriately, it is necessary to create ‘secondary’ climate
scenarios by combining the best estimate of historic climate with climate change
as simulated by GCMs (see Section 3.1). This leads to climate patterns that are
no longer ‘physical’ in the sense that they do not obey the rules of conservation
of mass, momentum and energy, and in particular if the values of the observed
and modeled current climate variables differ significantly, the resulting secondary
climate scenario might not be plausible anymore. In this study, the secondary cli-
mate scenario did not take into account changes in humidity and sunshine hours
(cloudiness), which, at least globally averaged, should lead to an overestimation
of future potential evapotranspiration and thus IRnet . However, it is well known
that the modeling of clouds and water vapor in the atmosphere is one of the main
sources of uncertainty in climate modeling (IPCC, 2001). Besides, the fact that
GCMs generally do not consider the effects of increase CO2 concentrations on
plant physiology, possibly leads to an underestimation of regional warming and an
overestimation of humidity (and cloudiness) in particular over tropical continents
(IPCC, 2001). Due to these uncertainties in climate modeling, it currently does not
appear to be advisable to include changes in humidity and cloudiness in studies
on the impact of climate change on irrigation requirements. Unfortunately, it is not
possible to say what the consequences of this non-inclusion are for the modeled
changes of IRnet .
The lack of knowledge on presently irrigated crops (what crop is irrigated where
and when), which results in the simplistic modeling of the cropping pattern and
the growing seasons of only two crops (rice and non-rice), causes a high degree
of uncertainty in the assessment of the current irrigation requirements as well
as in the assessment of climate change impacts. In particular if perennial crops
like sugar cane or banana are irrigated, they would be affected by climate change
quite differently than the model crops with a growing period of only 150 days.290 PETRA DÖLL
Any simulated climate-induced changes of the cropping pattern and of the start
of the growing season (which are modeled by GIM with the aim of optimizing
crop productivity and water requirements) can only indicate potential adaptation
necessities. For example, if an area is simulated to switch to multicropping, this
indicates that this area is more favored by climate change than other irrigated areas
within the same world region. If the growing season is shifted towards the cooler
part of the year, for example, this could indicate that for some crop types, tem-
perature increase is detrimental to crop productivity in the summer. The changes
in irrigation requirement that are due to the indirect impact of climate change (via
cropping patterns and growing seasons), which occur, for example, in India, must
be interpreted with care. However, for determining the impact of climate change
on irrigation requirements, it appears to be appropriate to include these indirect cli-
mate change effects, as they represent, in a very coarse manner, the adaptation that
would occur if farmers continued to select cropping patterns and growing seasons
according to the same criteria for optimal climatic conditions as today. Obviously,
any adaptation would be strongly affected by economic conditions, which are not
considered in this study.
Finally, what are the possible implications of neglecting the impact of in-
creased atmospheric CO2 concentrations on crop physiology? If crop productivity
remained the same, potential evapotranspiration and thus IRnet would decrease if
CO2 concentrations increased. ‘More crop per drop’, however, could also result in
an increased crop productivity; then, the difference between the area-specific IRnet
with and without consideration of the fertilization effect might become zero.
Currently, it is not possible to quantify the discussed uncertainties. Anyway, the
actual impacts of climate change are much more complex than could be modeled
here. A changing climate might, for example, worsen growing conditions or water
availability in certain regions of the world so much that irrigated agriculture must
shift to other regions.
Thus, when interpreting the results of the study summarized below, its limits
and the related uncertainties need to be kept in mind. The simulations of irrigation
requirements under two climate change scenarios indicate that climate change may,
in most areas, lead to a shift in the optimal growing period, often by a month
or more into the winter season, and may sometimes even cause a change in the
cropping pattern. Although anthropogenic climate change is expected to lead to
an increase in precipitation over land globally, the simulation of climate change
impacts on IRnet on the areas equipped for irrigation in 1995 indicates that IRnet is
likely to increase on about two thirds of these areas by the 2020s (and the 2070s).
This is due to the increased temperature and thus potential evapotranspiration,
and to the strong spatial heterogeneity of precipitation increases and decreases.
Increases (or decreases) of IRnet of up to 30% are common even without a change
in the cropping intensity.
On about 20% (for the 2020s) and 35% (for the 2070s) of the irrigated area, the
increase of IRnet resulting from climate change will be stronger than the increaseCLIMATE IMPACT ON IRRIGATION REQUIREMENTS 291
of IRnet in a 1-in-10 dry year compared to average climatic conditions. On 42%
and 50%, respectively, the anthropogenic climate change in the 21st century will
lead to an increase of IRnet that is stronger than the impact of the long-term climate
variations that occurred during the 20th century.
The global total of IRnet is computed to increase by 3–5% until the 2020s and
by 5–8% until the 2070s. On the scale of world regions, the modeled increases are
largest in South Asia, the region with the largest current IRnet , where up to 15% (or
56 km3 /yr) more water will be required in the 2070s for irrigating the same areas
as today. The second most important world region with respect to irrigation, the
Middle East, is simulated to experience a small decrease in IRnet , caused mainly by
a shift of the growing seasons towards the winter. The third most important region,
East Asia (mainly China), will not be affected much. However, it has to be stressed
that averaging changes in IRnet over world regions or the globe is meaningful only
for an assessment of food security under conditions of functioning regional or
global markets.
For questions related to water resources management, river basins are the appro-
priate averaging unit. At the river basin scale, the differences between the climate
scenarios computed by different GCMs are generally significant. Nevertheless, for
the large river basins of the world with extensive irrigation, at least the tenden-
cies (decrease or increase) of the changes of IRnet computed with the two climate
scenarios are mostly the same. According to both GCMs, the Mississippi basin
(where no multicropping is assumed to take place) will suffer from an increase
of IRnet of about 15%. For the Ganges and Godavari, the large discrepancies be-
tween the increases of IRnet derived from the two climate scenarios stem from the
climate-dependent reallocation of areas with multicropping among the river basins
of South Asia, while for the Indus, the discrepancies are due to different pre-
cipitation patterns. The highly stressed river basins Colorado, Hoangho/Tientsin,
Murray/Darling, Euphrates/Tigris and Nile, in which IRnet is of the same order
of magnitude as the measured discharges, will not be affected much by climate
change or even have decreasing requirements. In these basins, however, even small
increases of IRnet will cause problems. Besides, it is important to note that in river
basins with a future climate-induced increase of IRnet , the very likely concurrent
decrease of the natural discharge will make it more difficult to fulfill the additional
water demand.
What implications does this study have for the future of irrigated agriculture?
It shows clearly that assessments of the possibilities of extending irrigation should
consider the impact of climate change on irrigation requirements. The negative
impact that climate change is likely to have in many regions of the globe, through
increased per hectare irrigation requirements, may be yet another factor limiting
irrigation. It is advisable to consider a shift of irrigated agriculture to regions
where climate change will decrease per hectare irrigation requirements. In any
case, however, comprehensive assessments are necessary, which take into account292 PETRA DÖLL
the future water use by the domestic and industrial sectors as well as the future
water resources situation.
Acknowledgments
The author appreciates the constructive criticism of two anonymous reviewers,
which substantially helped to improve the paper.
References
Adams, R. M., Rosenzweig, C., Peart, R. M., Ritchie, J. T., McCarl, B. A., Glyer, J. D., Curry, R. B.,
Jones, J. W., Boote, K. J., and Allen, L. H.: 1990, ‘Global Climate Change and U.S. Agriculture’,
Nature 345, 219–224.
Alcamo, J., Henrichs, T., and Rösch, T.: 2000, World Water in 2025 – Global Modeling and Scenario
Analysis for the World Commission on Water for the 21st Century, Kassel World Water Series
Report 2, Center for Environmental Systems Research, University of Kassel, Germany (can be
downloaded from http://www.usf.uni-kassel.de/usf/archiv/dokumente.en.htm).
Allen, R. G., Gichuki, F. N., and Rosenzweig, C.: 1991, ‘CO2 -Induced Climatic Changes in
Irrigation-Water Requirements’, J. Water Resour. Plan. Manage. 117, 157–178.
Arnell, N. W.: 1999, ‘The Effect of Climate Change on Hydrological Regimes in Europe: A
Continental Perspective’, Global Environ. Change 9, 5–23.
Döll, P., Kaspar, F., and Alcamo, J.: 1999, ‘Computation of Global Water Availability and Water Use
at the Scale of Large Drainage Basins’, Mathematische Geologie 4, 111–118.
Döll, P. and Siebert, S.: 2000, ‘A Digital Global Map of Irrigated Areas’, Int. Commission Irrigation
Drainage J. 49, 55–66.
Döll, P. and Siebert, S.: 2001, ‘Global Modeling of Irrigation Water Requirements’, Water Resour.
Res., accepted.
FAO: 1995, Digital Soil Map of the World and Derived Soil Properties, CD-ROM Version 3.5, FAO,
Rome.
Geng, S., Penning, F. W. T., and Supit, I.: 1986, ‘A Simple Method for Generating Daily Rainfall
Data’, Agric. For. Meteorol. 36, 363–376.
Gordon, C., Cooper, C., Senior, C. A., Banks, H., Gregory, J. M., Johns, T. C., Mitchell, J. F. B.,
and Wood, R. A.: 2000, ‘The Simulation of SST, Sea Ice Extents and Ocean Heat Transports
in a Version of the Hadley Centre Coupled Model without Flux Adjustments’, Clim. Dyn. 16,
147–168.
IPCC (Intergovernmental Panel on Climate Change): 2001, Third Assessment Report, Technical
Summary of the Working Group I Report (can be downloaded from http://www.ipcc.ch/).
IRRI (International Rice Research Institute): 1988, World Rice Statistics 1987, IRRI, Manila
(http://www.riceweb.org/).
Jones, R. N.: 2000, ‘Exceeding the Risk of Climate Change Using an Irrigation Demand Model’,
Clim. Res. 14, 89–100.
Legates, D. R. and Willmott, C. J.: 1990, ‘Mean Seasonal and Spatial Variability in Gauge-Corrected,
Global Precipitation’, Int. J. Clim. 10, 111–117.
Leggett, J., Pepper, W. J., and Swart, R. J.: 1992, ‘Emission Scenarios for the IPCC: An Update’,
in IPCC, Climate Change 1992: The Supplementary Report to the IPCC Scientific Assessment,
Cambridge University Press, Cambridge.You can also read